A novel route to copper(II) detection using ‘click’ chemistry-induced aggregation of gold nanoparticles
Carol
Hua
,
William H.
Zhang
,
Swahnnya R. M.
De Almeida
,
Simone
Ciampi
,
Danmar
Gloria
,
Guozhen
Liu
,
Jason B.
Harper
and
J. Justin
Gooding
*
School of Chemistry, The University of New South Wales, Sydney, NSW 2052, Australia. E-mail: justin.gooding@unsw.edu.au; Fax: +61-2-9385 5384; Tel: +61-2-9385 6141
First published on 6th October 2011
Abstract
A simple colorimetric method for the detection of copper ions in water is described. This method is based on the ‘click’ copper(I)-catalyzed azide-alkyne cycloaddition reaction and its use in promoting the aggregation of azide-tagged gold nanoparticles by a dialkyne cross-linker is described. Nanoparticle cross-linking, evidenced as a colour change, is used for the detection of copper ions. The lowest detected concentration by the naked eye was 1.8 μM, with the response linear with log(concentration) between 1.8–200 μM. The selectivity relative to other potentially interfering ions was evaluated.
Introduction
Copper, a metal abundant in nature, has proven essential to the biological function and well being for all organisms.1 Given its abundance, life has been forced to evolve and develop in such a way to compensate for its presence, and eventually incorporate this metal into normal living functions.2 However, copper in high concentrations can induce toxic effects in living organisms, and of particular relevance, can cause severe adverse effects in humans. For instance, copper in drinking water has been suspected of causing liver cirrhosis in children,3 and has been linked to serious neurodegenerative diseases.4 As a result, there is a demand for the development of Cu2+ detection methods that are sensitive, rapid and suitable for in-field detection. Many methods to detect copper ions are available, including the use of electrochemistry,5atomic absorption spectroscopy,6 and inductively coupled plasma mass spectroscopy.5 However, all these methods involve instrumentation which may be impractical for in-field work.Gold nanoparticles (AuNPs)-based methods for visual or colorimetric sensing of metal ions,7 are of interest because of the intense red colour arising from surface plasmon absorption. This intense absorption should allow for both highly sensitive detection and for a simple colorimetric approach. This concept has been explored by Yang et al.,8 who used L-cysteine functionalized AuNPs that selectively coordinate Cu2+ions.However, this optical method did have compromised selectivity as the L-cysteine-modified sensing surfaces have been shown to suffer from interferences from zinc, manganese, lead, silver and nickel.9
In this work, we report on a colorimetric method for the detection of copper ions using the archetypal ‘click’10 reaction – i.e. the copper(I)-catalyzed azide-alkyne cycloaddition11 – to cross-link azide-tagged AuNPs and a soluble dialkyne species, yielding a network of 1,3-disubstitutes [1,2,3]-triazoles. With copper(I) catalyzing the ‘click’ reaction, and thus AuNPs aggregation, its role in catalysis can be conveniently translated into a means of detecting copper(II) presence at very low levels. Further, the ‘click’ reaction can tolerate a wide range of solvents, temperatures and pH values, allowing for the use of this Cu2+ detection method under a variety of conditions.12 Appropriate functionalization of AuNPs with alkyne and/or azide terminated groups is therefore required. This principle has been demonstrated by Zhou et al.13 By using alkyne- and azide-tagged AuNPs, the authors reported the analyte-triggered AuNPs aggregation was accompanied by a colour change and thus gave direct indication of the copper content in the analyte. A detection limit for copper(II) of 50 μM was reported, where other metal ions were found not to interfere with the colorimetric assay. In a more recent, and more elaborate system designed by Xu et al.,14 DNA-functionalised AuNPs have been utilised for an analogous colorimetric Cu2+ detection. Targeted azide- and alkyne-tagging on complementary strands, and subsequent oligonucleotide hybridization, ensured optimal orientation for the ‘click’ reaction to occur efficiently between AuNPs. This resulted in a detection method that is highly selective and highly sensitive, but that, on the other hand, arguably suffers from a far from straightforward interface design.
Here we report a simplified colorimetric method for the detection of copper by using azide-tagged AuNPs. The functionalised AuNPs undergo a ‘click’ reaction with a cross-linker agent, 1,4-diethynylbenzene (DEB), to form [1,2,3]-triazole-linked aggregates (Fig. 1). The protocol relies on minimal synthetic work and basic interface design, as it requires the use of a single AuNPs type (i.e. azide-tagged) and a commercial dialkyne linker.
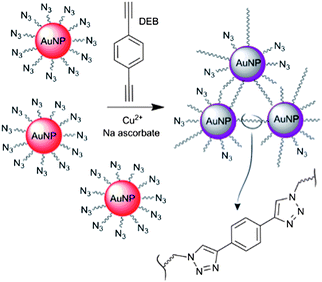 | ||
| Fig. 1 Schematic depiction of the copper-triggered aggregation of AuNPs for Cu2+ detection. | ||
Experimental section
Chemicals
Unless otherwise indicated, all reagents and solvents were purchased in their highest available purity and used without further purification. Ethanol used in the click reactions was distilled prior to use. Millipore Milli-Q (18 MΩ cm) water was used in all experiments. 3-Azidopropylamine was synthesized according to literature methods from 3-bromopropylamine hydrobromide and sodium azide.15 To a stirred solution of 3-bromopropylaminehydrobromide (3.2 g, 14.6 mmol) in water (10 mL), a 3.2 M aqueous solution of sodium azide (15 mL, 48 mmol) was added in one portion with stirring under argon. The reaction mixture was then heated to reflux and the reaction continued for 16 h. The oil bath was removed, the solution cooled in an ice/water bath and diethyl ether added to the solution (50 mL). To the stirred suspension, potassium hydroxide pellets (4.0 g, 71 mmol) were slowly added while keeping the suspension temperature below 10 °C. Stirring was continued for 30 min at ca. 0 °C before transferring the mixture to a separation funnel. The organic phase was separated and the aqueous layer extracted with diethyl ether (2 × 25 mL). The pooled organic phase was washed with water (2 × 10 mL), dried over K2CO3, filtered and evaporated in vacuo to give the target azide as a pale yellow oil that was used without further purification (0.81 g, 55%). 1H NMR (300 MHz, CDCl3) δ: 3.37 (t, 2H, J = 6.8 Hz), 2.79 (t, 2H, J = 6.8 Hz), 1.77–1.68 (m, 2H), 1.39 (bs, 2H); 13C NMR (75.5 MHz, CDCl3) δ: 49.17, 39.33, 32.46; IR (NaCl, cm−1): 3367, 2949, 2871, 2097, 1663, 1595, 1456, 1259.Instrumentation
UV-visible spectra was acquired on either a Shimadzu 2401-PC or a Varian Cary 50 spectrometer, where the baseline was recorded prior to acquisition of spectra. Where temperature control was required, a Varian Single Cell Peltier Accessory was used. NMR spectra were acquired on a Bruker Avance DPX 300 spectrometer All spectra were obtained at 298 K and were referenced internally using the residual protonated solvent resonances. Signals are recorded in chemical shift (in ppm from residual solvent resonances referenced to TMS). Scanning electron microscopy (SEM) images were carried out using a Hitachi S-900 microscope. The sample was prepared by drop-casting of the AuNPs colloid over aluminum foil adhered to a brass plate by conductive carbon tape. The solvent was evaporated after 5 min and samples were dried under a stream of nitrogen gas before SEM imaging. Purity of all metal ion solutions used in this study was evaluated by inductively-coupled plasma atomic emission spectroscopy (ICP-AES) using a Perkin Elmer Optima DV7300 ICP-OES instrument. The instrument was calibrated with four standard solutions at concentrations of 0.1, 1, 10 and 100 ppm.Preparation of functionalized AuNPs
AuNPs of ca. 18 nm diameter were prepared by the citrate reduction of chloroauric acid (HAuCl4) according to the method of Frens et al.16 Briefly, 100 mL of 1.6 mM HAuCl4 solution in water was boiled while stirring vigorously. Sodium citrate aqueous solution (10 mL of 38.8 mM) was then rapidly added into the boiling HAuCl4 solution, resulting in a colour change from light-yellow to deep-red. After boiling for 10 min the colloid was cooled to room temperature over a 15 min period. The colloid was then filtered through a 0.22 μm membrane filter and stored in the dark at room temperature before use. The concentration of AuNPs was estimated by UV-vis spectroscopy to be about 4 nM, based on an extinction coefficient of (8.78 ± 0.06) × 108 M−1 cm−1 at λ = 506 nm for 18 nm particles.17 As-prepared AuNPs exhibited UV-visible absorption maxima at 526 nm that is in good agreement with previous literature. Azide-tagged AuNP were obtained by the ligand exchange reaction with 3-azidopropylamine. In brief, a solution of 3-azidopropylamine (30 μL, 2 mM in 2![[thin space (1/6-em)]](https://www.rsc.org/images/entities/char_2009.gif) :1 ethanol:water) was added to the as-prepared gold colloid (0.5 mL). The mixture was agitated for 5 min at room temperature, and then was centrifuged for 30 min (11529 × g) to obtain the azide-tagged AuNPs. The obtained azide-functionalized AuNPs were washed with 2:1 ethanol:water (3 × 5 mL), centrifuged, and finally redispersed in 2:1 ethanol:water (1.3 mL).
:1 ethanol:water) was added to the as-prepared gold colloid (0.5 mL). The mixture was agitated for 5 min at room temperature, and then was centrifuged for 30 min (11529 × g) to obtain the azide-tagged AuNPs. The obtained azide-functionalized AuNPs were washed with 2:1 ethanol:water (3 × 5 mL), centrifuged, and finally redispersed in 2:1 ethanol:water (1.3 mL).
Copper(II) detection assay
To 0.54 mL of azide-tagged AuNPs in 2:1 ethanol:water, the ‘click’ reagents were added: i) 1,4-diethynylbenzene (40 μL, 0.3 mM solution in ethanol), sodium ascorbate (200 μL, 1 mM solution in 2:1 ethanol: water) and copper sulfate (200 μL, 0.5 mM solution). The copper solution was added last to ensure an accurate start time in the monitoring of the assay. The reaction mixture was mixed well and the reaction monitored by UV-Vis over the 400–800 nm range. Four types of control experiments were carried out, following the ‘click’ protocol of above (i.e.Cu2+ detection assay) with minor modification. In brief, reagents added to the AuNPs colloid (0.5 mL) were: control 1) all reagents excluding Cu2+; control 2) all reagents excluding 3-azidopropylamine; control 3) all reagents excluding 4-diethynylbenzene; control 4) all reagents excluding ascorbic acid.
In each case, after addition of all relevant reagents the reaction mixture was mixed well and the reaction monitored by UV-Vis over 400–800 nm the range for 30 min.
Concentration dependence studies
The same method was followed as for Cu2+ detection assay, where the concentration of copper was varied but the volume was kept constant at 200 μL for the total volume of copper solution. All stock copper(II) solutions were diluted with Milli-Q water as required by pipetting appropriate volumes from the standard solutions (5 mM, 0.5 mM and 0.05 mM). The standard solutions were prepared by serial dilutions from a stock solution.Interference studies
The experimental procedure previously specified for the general copper(II) assay was followed. However, instead of adding the copper solution (200 μL, 0.5 mM) an equivalent concentration of a specified metal solution was added. The UV-Vis spectrum was monitored over a 10 min period immediately after the addition of the metal ions, and the rate of change in absorbance at the wavelength of 663 nm was used as a measure of the interference effect of a particular metal ion. These tests were performed in duplicate. If the first assay had a rate different to the control assay with no metal, the spectrum of the second assay would be observed for 10 min without any added metal ions, and after this 10 min period the specified metal ion solution would be added and also scanned for a 10 min period. This was to ensure that a change in rate was due to addition of the metal ion solution rather than other effects, such as copper contamination or random error.In addition, the colour of the assay after this time frame was compared to a time zero assay, and qualitatively assessed if a colorimetric distinction could be made. This was to estimate the interference of the metal (if any) on a practical scale.
Gap-mode Raman spectra
Samples for Raman spectroscopy were prepared by mixing in an Eppendorf tube (if necessary) before a drop (5 μL) was placed onto a stainless steel plate for measurement. Gap-mode Raman spectra were obtained using a Perkin-Elmer Raman station 400 spectrometer with a low magnification objective in a back scattering geometry. The instrument operated at λex = 785 nm (infrared) with a maximum of 100 mW laser power focused to a 100 micron sample spot size. The backscattered light was collected to a USB video camera coupled to a Rayleigh filter and a Peltier air-cooled CCD (Charge Coupled Device) detector. This system was equipped with an Echelle™-based spectrograph which avoids the requirement to “stitch” high-resolution scans together.Results and discussion
Absorption spectra of azide-modified AuNPs displayed a surface plasmon absorption band maximum at 528 nm. SEM images of functionalized AuNPs show uniform size-distribution, and an approximate particle diameter of 18 nm (Fig. 2a). In a typical copper assay experiment the ‘click’ reaction was monitored by UV-Vis over the 400–800 nm range, with a red to dark blue colour change appreciable to the naked-eye over the first 5 min of the assay (Fig. 3a–b). A corresponding red shift was observed in the UV-Vis spectrum with the absorbance maxima shifting from 528 to 663 nm (Fig. 3d). The red shift is characteristic of AuNPs cross-linking and aggregation.18 Aggregation of the AuNPs is further supported by SEM imaging (Fig. 2b). The rate of aggregation is a function of Cu2+ concentration, but in all cases aggregation was clearly visible within 20 min from the commencement of the assay. If the reaction was left to proceed for an extended period, precipitation was observed, leaving the supernatant colourless (Fig. 3c).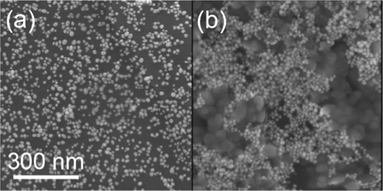 | ||
| Fig. 2 SEM images of (a) azide-tagged AuNPs and (b) aggregated AuNPs after addition of 50 μM Cu2+ in the presence of cross-linker DEB. | ||
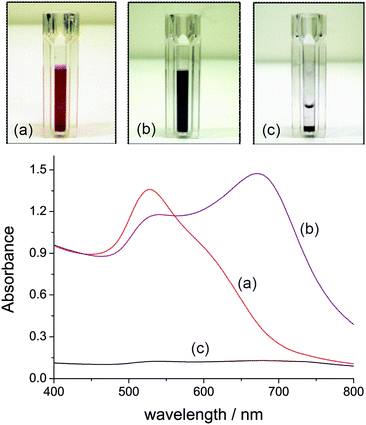 | ||
| Fig. 3 UV-Vis spectral evolution for the aggregation of azide-tagged AuNPs (ca. 2.16 pM) in the presence of Cu2+ (50 μM) and DEB (30 mM). (a) Reaction time of 1 min; (b) 15 min; (c) the assay after an extended period of time (>8 h) allowing a black solid to precipitate. | ||
To further confirm the reaction proceeded as depicted in Fig. 1, gap-mode Raman spectra19 were obtained for the AuNPs prior to and after the “click” reaction had proceeded. Upon aggregation, sharp peaks at 1108 and 1587 cm−1 were observed to increase in magnitude, corresponding to the stretches of the [1,2,3]-triazole ring that have formed as a result of the ‘click’ reaction (Fig. 4).12 Over 40 min a gradual increase of both peaks due to formation of the triazole was observed, thus giving spectroscopic evidence that the cross-linking species is a triazole moiety and that the ‘click’ reaction has occurred. Control experiments were conducted to demonstrate the importance of each component. A series of controls experiments were performed involving all reagents except for the absence of i) 3-azidopropylamine on the AuNPs, ii) DEB, iii) sodium ascorbate and iv) Cu2+ ions. In all control experiments, no discernible colour changes over a period of 30 min were observed.
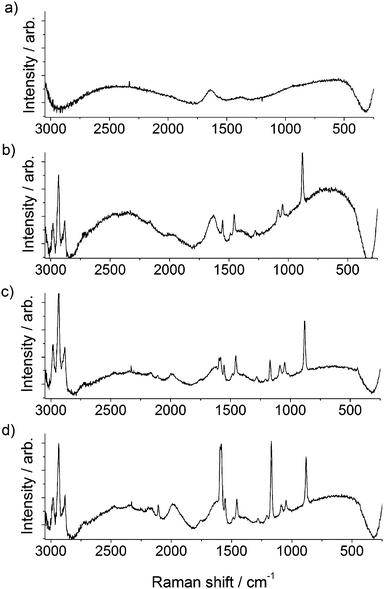 | ||
| Fig. 4 Raman spectra (λex = 785nm) of (a) citrate stabilized AuNPs, (b) azide functionalized AuNPs, (c) ‘click’ reaction mixture prior to the addition of copper, and (d) aggregated AuNPs after the addition of copper. | ||
To determine the minimum concentration of Cu2+ ions that can be detected by this method visually (i.e. by the naked eye), different concentrations of Cu2+ were added into the ‘click’ reaction mixture of azide-tagged AuNPs and DEB so that the final concentration of Cu2+ in the reaction mixture were 200 μM, 100 μM, 50 μM, 30 μM, 25 μM, 20 μM, 10 μM, 5 μM, 2.5 μM, 2 μM, and 1.8 μM. The lowest concentration at which there was a distinct colour change detectable by eye was 1.8 μM of Cu2+ which is significantly lower than the 20 μM reported by Xu et al.14 For [Cu2+] > 50 μM, the assay was observed to change colour from red to blue. For [Cu2+] < 50 μM, the assay was observed to change colour from red to purple. A linear relationship can be derived from plotting the absorbance at 663 nm against [Cu2+] is shown in Fig. 5 (slope was 0.379 ± 0.041) revealing there is potential for this method to provide both quantitative dependence on absorbance and a detection limit with the naked eye of only 1.8 μM.
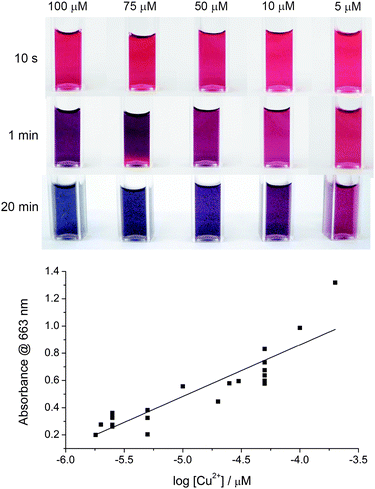 | ||
| Fig. 5 Calibration data. (a) Photographs as a function of time for azide-tagged AuNPs after ligation in the presence of DEB and different concentrations of copper ions, and (b) the assay calibration curve. Absorbance in (b) was monitored at 663 nm after 20 min from the addition of Cu2+ to the assay mixture. | ||
Next, attention was focussed on potential metal ions that could interfere with the copper detection assay. As a comparative measure, the nominal concentration of the metal was approximately the same as the copper concentration (50 μM). The results of this test show that Fe3+, Fe2+, Co2+, Ni2+, Ba2+, Zn2+, Ca2+, K+, Li+ and Ag+ do not interfere with the colorimetric method. However with Cr3+, Pb2+, and Cd2+ a detectable colour change could be observed by eye. Upon examination of these metals, we see that those that interfere are potentially more or as harmful as copper. In practice this interference does not detract from the method's capacity as an on-field colorimetric method for water safety. This method can be used qualitatively to indicate the safety of a water sample, as well as to provide an approximate concentration range of the metal that can act as a guiding point for more accurate analyses.
Finally, laboratory tap water was analysed using the nanoparticle strategy, and the results compared with ICP-OES measurements. The tap water sample had a mean Cu2+ content of 9 ± 2 μM according to the nanoparticle method presented herein. In comparison, ICP-OES measurements gave the Cu2+ content of the water sample as 15 μM. These values are reasonably concordant with the difference being attributed to the nanoparticle strategy measuring free Cu2+ while the ICP-OES measured total copper.
Conclusions
In summary, an experimentally simple method for the colorimetric detection of copper species based on the copper catalyzed click reactions has been described. This method employs azide-modified gold nanoparticles which, in the presence of a dialkyne and ascorbic acid, aggregate when Cu2+ is present in a sample. The aggregation of the particles results in a colour change discernable by the naked eye at concentrations as low as 1.8 μM. The extent of colour change is linear with the concentration of Cu2+ and was shown to be reasonably selective for copper. Overall, these results demonstrate that this method is capable of being a simple, practical and reliable method of quantitatively determining the concentration of copper in water samples.Notes and references
- P. G. Georgopoulos, A. Roy, M. J. Yonone-Lioy, R. E. Opiekun and P. J. Lioy, J. Toxicol. Environ. Health, Part B, 2001, 4, 341 CAS.
- N. W. Solomons, J. Am. Coll. Nutr., 1985, 4, 83 CAS.
- B. P. Zietz, H. H. Dieter, M. Lakomek, H. Schneider, B. Keßler-Gaedtke and H. Dunkelberg, Sci. Total Environ., 2003, 302, 127 CrossRef CAS.
- K. J. Barnham, C. L. Masters and A. I. Bush, Nat. Rev. Drug Discovery, 2004, 3, 205 CrossRef CAS.
- W. Yang, D. Jaramillo, J. J. Gooding, D. B. Hibbert, R. Zhang, G. D. Willett and K. J. Fisher, Chem. Commun., 2001, 1982 RSC.
- M.-S. Chan and S.-D. Huang, Talanta, 2000, 51, 373 CrossRef CAS.
- Z.-q. Tan, J.-f. Liu, R. Liu, Y.-g. Yin and G.-b. Jiang, Chem. Commun., 2009, 7030 RSC.
- W. Yang, J. J. Gooding, Z. He, Q. Li and G. Chen, J. Nanosci. Nanotechnol., 2007, 7, 712 CAS.
- W. Yang, J. Justin Gooding and D. Brynn Hibbert, J. Electroanal. Chem., 2001, 516, 10 CrossRef CAS.
- H. C. Kolb, M. G. Finn and K. B. Sharpless, Angew. Chem., Int. Ed., 2001, 40, 2004 CrossRef CAS.
- (a) V. V. Rostovtsev, L. G. Green, V. V. Fokin and K. B. Sharpless, Angew. Chem., Int. Ed., 2002, 41, 2596 CrossRef CAS; (b) C. W. Tornøe, C. Christensen and M. Meldal, J. Org. Chem., 2002, 67, 3057 CrossRef.
- M. Meldal and C. W. Tornøe, Chem. Rev., 2008, 108, 2952 CrossRef CAS.
- Y. Zhou, S. Wang, K. Zhang and X. Jiang, Angew. Chem., Int. Ed., 2008, 47, 7454 CrossRef CAS.
- X. Xu, W. L. Daniel, W. Wei and C. A. Mirkin, Small, 2010, 6, 623 CrossRef CAS.
- M. James, S. Ciampi, T. A. Darwish, T. L. Hanley, S. O. Sylvester and J. J. Gooding, Langmuir, 2011, 27, 10753 CrossRef CAS.
- G. Frens, Nature Phys. Sci., 1973, 241, 20 CAS.
- X. Liu, M. Atwater, J. Wang and Q. Huo, Colloids Surf., B, 2007, 58, 3 CrossRef CAS.
- Y. Zhang, B. Li and C. Xu, Analyst, 2010, 135, 1579 RSC.
- S. Nie and S. R. Emory, Science, 1997, 275, 1102 CrossRef CAS.
| This journal is © The Royal Society of Chemistry 2012 |