Elastic block copolymer nanocomposites with controlled interfacial interactions for artificial muscles with direct voltage control
Hristiyan
Stoyanov
,
Matthias
Kollosche
,
Sebastian
Risse
,
Denis N.
McCarthy
and
Guggi
Kofod
*
Applied Condensed-Matter Physics group, Institute for Physics and Astronomy, University of Potsdam, Karl-Liebknecht str. 24/25, Potsdam-Golm, 14476, Germany. E-mail: guggi.kofod@uni-potsdam.de; Tel: +493319775464
First published on 4th October 2010
Abstract
Soft, physically crosslinking, block copolymer elastomers were filled with surface-treated nanoparticles, in order to evaluate the possibility for improvement of their properties when used as soft dielectric actuators. The nanoparticles led to improvements in dielectric properties, however they also reinforced the elastomer matrix. Comparing dielectric spectra of composites with untreated and surface-treated particles showed a measurable influence of the surface on the dielectric loss behaviour for high filler amounts, strongly indicating an improved host–guest interaction for the surface-treated particles. Breakdown strength was measured using a test bench and was found to be in good agreement with the results from the actuation measurements. Actuation responses predicted by a model for prestrained actuators agreed well with measurements up to a filler amount of 20%vol. Strong improvements in actuation behaviour were observed, with an optimum near 15%volnanoparticles, corresponding to a reduction in electrical field of 27% for identical actuation strains. The use of physically crosslinking elastomer ensured the mechanical properties of the matrix elastomer were unchanged by nanoparticles effecting the crosslinking reaction, contrary to similar experiments performed with chemically crosslinking elastomers. This allows for a firm conclusion about the positive effects of surface-treated nanoparticles on actuation behavior.
1 Introduction
Natural muscles are sophisticated three dimensional nano-fabricated actuators with integrated sensors, energy delivery, waste/heat removal, local energy supplies and repair mechanisms. It is not surprising that for many years, human technology has attempted to emulate them with artificial systems. Different types of stimuli responsive polymers have been put forth and extensively studied for their potential applications as artificial muscles, including thermo-responsive shape memory polymers and electro-active polymers (EAP). In particular, electric field stimulated EAP have so far shown the closest similarity in performance characteristics to natural muscle.1–3 Inherently capable of converting electrical energy to mechanical work via large voltage-controlled changes in size or shape, these types of material have high electromechanical coupling efficiency and fast response speed.The class of EAP known as dielectric elastomers combines the best set of characteristics measured for any soft actuator, including high actuation strain, force and elastic energy density coupled with fatigue resistance, scalability and reliability.1,3–5 These dielectric elastomer actuators (DEA) allow for functionality similar to natural muscle, such as actuation, passive spring-like motion and the possibility to modulate the stiffness of the device to provide energy absorption via active damping.6 The reverse active damping mode of operation could also be used as a generator to recapture some of the electrical energy applied to the muscle.6,7 Due to these valuable functionalities, DEA has emerged as the most investigated EAP for artificial muscle development and numerous applications have been developed and demonstrated including biomimetic robots,8 prosthetic devices,6,9 adaptive structures, electroactive fluid pumps,1,2,4,5 conformal skins for Braille screens,10,11 autofocus lens positioner,2,5 self-organised minimum energy structures,12 active smart textiles13 and energy harvesting systems.14 These applications all derive their efficient functionality from the direct voltage control inherent to DEA.
Although having a number of intrinsic advantages over existing actuator technologies, some major limitations of DEA pose great challenges to their broad utilisation. A key limitation is the need for high voltages, which for high-strain DEA are still above 1 kV, a result of the high electric fields (>100 MV/m) needed to drive them. The high voltages can be supplied with commercially available, compact dc-to-dc converters, however, these would still carry a considerable cost relative to the actuator. Further, high voltages are a major safety concern, particularly in some of the potential areas of application, e.g. biomedical devices, biomimetic robots and toys. Hence, materials research is still necessary in order to reduce the operating voltages. This paper deals with the use of insulating nanoparticles as a direct and simple means of improvement of electro-mechanical properties of DEA materials.
A DEA can be regarded as a compliant capacitor, in which actuation is due to the coupling of electrostatic stress with elastic stress. The electrostatic stress TM can be described by Maxwell's pressure,15,16
| TM = εrε0E2 | (1) |
| TE = YSA | (2) |
 | (3) |
This equation is valid only in the case of very low strain or pre-strain. For strains higher than 5–10%, the above equation is replaced by a more complicated nonlinear hyper-elastic equivalent,17 yet the argument remains that the material should have a high ratio of permittivity to stiffness in order to display large strains. The factor β = εrε0/Y can be defined as the electro-mechanical strain sensitivity for a given electric field, which will be used later as a measure of the actuation properties of a given material. If β increases, then the same actuation strain can be achieved at a lower electrical field. Likewise, for the same thickness of the actuator, an increased value of β will lead to lower operating voltages.
A practical approach to materials improvement relies on adding small amounts of filler to an existing elastomer, taking care to improve permittivity without adversely affecting mechanical properties and electrical breakdown. It has been found that conducting fillers such as dyes and semiconducting polymer can lead to improvements,18–21 however, doubts were cast on the mechanism of improvement in some cases,22 and a percolation-based approach was found to be unfeasible.23 The main problems were identified as the reduction of electrical breakdown strength and increase in leakage currents. In contrast, insulating fillers such as high permittivity ceramic particles were also used, as suggested by their suitability for numerous capacitive application in terms of the considerable enhancements of the dielectric properties while maintaining very low dielectric losses.24,25 This approach was attempted for DEA, however, although slight improvements in sensitivity β were observed, so far the approach has met with only moderate success.26,29 The main hindrance was caused by nanoparticle aggregation, leading to poor mechanical integrity. Also, interfacial Maxwell-Wagner polarisation was found to lead to strongly increased electrical losses. The observed improvements in sensitivity were linked to reductions in Young's modulus caused by cavitation26 or the use of plasticisers,29 therefore, until now it remains unclear whether insulating nanoparticles can lead to improved sensitivity when the mechanical properties of the elastomer matrix are not affected.
In this paper, surface-modified ceramic nanoparticles were employed, in order to enhance the matrix-filler (host–guest) compatibility, improve particle distribution and at the same time avoid the introduction of dielectric losses via Maxwell-Wagner polarization. A thermoplastic elastomer matrix was chosen deliberately, in order to maintain the mechanical properties of the matrix, since only when the intrinsic properties of the matrix are unchanged, is it possible to asses whether nanoparticles may lead to the desired improved sensitivity. For chemically/other crosslinking polymers, the addition of fillers could effect the crosslinking process leading to softening of the polymer26,30 which will contribute to improved actuation. For physically crosslinking elastomers, there is no chemical reaction to disrupt, as the crosslinking process occurs through phase separation. Here, the actuation improvement can only be due to improved dielectric properties.
2 Theory
In the following theory section, several figures of merit are introduced and discussed, followed by a presentation of several volumetric dielectric mixing rules for insulating components with a finite dielectric contrast.2.1 Figures of merit
Figures of merit (FOM) help in the comparison between materials with modified properties. Several have been suggested for DEA material characterisation,30–33 including the sensitivity β mentioned above. The maximum actuation strain is limited by the electrical breakdown strength, hence, from eqn (3) above, a pertinent FOM is defined by | (4) |
As implied by Carpi et al.,32 if the actuator is stretched to 100% prestrain along its length before applying the voltage, the appropriate FOM for actuation strain along the length direction becomes
 | (5) |
Another basis of comparison is the electro-static energy density at electrical breakdown23
| fED = ½εrε0E2br | (6) |
Whether materials have been improved by a certain materials strategy can be evaluated by forming the ratio of the respective figures-of-merit.30 The ratio of FOM's describing the sensitivity of the composite material, βc compared to that of the pure elastomer matrix, βm:
 | (7) |
Composites with enhanced permittivity will be beneficial for DEA technology only if the ratio described above is bigger than 1.
2.2 Dielectric mixing rules
Classical dielectric mixing rules are algebraic formulas with which the effective permittivity of heterogeneous mixtures can be predicted as a function of the volume fraction of the constitute materials and their permittivities. The simplest level of prediction is based on the spatial arrangements of two immiscible components and it is expected that the relative permittivity of the composite εc will be found between two extremes, the lower bound for the equivalent series connection of the two materials and the upper bound for the parallel connection, | (8) |
| εc,max = ε1ν1 + ε2ν2 | (9) |
A widely used dielectric mixing rule was proposed by Lichtenecker,34
| ln(εc) = ν1ln(ε1) + ν2ln(ε2) | (10) |
This rule is known as the logarithmic mixing rule and is based only on the principle of random mixtures.
First principles theoretical approaches for the assessment of composite permittivity of heterogeneous systems require the calculation of the polarisabilities and dipole moments of the inclusions that compose the mixture. As several assumptions can be made during these calculations, a large number of analytical models have been proposed, however, as shown in numerous experimental comparisons these models may disagree substantially.27,35–37 The Bruggeman formula38 was found to fit experimental data in the case of high volume fraction composites with spherical inclusions,26,27,39,40
 | (11) |
The more sophisticated Yamada model41 takes the shape of the filler inclusions into account, and can be used in the case when the particle shape differs from spherical, by introduction of a shape parameter n:
 | (12) |
Spherical particles correspond to n = 3. Values above correspond to prolate particles in the direction of applied electric field, while values below are for oblate particles. Evaluation of this mixing rule shows that the shape of the particles will influence the composite permittivity strongly.
3 Experimental section
In the following, material and sample preparation is discussed in detail. Dielectric properties are determined using a network analyzer. The hyperelastic properties are presented via stress-strain curves. The resulting electro-mechanical coupling properties are measured directly by determining the voltage-dependent actuation strain at the constant load corresponding to 100% prestrain.3.1 Materials and preparation of the composite films
A thermoplastic elastomer, SEBS-Dryflex 500040 (poly-Styrene-co-Ethylene-co-Butylene-co-Styrene) compounded with polyolefinic oil, was produced by VTC Elastoteknik AB (Sweden) and was used here as the matrix material. SEBS is a soluble tri-block copolymer, which forms a reversible physically crosslinked elastomer network by phase separation of the styrene hard blocks into nano-size clusters, which are connected by soft amorphous ethylene butylene chains.42300 nm TiO2 nanoparticles in the rutile crystalline phase were used as a high permittivity filler (TiO2 has a density of ρ = 4200 kg/m3). The nanoparticles were either uncoated (R 320, Sachtleben Chemie GmbH, Germany), or had a silicone (PDMS, poly-dimethylsiloxane) oil coating (R 320 D, Sachtleben Chemie GmbH, Germany). The particles have a slightly ellipsoidal shape as revealed by the SEM images, Fig. 1. Rutile titanate shows anisotropic dielectric properties, with static dielectric properties of 86 along the axes a and b and 170 along c.43 For theoretical calculations, the average value of the three spatial directions is used for the static dielectric constant (εs = 128), assuming random orientation of the TiO2 particles inside the polymer matrix.
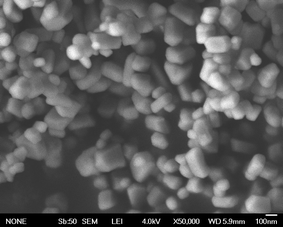 | ||
| Fig. 1 Field effect scanning electron microscope (FESEM) image of rutile TiO2 (R 320 D). | ||
A stock SEBS/toluene solution was prepared by dissolving the polymer at a concentration of 100 g L−1 in an ultrasonic bath (Transonic digital-T490DH, Elma-Hans Schmidbauer GmbH & Co KG, Germany). The required amount of the elastomer solution was added to various weighed masses of TiO2 particles to produce composite dispersions with different volume fractions. To disperse the TiO2 particles each of the prepared solutions were sonicated with an ultrasonic tip (high intensity ultrasonic processor-Vibracell 75041, Sonics & Materials Inc., USA) for 5 min then further sonicated in an ultrasonic bath for 2 h in order to homogenise the mixture, and then finally with the ultrasonic tip for 5 min immediately prior to drop-casting. All composite thin films were drop-cast directly after the final treatment with ultra-sonic tip, after which they were dried on a hot plate at 50 °C for 24 h under a cover to control the rate of evaporation. Then the samples were stored at 50 °C in an oven for several days in order to remove any residual solvent completely. Visual inspection of the samples showed large differences between composites with coated and uncoated particles. All samples with uncoated particles had a tendency towards agglomeration, while samples with coated particles were always smooth and homogeneous. The optical micrograph (Zeiss AXIO Imager.A1m, transmitted light, 20X mag.) of the composite based on uncoated particles show clear evidence of agglomeration (Fig. 2a), which was not prominent for the composite with coated particles. Also included is an SEM (Zeiss Ultra 55+, cryo-fracture with 5 nm sputtered Au, 2.0 kV) of the sample with silicone-coated particles (Fig. 2b), which clearly show how particles are individually distributed within the matrix.
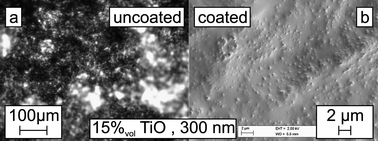 | ||
| Fig. 2 Optical micrograph (transmission mode) of composite with 15%vol uncoated TiO2 (a), and SEM of cryo-fracture surface of composite with silicone oil coated nanoparticles (b). | ||
3.2 Dielectric, electrical breakdown strength and electrical characterisation
The samples for dielectric, electrical breakdown strength and electrical characterisations where prepared in the same way. The above mentioned ultra-sonicated solutions were cast on glass microscope slides (37 × 25mm) with evaporated aluminium electrodes (diameter of 20 mm). For dielectric spectroscopy, top electrodes of 15%vol of carbon black (Printex XE 2-B) in SEBS were used. Frequency dependent dielectric spectroscopy was performed with a LCR meter (HP 4284A) from 20 Hz to 1 MHz at room temperature.Electric breakdown strengths were tested with a programmable high voltage generator with current monitor (HCP 35-35000, FUG Elektronik GmbH), and a special test stand as described in Ref. 44. Samples with the same configuration as for dielectric spectroscopy (but without the carbon black top electrode) where placed in the test stand and a spherical metal electrode pressed into the sample at a known force (50 mN). A voltage ramp was applied to the top electrode at a rate of 50 V s−1 until the sample failed. The current flowing between the electrodes during the ramping procedure was also measured using the internal current monitor. 25 to 30 independent breakdown measurements were performed for each concentration.
3.3 Mechanical characterisation
For mechanical testing, dispersions were cast on glass slides with dimensions 75 × 25 mm, from which samples with dimensions 30 × 10 × 0.1 mm were cut. The tensile tests were performed at room temperature and a constant deformation rate of 50 mm min−1 using a Zwick Z005 (Zwick GmbH & Co KG, Germany) tensile testing machine equipped with a 10 N load cell. Young's modulus Y was determined from the slope in the linear elastic region (below 5% strain), while the modulus at 100% strain M100% was determined as the slope of the true stress-strain curve at 100% strain.3.4 Electromechanical characterisation
The electromechanical response was tested in a planar actuator configuration. Samples were cast with a higher concentration solution of 300 g L−1, to achieve thicker films. Rectangular strips with dimension of 80 × 30 mm and a thickness of 400 μm were glued to supporting hard plastic frames and the surfaces were brushed with carbon based conducting grease. Thin aluminium strips were glued to the hard frames for electrical connection. Actuation performance was tested on Zwick Z005 using a force-feedback program in a measurement software environment (testXpert II), allowing for isotonic measurements. A load was chosen for each sample which corresponded to 100% prestrain. A high voltage amplifier (PD05031, Trek Inc., USA) was used to apply a voltage ramp at a rate of 50 V s−1 until breakdown.4 Results and discussions
The results from the complete electromechanical characterization are presented in the following and the various figures of merit and improvement ratios are calculated and discussed in detail.4.1 Dielectric characterization
Frequency dependent dielectric spectra (relative permittivity (left) and dielectric loss (right)) are shown in Fig. 3, of both pure SEBS elastomer and of the composites. The open symbols correspond to composites with uncoated particles (10 and 25%vol), the full symbols to coated particles (10, 15, 20, 25, 30%vol). The permittivity curves for 10%vol samples with and without coating are indistinguishable, except for a slight discrepancy at the higher frequency range. In contrast, the permittivity curves for 25%vol samples with and without coating differ strongly. The dielectric loss spectra show that all samples have basically the same loss levels, with the exception of the pure elastomer and the 25%vol uncoated particle sample. The 10%vol again has similar loss spectra to the other samples, also with irregularities in the upper frequency range.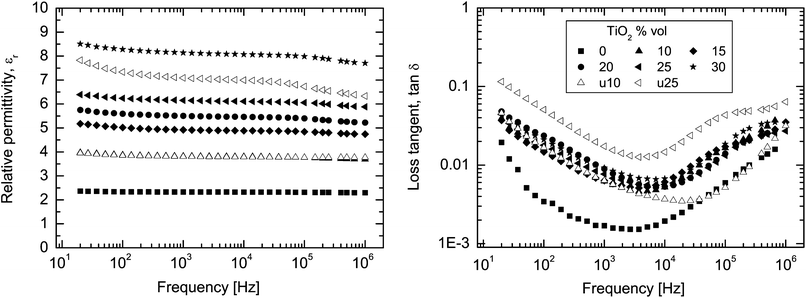 | ||
| Fig. 3 Relative permittivity (εr), and dielectric loss (tan δ) as a function of frequency measured at room temperature, for varying TiO2 volume fractions. Unfilled symbols correspond to uncoated particles, filled symbols to coated. Note: the curve for 10%vol uncoated particles largely covers the curve for coated particles. | ||
Evaluating only the coated particle spectra, it is found that the permittivity continuously increases with volume fraction. For instance, for the composite with 30%vol, the permittivity at 100 Hz reaches a value of 8.3, which is a large increase of 3.7 times over that of the pure elastomer matrix.
Interestingly, the spectra for coated particles are ‘flat’ (frequency independent), indicating no loss mechanisms in the entire observed frequency range. Otherwise, a frequency dependent variation in the relative permittivity, especially at low frequency, is commonly observed in the literature for such metal oxide-polymer heterogeneous materials,27,28 commonly ascribed to interfacial polarisation (Maxwell-Wagner polarisation). A ‘flat’ spectrum behavior indicates that there is no flow of current caused by accumulation of charge at the polymer/filler interface, an example of improved host–guest interaction, which can be ascribed to the surface coating as explained in the following.
The commercially available TiO2 particles are coated with PDMS oil (see Fig. 4) to improve the dispersability and water repellence. The non-polar methyl (–CH3) end groups of the PDMS are more compatible with the non-polar SEBS matrix than the polar TiO2, thus improving the affinity between their surfaces (Fig. 4) and hence leading to a more homogeneous random distribution (within the EB block), as can be seen directly in Fig. 2.
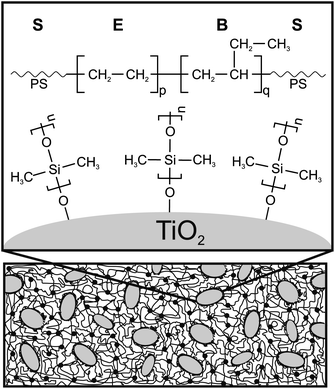 | ||
| Fig. 4 Schematic representation of the composite structure and chemical properties of the particle surface. | ||
We argue that the thin PDMS layer around the particles acts as an intermediate bound layer which graduates the dielectric contrast between the matrix and the particle, thereby preventing the Maxwell-Wagner process of localised polarization. The approach of altering the interfacial interaction between filler and host polymer by chemical modification of the filler particles was proposed previously as being of importance for achieving high permittivity composites with low dielectric losses and high breakdown strengths.45
As stated, the spectra for 10%vol coated and uncoated are identical, and those of 25%vol are significantly different, which we ascribe to percolation effects, as follows: The contrast between the uncoated particle and the matrix gives rise to a Gouy-Chapman-Stern interfacial layer28,46 with enhanced conductivity. The enhanced conductivity can permit macroscopic charge migration, which for composites above the percolation threshold (approximately 15%vol for spherical particles)47 can occur on a macroscopic scale leading to increases in permittivity and losses.46 Below the percolation threshold the charge migration is localised around particles and has negligible effect on the dielectric properties.
The measured relative permittivity of the SEBS-TiO2 composites with coated particles at 100 Hz was compared with theoretical predictions by the Bruggeman, Lichtenecker and Yamada models. The results of the comparison are shown in Fig.5 (the experimental values are listed in Table 1). The Yamada models are displayed for n = 3 (spherical particles) and n = 6.5 (a best fit, corresponding to prolate shaped particles with an elliptical semi-axes ratio η = 2.1, as might be justified from the SEM image, Fig. 1). The Bruggeman model lies somewhat below the experimental values, although it was found previously to describe polymer-metal oxide systems well.26,27,40 The discrepancy here might derive from the Bruggeman model's assumption of spherical particles individually dispersed in the composite38 (as is also the case for the Yamada model41). A good prediction is obtained from the logarithmic mixing rule suggested by Lichtenecker. Since this widely applicable mixing model assumes only chaotic statistical distribution of the particles, the good agreement between this model and the data indicate random distribution of particles, homogeneously throughout the entire sample volume.
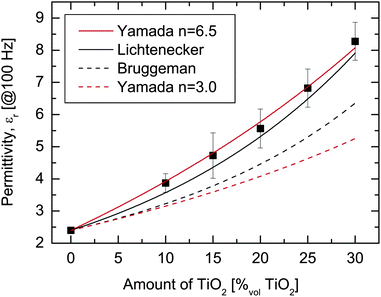 | ||
| Fig. 5 The values of the composite permittivity @100 Hz, for varying amounts of TiO2, compared with the indicated dielectric mixing rules (curves). | ||
| TiO2 | εr | Y | M 100% | E br,actuation | R β,calc | R β,calc | β meas,100% | R β,meas | f MS100,calc | f MS100,meas |
|---|---|---|---|---|---|---|---|---|---|---|
| %vol | @ 100 Hz | [kPa] | [kPa] | [V μm−1] | @ 0% | @ 100% | nm2V−2 | @ 100% | % | % |
| 0 | 2.3 | 160 | 120 | 37.3 | 1 | 1 | 76 | 1 | 11.9 | 12.6 |
| 10 | 4.0 | 340 | 160 | 33.9 | 0.82 | 1.30 | 102 | 1.34 | 12.4 | 12.6 |
| 15 | 4.8 | 430 | 170 | 27.3 | 0.77 | 1.47 | 132 | 1.74 | 10.6 | 12.3 |
| 20 | 5.8 | 620 | 230 | 26.0 | 0.65 | 1.32 | 105 | 1.38 | 7.7 | 8.3 |
| 30 | 8.5 | 1330 | 501 | — | 0.44 | 0.88 | — | — | — | — |
4.2 Mechanical characterisation
In general, the addition of ceramic particles to a polymer matrix is expected to cause a gradual increase in stiffness with increasing amount of filler. In Fig. 6, the average engineering stress-strain curves are shown for composites with PDMS coated TiO2. All materials showed typical hyperelastic behavior, with linear elastic behavior in the region of small strains, followed by a plateau region with low slope and finally a strain-hardening region. The changes in elastic moduli (Y and M100%) are shown in the inset of Fig.6 (the values are reported in Table 1). As expected, it is found that both elastic moduli increase with filler volume fraction. The Young's modulus of the pure SEBS film was 160 kPa, which rose to 620 and 1330 kPa for 20 and 30%vol composites, respectively, an increase of 5.3 and 8.3 times over the pure elastomer matrix. The increases in M100% were less severe. Although increases in mechanical stiffness are undesired for dielectric elastomer materials, it was found that enhanced actuation is possible in this system as discussed later. The improved compatibility of the coated TiO2 particles over the uncoated ones can be seen in the mechanical properties of the 10%vol composites where the Young's modulus of the composite with uncoated TiO2 (790 kPa)28 is over twice that of the one with coated TiO2 (340 kPa), demonstrating the importance of the surface interactions.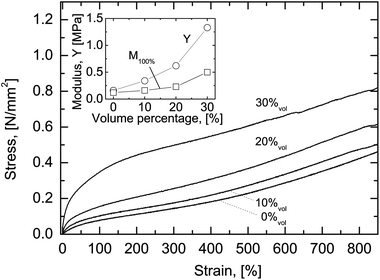 | ||
| Fig. 6 Engineering stress-strain curves for the pure elastomer SEBS and composites with different amounts of coated TiO2. Inset: Values of Young's modulus and elastic modulus measured at 100% strain. | ||
The degree of reinforcement here depends more strongly on the interaction of the matrix with the fillers than on particle distribution. It has been observed that the presence of nanoparticles can lead to restricted motion,48,49 and/or local crystallisation of the elastomer around the filler surface50 leading to a strong interaction with the polymer network and hence these interactions would lead to a stiffer material. The silicone oil surface coating would present a much more undefined and compatible surface to the elastomer (shown schematically in Fig. 4), suppressing the interaction and leading to a more moderate reinforcement.
4.3. Electrical breakdown strength
The results of the electrical breakdown tests performed on SEBS and the 10, 20, 30%vol nanocomposites are shown in Fig. 7 (full square symbols). Also shown is the FOM for energy density at breakdown fED, with εr at 100 Hz (open square symbols). An initial drop of 11% in electrical breakdown strength is observed, followed by an increase over that of the polymer matrix for higher volume fractions, such that at 30%vol, the breakdown strength is measured to be 54.8 V μm−1, an increase over that of the polymer matrix of 24%. The electrostatic energy density at breakdown FOM shows a strong increase with volume fraction, increasing by 5.6 times for 30%vol. Even for the 10%vol nanocomposite, which saw a reduction in electrical breakdown strength compared to the pure matrix, an improvement in this FOM is observed, which is due to the faster enhancement of dielectric permittivity.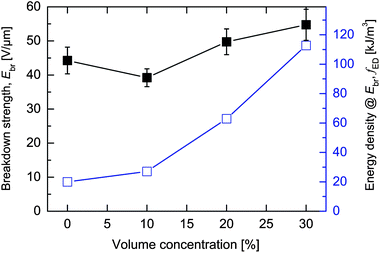 | ||
| Fig. 7 Electrical breakdown strength Ebr (full squares) and calculated electrostatic energy density at breakdown (open squares) for different TiO2 amounts. | ||
The slight reduction in electrical breakdown strength seen at the low filling level of 10%vol is not unusual. In fact, Ma et al.51 reported that with the incorporation of 5 wt% TiO2 into low density polyethylene (LDPE), the breakdown strength decreases remarkably by 40%. Khalil et al.52 showed that addition of 1 wt% BaTiO3 to the LDPE, decreases the breakdown strength by 16%. It was suggested that this was caused by filler particles acting as electrical defect centers that distort and enhance the local field,52,53 which was also the conclusion based on simulations.54
The electrical current was monitored during the breakdown test (see Fig. 8). The pure elastomer SEBS shows a flat current-electric field curve until failure, while for all composites, the current is found to increase during the breakdown experiment, but with different current characteristics. For the pure elastomer, it is possible that the current was too low for the equipment to measure accurately.
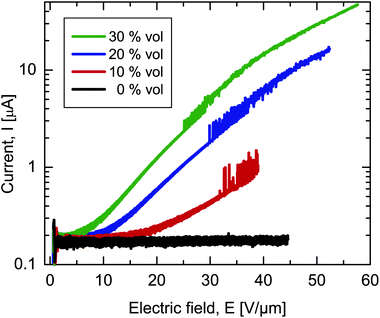 | ||
| Fig. 8 Electric current vs. electric field for varying volume concentrations (the current spike at electrical failure has been removed for clarity). | ||
The strong nonlinear electrical behaviour appears linear in the log-linear representation chosen here, an indication of varistor type behaviour, as is found in ceramic ZnO-based voltage surge protection devices.55,56 Similar behaviour was observed in metal oxide/polymer composites.56–58
A small increase in electric breakdown strength for higher volume ratios of TiO2 is observed, which might be related to electromechanical instability (EMI).44,59EMI occurs when the balance between electrical stress and internal elastic stress becomes unstable, leading to pull-in-type failure. Kollosche and Kofod44 developed a model describing electromechanical instability of soft elastomers in a standard breakdown experiment configuration. The model includes the effects of electrostatic pressure, load, hemi-spherical boundary conditions, and the Neo-Hookean constitutive model (well-suited for elastomers with strains up to 30%). The electrical breakdown field Ebr due to electro-mechanical instability can be calculated by solving simultaneously eqn(4) and (5) in Ref. 44.
Here, the electrical breakdown field Ebr predicted by the model was calculated based on the measured values, the results of which are listed in Table 2. It is found that the model predicts accurately the electrical breakdown strength for the pure elastomer, while the predictions for the composites are around 25% higher than measured. The earlier breakdown could be due to the increase in electrical Joule heating from the leakage current (see Fig. 8), which heats up the composite, in turn leading to softening and an earlier onset of EMI.
| %vol | E br, calculated | E br, measured |
|---|---|---|
| 0 | 46 | 44 |
| 10 | 54 | 39 |
| 20 | 61 | 50 |
| 30 | 74 | 55 |
4.4 Electromechanical coupling and actuation response
Planar actuators were made from pure elastomer and from the composites with 10, 15, 20 and 25%vol of coated TiO2 nanoparticles. Actuators with 30%vol coated nanoparticles could not be measured reliably. The actuation strain curves at 100% prestrain are shown in Fig. 9, together with the curves calculated from eqn (5), showing very good correspondence. It is found that the actuation strain, compared to that of the pure polymer, is improved for 10, 15, and 20%vol composites. A maximum improvement was observed for the 15%vol composite, with a corresponding reduction in activation fields of 27%. As can also be seen, the maximum achievable actuation strain is about 12% for the pure matrix elastomer, as is also found for 10 and 15%vol composites, above which a deterioration is observed. A comparison of the measured electrical breakdown strengths reported in Table 2 with the ultimate values observed for actuators in Fig. 9 shows that the values are very similar for low amounts of nanoparticles, while for higher amounts the actuators breakdown at lower values. This is most likely due to issues with processing, where the current procedure of removing the drop-cast film from the substrate could introduce defects in composites with higher particle amounts.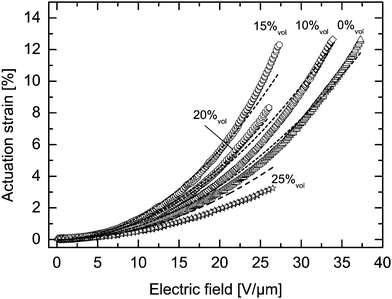 | ||
| Fig. 9 Electric-field induced strain response for the pure elastomer SEBS and TiO2 nanocomposites with different volume fractions of TiO2. | ||
The measured values have been compiled in Table 1, from which various figures of merit and improvement ratios have been calculated. Shown in the Table is the observed electrical breakdown strength obtained from the actuation measurements, Ebr,actuation. Then follows Rβ,calc, calculated using eqn (7), at 0% and again at 100% prestrain. Then follows one column with values of βmeas,100%, found by fitting eqn (3) (SA = βE2) to the initial part of the curves in Fig. 9. These values were then used to calculate measured improvement ratios Rβ,meas, listed in the subsequent column. Finally, the maximum actuation strains at 100% prestrain were calculated using eqn (5) to obtain fMS100,calc, and measured directly from Fig. 9 to obtain fMS100,meas.
The improvement ratios, Rβ,calc, at 0% prestrain are found to be less than 1 for all filler amounts, leading to the conclusion that these materials will have lower actuation strain at this prestrain compared to the pure elastomer. On the other hand, the improvement ratios at 100% prestrain predict strong improvements in sensitivity β of up to 47% at 15%vol, and dropping for higher amounts. Comparing with the measured improvement ratios, Rβ,meas, a good correspondence is found between the calculated and measured values for all amounts. Finally, the maximum actuation strains, fMS100 are found to be in fairly good agreement.
5 Conclusion
A simple mixing rule approach for increasing the relative permittivity of a polymer was investigated with respect to the improvement of the actuation properties of a soft dielectric elastomer. A physically crosslinked, tri-block copolymer was chosen as the matrix, to specifically avoid effects on the polymer networking on addition of filler particles, which allowed for a direct investigation of the influence of the nanoparticles on the electro-mechanical properties. It was shown that addition of stiff, high permittivity insulating particles increases both the permittivity and the mechanical stiffness of the resulting composite, however, with direct control of the host–guest interactions of the matrix and filler via surface modification, it is possible to control electrical and mechanical properties, so that the enhancement of sensitivity of actuation is achievable. Dielectric spectroscopy revealed a strong influence of the surface on the dielectric properties at higher volume fractions, indicating improved host–guest interaction, which was also confirmed by the mechanical characterisation. The Young's modulus of the composite with uncoated TiO2 was found to be over twice that of the one with coated TiO2, demonstrating clearly the importance of the surface interactions. Improvements in electromechanical performance were observed up to 20%vol, reaching maximum actuation sensitivity for a composite with 15%vol, which caused a 27% reduction of the driving electric field.In summary, the use of physically crosslinked elastomers, which maintain their intrinsic properties when filler is added, directly demonstrates for the first time that the enhanced dielectric properties due to the addition of nanoparticles results in significantly improved actuation sensitivity in DEA.
Acknowledgements
This work was supported by the BMBF through its WING program with a NanoFutur grant (Grant No. 03X5511). The authors thank the EU Commission for equipment financial support. We thank VTC Elastoteknik for providing SEBS500040 material. We are indebted to Hülya Ragusch and Werner Wirges for technical support and the whole ACMP group for valuable discussions.References
- Electroactive Polymer (EAP) Actuators as Artificial Muscles: Reality, Potential, and Challenges, ed. Y. Bar-Cohen, SPIE, Bellingham, WA, 2004 Search PubMed.
- R. Shankar, T. K. Ghosh and R. J. Spontak, Soft Matter, 2007, 3, 1116–1129 RSC.
- Intelligent Materials, ed. M. Shahinpoor and H. Schneider, Royal Society of Chemistry, Cambridge, 2008 Search PubMed.
- Dielectric Elastomers as Electromechanical Transducers. Fundamentals, Materials, Devices, Models & Applications of an Emerging Electroactive Polymer Technology, ed. F. Carpi, D. De Rossi, R. Kornbluh, R. Pelrine and P. Sommer-Larsen, Elsevier, Amsterdam, 2008 Search PubMed.
- T. Mirfakhrai, J. Madden and R. Baughman, Mater. Today, 2007, 10, 30–38 CrossRef.
- H. M. Herr and R. D. Kornbluh, Proc. SPIE, 2004, 5385, 1–9.
- J. D. W. Madden, N. A. Vandesteeg, P. A. Anquetil, P. G. A. Madden, A. Takshi, R. Z. Pytel, S. R. Lafontaine, P. A. Wieringa and I. W. Hunter, IEEE J. Oceanic Eng., 2004, 29, 706–728 CrossRef.
- Q. Pei, R. Pelrine, S. Stanford, R. Kornbluh and M. Rosenthal, Synth. Met., 2003, 135–136, 129–131 CrossRef CAS.
- R. Pelrine, P. Sommer-Larsen, R. Kornbluh, R. Heydt, G. Kofod, Q. Pei and P. Gravesen, Proc. SPIE, 2001, 4329, 335–349 CAS.
- H. R. Choi, S. W. Lee, K. M. Jung, J. C. Koo, S. I. Lee, H. G. Choi, J. W. Jeon and J. D. Nam, Proc. SPIE, 2004, 5385, 368–379.
- I. M. Koo, K. Jung, J. C. Koo, J. Nam, Y. K. Lee and H. R. Choi, IEEE Trans. Rob., 2008, 24, 549–558 Search PubMed.
- G. Kofod, W. Wirges, M. Paajanen and S. Bauer, Appl. Phys. Lett., 2007, 90, 081916 CrossRef.
- F. Carpi and D. De Rossi, IEEE Trans. Inf. Technol. Biomed., 2005, 9, 295–318 CrossRef.
- R. Pelrine, R. Kornbluh, J. Eckerle, P. Jeuck, S. Oh, Q. Pei and S. Stanford, Proc. SPIE, 2001, 4329, 148–156 CAS.
- R. Pelrine, R. Kornbluh, Q. Pei and J. Joseph, Science, 2000, 287, 836–839 CrossRef CAS.
- R. Pelrine, R. Kornbluh and J. Joseph, Sens. Actuators, A, 1998, 64, 77–85 CrossRef.
- G. Kofod and P. Sommer-Larsen, Sens. Actuators, A, 2005, 122, 273–283 CrossRef.
- Q. M. Zhang, H. Li, M. Poh, F. Xia, Z.-Y. Cheng, H. Xu and C. Huang, Nature, 2002, 419, 284–287 CrossRef CAS.
- C. Huang and Q. Zhang, Adv. Mater., 2005, 17, 1153–1158 CrossRef CAS.
- F. Carpi, G. Gallone, F. Galantini and D. DeRossi, Adv. Funct. Mater., 2008, 18, 235–241 CrossRef CAS.
- H. Stoyanov, M. Kollosche, D. N. McCarthy and G. Kofod, J. Mater. Chem., 2010, 20, 7558–7564 RSC.
- D. M. Opris, F. Nuesch, F. Lowe, M. Molberg and M. Nagel, Chem. Mater., 2008, 20, 6889–6896 CrossRef CAS.
- H. Stoyanov, D. Mc Carthy, M. Kollosche and G. Kofod, Appl. Phys. Lett., 2009, 94, 232905 CrossRef.
- P. Barber, S. Balasubramanian, Y. Anguchamy, S. Gong, A. Wibowo, H. Gao, H. Ploehn and H. Loye, Materials, 2009, 2, 1697–1733 Search PubMed.
- N. Guo, S. A. DiBenedetto, P. Tewari, M. T. Lanagan, M. A. Ratner and T. J. Marks, Chem. Mater., 2010, 22, 1567–1578 CrossRef CAS.
- F. Carpi and D. De Rossi, IEEE Trans. Dielectr. Electr. Insul., 2005, 12, 835 CrossRef CAS.
- G. Gallone, F. Carpi, D. De Rossi, G. Levita and A. Marchetti, Mater. Sci. Eng., C, 2007, 27, 110 CrossRef CAS.
- D. N. Mc Carthy, S. Risse, P. Katekomol and G. Kofod, J. Phys. D: Appl. Phys., 2009, 42, 145406 CrossRef.
- H. C. Nguyen, V. T. Doan, J. Park, J. C. Koo, Y. Lee, J. Nam and H. R. Choi, Smart Mater. Struct., 2009, 18, 015006 CrossRef.
- P. Lotz, M. Matysek, K. Flittner and H. F. Schlaak, Proc. 11th International Conference on New Actuators, 2008, 868 Search PubMed.
- P. Sommer-Larsen, J. Hooker, G. Kofod, M. West, K. Benslimane and P. Gravesen, Proc. SPIE, 2001, 4329, 157–163 CAS.
- F. Carpi, P. Chiarelli, A. Mazzoldi and D. De Rossi, Sens. Actuators, A, 2003, 107, 85–95 CrossRef.
- G. Kofod, D. N. McCarthy, H. Stoyanov, M. Kollosche, S. Risse, H. Ragusch, D. Rychkov, M. Dansachmüller and R. Waché, Proc. SPIE–Int. Soc. Opt. Eng., 2010, 76420J.
- K. Lichtenecker and K. Rother, Phys. Z., 1931, 32, 255 Search PubMed.
- L. Jylhä and A. Sihvola, J. Phys. D: Appl. Phys., 2007, 40, 4966–4973 CrossRef CAS.
- T. Starke, C. Johnston, S. Hill, P. Dobson and P. Grant, J. Phys. D: Appl. Phys., 2006, 39, 1305–1311 CrossRef CAS.
- J. Calame, J. Appl. Phys., 2006, 99, 084101 CrossRef.
- D. A. Bruggeman, Ann. Phys., 1935, 24, 636–664 CAS.
- M. T. Clarkson, Phys. Rev. A: At., Mol., Opt. Phys., 1988, 37, 2079–2090 CrossRef CAS.
- K. S. Lam, Y. W. Wong, L. S. Tai, Y. M. Poon and F. G. Shin, J. Appl. Phys., 2004, 96, 3896–3899 CrossRef CAS.
- T. Yamada, T. Ueda and T. Kitayama, J. Appl. Phys., 1982, 53, 4328–4333 CrossRef CAS.
- J. Laurer, R. Bukovnik and R. Spontak, Macromolecules, 1996, 29, 5760–5762 CrossRef.
- R. Parker, Phys. Rev., 1961, 124, 1719–1722 CrossRef CAS.
- M. Kollosche and G. Kofod, Appl. Phys. Lett., 2010, 96, 071904 CrossRef.
- P. Kim, S. Jones, P. Hotchkiss, J. Haddock, B. Kippelen, S. Marder and J. Perry, Adv. Mater., 2007, 19, 1001–1005 CrossRef CAS.
- J. K. Nelson and J. C. Fothergill, Nanotechnology, 2004, 15, 586–595 CrossRef CAS.
- H. Scher and R. Zallen, J. Chem. Phys., 1970, 53, 3759–3761 CAS.
- T. Desai, P. Keblinski and K.S.K., J. Chem. Phys., 2005, 122, 134910 CrossRef.
- K. E. Atkinson and C. Jones, J. Adhes., 1996, 56, 247–260 CrossRef CAS.
- Z. Xiao, Y. Li, D. Ma, L. S. Schadler and Y. A. Akpalu, J. Polym. Sci., Part B: Polym. Phys., 2006, 44, 1084–1095 CrossRef CAS.
- D. Ma, T. Hugener, R. Siegel, A. Christerson, E. Martensson, C. Onneby and L. Schadler, Nanotechnology, 2005, 16, 724–731 CrossRef CAS.
- M. Khalil, IEEE Trans. Dielectr. Electr. Insul., 2000, 7, 261 CrossRef CAS.
- G. Chen and A. Davies, IEEE Trans. Dielectr. Electr. Insul., 2000, 7, 401 CrossRef CAS.
- J. Y. Li, L. Zhang and S. Ducharme, Appl. Phys. Lett., 2007, 90, 132901 CrossRef.
- E. Martensson, U. Gafvert and U. Lindefelt, J. Appl. Phys., 2001, 90, 2862–2869 CrossRef CAS.
- F. Greuter, M. Siegrist, P. Kluge-Weiss, R. Kessler, L. Donzel, R. Loitzl and H. Gramespacher, J. Electroceram., 2004, 13, 739–744 CrossRef CAS.
- J. Li, M. Alim, S. Luo, W. Yao, Z. Tang and Z. Zang, J. Electroceram., 2004, 13, 751–757 CrossRef CAS.
- F. Greuter, Y. Dirix, P. Kluge-weiss, R. Kessler and W. Schmidt, EP1274102, 2003.
- X. Zhao and Z. Suo, Appl. Phys. Lett., 2009, 95, 031904 CrossRef.
| This journal is © The Royal Society of Chemistry 2011 |
