Cassie–Wenzel and Wenzel–Cassie transitions on immersed superhydrophobic surfaces under hydrostatic pressure†
Pontus
Forsberg
*,
Fredrik
Nikolajeff
and
Mikael
Karlsson
Dept. of Engineering Sciences, Uppsala University, Box 534, SE-751 21, Uppsala, Sweden. E-mail: pontus.forsberg@angstrom.uu.se
First published on 20th September 2010
Abstract
For incorporating superhydrophobic surfaces in microfluidic systems, it is important to understand the ability of the superhydrophobic state to withstand hydraulic pressure. In this paper we describe experiments to probe the collapse transition on superhydrophobic surfaces completely covered by water, where the air film formed on the surface is closed. Polyethylene foils nanoimprinted with micrometre sized pillars in different geometries and densities are used as the model superhydrophobic surfaces. The pressure required for the transition from Cassie to Wenzel state is measured for all surfaces and also compared to analytical and numerical models. We find that the closed film of trapped air helps stabilise the Cassie state at low pillar densities and that the effect of a small change in pillar sidewall angle can drastically change the collapse behaviour. Finally, the reverse transition, from Wenzel to Cassie state, is observed on densely pillared surfaces at low water pressure.
Introduction
Water in contact with a rough surface can be in one of two states. It can either completely wet the surface, with the water penetrating into the roughness, or the wetting can be incomplete, with gas pockets between the raised roughness features. The first state is usually called the Wenzel state and if the gas trapping is significant the second is often called the Cassie or fakir state. This second state can give rise to a phenomenon known as superhydrophobicity, sometimes called the lotus effect, where droplets of water easily roll off the surface (for a brief introduction to superhydrophobicity see for example Quéré1 or, for an historical overview, Gao et al.2). Which of these states occurs in any particular situation depends on the surface properties, morphology and surface chemistry, and the history of the system. If the liquid is placed gently on the surface it is more likely to trap air than in a more violent process such as a drop impacting the surface. Hydraulic pressure and vibrations can also cause a transition from the Wenzel to the Cassie state. There exist several theoretical3–7 and experimental studies on this wetting transition. Various ways to induce the collapse of the air layer have been used. These include squeezing a droplet between two surfaces,8 droplets impacting a surface,9,10 variation of droplet size11–13 and vibrating the surface.13 The experimental studies have in common that they study the interaction of a droplet and a surface. This is natural since the study of superhydrophobic surfaces has long been geared towards creating stable water-repellent and self-cleaning surfaces. Lately, however, there has also been significant interest in the behaviour of superhydrophobic surfaces fully immersed in liquid. In microfluidic systems the apparent slip condition observed in the flow past an air trapping surface15–19 could drastically reduce the pressure required to push a liquid through tiny capillaries. The reduced contact with a solid wall should also help reduce adsorption problems and/or fouling. Other microfluidic devices based on the superhydrophobic effect include a valve based on the transition from the Cassie to the Wenzel state.20 While the basic mechanics of the transition might not be very different between the cases of a droplet sitting free on the surface (open case) and a liquid layer completely covering it (closed case), there are some clear differences. For one, there is no macroscopic wetting line in the closed case. This is important because recent studies have indicated that the size and edges of a droplet may play a significant role for stability.7,11,14 This would make the closed case the simpler one. On the other hand, in the closed case the trapped air is enclosed under the liquid and so the air pressure cannot simply be assumed to be the same as the ambient one. While there are several suggested models for the collapse transition, there is widespread agreement that smaller and more densely packed structures lead to better stability. High aspect ratio and roughness on several scales (tiered roughness) also appear to help. Many of the superhydrophobic surfaces in the literature therefore have roughness on the submicron scale down to the nanoscale.21 On such surfaces both very good liquid repellent characteristics and stability can be obtained. However, to design for maximum slip over a superhydrophobic surface, a large separation between structures is required.15,16,18,22,23 Thus there appears to be a conflict between the two design criteria: high stability and large slip. In order to optimise surfaces for specific applications a good understanding of both is required. Here we investigate how the air films trapped in a range of pillared superhydrophobic surfaces fully immersed in water react as the pressure in the water covering them is raised and lowered.Theory
As the pressure difference over the water–air interface increases the interface will start curving down into the space between the pillars. Eventually there comes a point at which the superhydrophobic state collapses and water penetrates to the bottom of the structures. One way in which this could happen is that the interface is pushed far enough to touch the bottom between pillars without wetting the pillar sidewalls. Considering the curvature of the interface required this is unlikely unless the aspect ratio is very low and such surfaces rarely exhibit superhydrophobicity at all. Another collapse mechanism, more likely in the case of tall pillars, is that the advancing contact angle, θa, is reached on the sides of the pillars, allowing the contact line to depin from the pillar tops and advance down along the sidewalls.As the interface curves down into the trapped air, the air volume will be reduced and the pressure increased, slowing the increase in the pressure difference over the water–air interface and likely increasing the water pressure at which the air film collapses, particularly for low aspect ratio structures. One might also consider a case where the contact line advances part way down the pillars, thereby increasing the air pressure, which would slow down the advance. In the case with vertical sidewalls, this would require the contact line to depin from the pillar tops over the whole surface at once, an unlikely occurrence on any real surface. More likely is that the air film collapses at a point with some small defect in the pattern. This in turn displaces air, increasing the air pressure and stabilising the remaining air film, so the fully wetted area grows slowly with increasing pressure.
On a surface with slightly inclined or stepped sidewalls the curvature, and thus the pressure difference, required to advance the contact line on the pillar sides increases as the gap between the pillars becomes smaller closer to the base. On such surfaces one might well see the wetting halted before reaching the bottom of the structures.
The simplest way to estimate the transition pressure is to balance forces due to pressure and surface tension.3,4 The vertical force due to pressure on the free hanging air–water interface is the pressure difference between water and air, ΔP, multiplied by the horizontal projection area of the interface, Ai. Balancing this against the vertical component of the surface tension, γ, along the wetting line at the pillar tops with contact angle θ = θa gives
 | (1) |
This simple model does not take into account the increasing air pressure as the meniscus curvature increases. The volume of the meniscus penetrating beneath the pillar tops is not easily estimated analytically. It involves finding the surface of constant curvature which gives rise to θa at the pillar tops. To do this we implemented an algorithm for calculating constant mean curvature surfaces between pillars, as described by Lobaton and Salamon4 (see in particular their supplementary material). We iterated this algorithm to find the curvature and air volume change associated with a particular contact angle on a given surface. As noted by Lobaton and Salamon, θ was almost constant around the circumference of a circular pillar top. For these structures the collapse was assumed to occur when this angle reached θa. On square pillars θa was reached first close to the corners. On these, the contact line was allowed to move down along the side of the pillar once θa was reached. Collapse was assumed to occur at the curvature when the contact angle reached θa along the whole contact line. That is, when the last point on the contact line let go of the pillar top. A linear dependence between volume and pressure was assumed to calculate collapse pressures.
Experimental
Pillared surfaces were produced in 0.2 mm thick polyethylene (PE) film by thermal nanoimprinting. A thin nickel shim (master) with “negative” pillar structures was first produced by standard UV-lithographic and electroplating techniques. Thin films of chromium and gold were sputtered onto the nickel master. The master was then treated with 1-octadecanethiol (Aldrich) in isopropanol to reduce stretching and breaking of the PE structures upon separation after imprinting. To produce samples with a more hydrophobic surface chemistry, some PE samples were coated with a thin (∼30 nm) film of fluoropolymer in a C4F8/Ar plasma.Small pressure chambers were constructed by curing a 4 mm thick layer of polydimethylsiloxane (PDMS) over a length of silicone tubing with an inner diameter of 1 mm. A 12 mm diameter circular hole was cut through the PDMS across the tubing. To complete the chamber, glass slides were bonded to each side of the PDMS with the PE sample inside. To prevent the sample from moving around in the chamber, it was cut into a circle slightly larger than the chamber and clamped against one glass slide by the PDMS with the structured side facing into the chamber. The resulting device is a small transparent chamber with the structured sample fixed inside and the inlet and outlet formed by the silicone tubing.
The samples prepared each held 30 differently structured 940 × 940 µm squares in a 5 × 6 array. Ten densities of pillars for each of three geometries were used: square pillars in a square array (SS), circular pillars in a square array (CS) and circular pillars in a hexagonal array (CH) (Fig. 1e). The various patterns were placed randomly in the array to avoid potential systematic errors due to the placement relative to the chamber walls and inlet and outlet. Further details about the preparation of samples and chambers can be found in the ESI†.
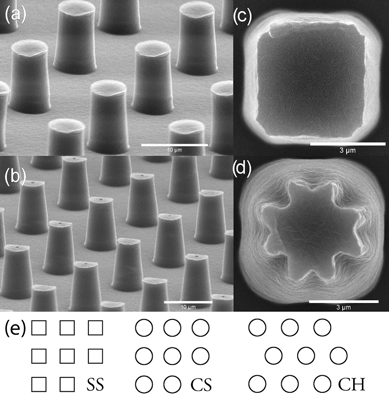 | ||
| Fig. 1 SEM micrographs of pillared surfaces. (a) Round pillars with steep sidewalls. (b) Round pillars with more angled sidewalls. (c) Square pillar. (d) Shape of the “square” pillars when mask contact was not tight in the UV lithography. In (a and b) the sample is tilted 70°. Scale bars are 10 µm in (a and b), 3 µm in (c and d). (e) Schematic top views of the three geometries. | ||
The shape and dimensions of the produced pillared surfaces were studied by scanning electron microscopy (SEM) (Fig. 1a to d) and white light interferometry. Pillar height was 9.5 ± 0.4 µm on all surfaces. Structures produced with tight contact between mask and photoresist in the UV-lithography had lateral dimensions very close to the mask. The bottom diameter of the round pillars was 5.85 ± 0.10 µm and the top 5.11 ± 0.15 µm giving an average sidewall angle of 2.2° from the vertical. The square pillars had slightly flattened corners. By allowing a small gap between mask and photoresist in the UV-lithography, pillars with more sloping sidewalls could be produced. These had a sidewall angle around 5.6° off the vertical, becoming somewhat steeper very close to the top. On these samples the tops of the square pillars were distorted, probably due to diffraction effects. For simplicity we will refer to the samples of the first kind as vertical and the second as sloped.
For the pressure measurement the chamber was placed horizontally under a stereomicroscope with a video camera and slowly filled with water from a syringe pump connected on one side. A pressure sensor (Motorola MPX 5100DP) was then connected on the other side. The pressure was slowly increased using the syringe pump while video and pressure were recorded. After the collapse transition had been observed on all of the different structures, the pressure was carefully released.
The advancing and receding contact angles were measured by sessile drop technique on unstructured PE and fluoropolymer coated samples which had gone through the whole process used to prepare the structured samples.
Results
The advancing and receding contact angles measured on flat PE were (103.5 ± 2.3)° and (82.1 ± 2.5)° respectively. On fluoropolymer coated surfaces they were (122.1 ± 3.6)° and (84.7 ± 5.5)°. The result of using advancing angles in the models for collapse pressure, with the pillar densities used in the experimental study, is shown in Fig. 2. Only the results for circular pillars in a square array are shown in Fig. 2, the other geometries give very similar results (the results for all geometries can be found in the ESI†). The simulated result agrees very well with the force balance calculation (PA) when compression of the air is not taken into account (simulated open), this is in agreement with the results of Lobaton and Salamon4 for convex pillars. If the effect of increased air pressure as the meniscus is pushed down into the air film is taken into account (simulated closed), the collapse pressure increases significantly at low pillar densities giving rise to a shallow minimum around 15–20% coverage.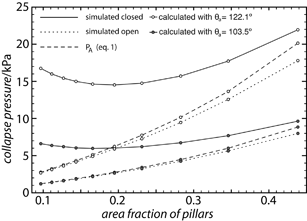 | ||
| Fig. 2 Results of theoretical models of collapse pressure on surfaces with 9.5 µm tall, 3 µm radius circular pillars in a square array. The two contact angles used in the calculations are the advancing contact angles measured on PE and fluoropolymer coated PE. | ||
Fig. 3a shows a snapshot from a typical measurement on one of the vertical samples. Initial collapse on these surfaces appeared in a small area with a shape characteristic of the geometry of pillar placement (square or hexagonal) familiar from droplets spreading on regularly structured hydrophilic surfaces.24 It spread to that area from a presumed initial collapse point within the time resolution of our video camera (40 ms). The initial area was usually larger on the more sparsely pillared surfaces than on the denser ones. The loss of the air layer reduced the reflectivity in the collapsed area. At the same time air was displaced into the remaining air film, changing the shape of the air–water interface and making these areas brighter. This is clearly seen in Fig. 3b where the first two pictures are from consecutive frames with the collapse occurring in between. The rest of Fig. 3b shows how the collapsed area slowly grows as the pressure increases. In contrast, on the sloped samples the collapse usually came in two steps, a partial collapse was seen to spread on the surface before the complete collapse. In Fig. 3c this first step can be seen starting in the upper left corner and spreading to the entire surface before a sudden complete collapse occurs over most of the surface. The spreading of the partial collapse did not typically follow the geometric pattern of the pillars, which made it easy to distinguish from a full collapse. The extent of the partial collapse at the time of full collapse varied greatly, from the full surface (as seen in Fig. 3c) down to just a small part. In the cases where only a small part of the surface collapsed, the collapsed area continued to grow, just like on the vertical samples, as the pressure increased. If the pressure was released before full collapse occurred, the partial collapse was reversible.
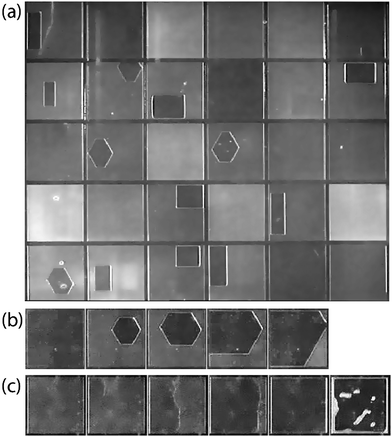 | ||
| Fig. 3 Snapshots from measurement. (a) shows a view of the whole sample area during a measurement on a plain PE sample. (b and c) show the typical progress of collapse on a sample with straighter and more sloped sidewalls respectively. | ||
As the water pressure was slowly lowered, the remaining portions of the air film would first change in brightness as the air–water interface changed shape. On the more sparsely pillared surfaces the air would form a bubble on top of the surface before the pressure had returned to the starting point. As the pressure was lowered further, bubbles also formed on the moderately dense surfaces. In some cases, however, air was seen to creep back and reform the air film. This transition from the Wenzel to the Cassie state was observed for the two highest pillar densities on vertical samples, both plain PE and fluoropolymer coated, but not sloped ones. A short movie showing this reversible collapse is included in the ESI†.
The pressure when the film first breaks down fully at any point is plotted in Fig. 4 against the surface fraction covered by pillars. The results from the theoretical calculations are included as gray lines for comparison. On vertical samples there is very little change in collapse pressure with increasing pillar density, particularly on the plain PE surfaces, up to around 20–25% coverage when the slope increases. Any difference between the three geometries studied is clearly within the uncertainty of the measurement. On sloped samples, both plain and fluorocarbon coated, the collapse pressure varied greatly between measurements. From much lower than on the vertical samples to over four times as high.
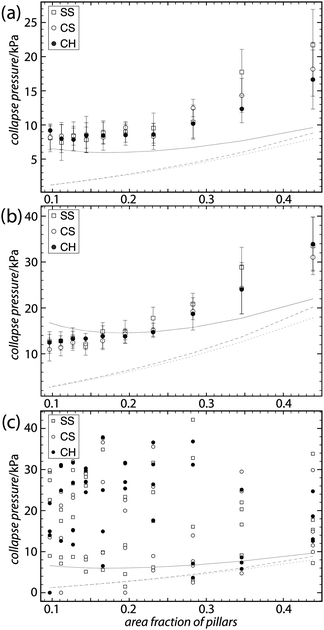 | ||
| Fig. 4 Collapse pressure plotted against the area fraction covered by pillars. The relevant results of the theoretical models from Fig. 2 are included as faint gray lines for comparison. (a and b) show the results on PE and fluoropolymer coated PE, respectively, error bars show standard deviation. (c) is a scatter plot of measurements on four PE samples with slightly more sloped sidewalls, all imprinted from the same master. Comparing (c) to (a) shows that the small difference in pillar sidewall angle gives rise to a big difference in collapse behavior. | ||
Discussion
While no minimum was seen in the collapse pressure, the results of the simulations of closed air films have their minimum close to where the measurements flatten out. The flattening out of the graph results in a large deviation of the measured collapse pressure from the model with a constant air pressure at low pillar densities. We consider this to be an effect of increased pressure in the trapped air film. This effect is potentially useful for producing stable superhydrophobic surfaces with a long slip length, which usually requires long distances between raised features.That no clear difference in collapse pressure could be seen between the three variations of pillar shape and placement geometry tested here is not surprising considering that the models predict only small differences between them. More surprising is the large effect of even a small change in pillar profile, demonstrated on the samples with only slightly more sloped pillar sidewalls. While the angled wall could help stabilize the surface against collapse, as discussed above in the Theory section, it also apparently left the surface so sensitive to small variations that any dependence in collapse pressure on pillar density was overshadowed.
The reverse wetting transition observed on samples with high pillar densities and vertical sidewalls could potentially be very useful. Though the pressure had to be lowered below the ambient pressure to achieve it, this is far quicker and easier than the procedure usually required to re-establish an air film after collapse, which includes emptying the system of water and blowing dry air or nitrogen through the system to dry it out. This kind of recovery of the Cassie state requires a higher pressure in the air film than in the water, so it would be unlikely to occur in the case of a droplet sitting on a surface with an open air film. The alternative to film recovery, as the pressure difference between air and water phases increases, is the formation of a bubble on top of the structure. To understand why the recovery only occurs on the more densely pillared samples we compare approximations for the pressure difference required for bubble formation and air film recovery, for simplicity we limit the analysis to square arrays of circular pillars. For bubble formation we use a similar approximation as for air film collapse. In order for a bubble to form, air has to displace the water on top of the pillars. This means that the angle we put into eqn (1) instead of θa should be 270° − θr if the receding contact angle, θr, is above 90°. If θr is below 90° as in our case, we may simply set the contact angle in eqn (1) to 180°, since the meniscus curvature required to reach θr beyond this point is increasing. We expect this approximation to be most accurate for circular pillars as we have seen in the simulations above that the contact angle around the rim of such pillars remains close to constant. To approximate the pressure required for film recovery, we note that the pressure required is lower between diagonally placed pillars (as in Fig. 5a) than between nearest neighbors. A film encroaching on an area from all sides always has such diagonals available, as opposed to one spreading from a point (hence the more irregular shapes formed during the film recovery compared to the neat rectangles seen during the collapse). For receding contact angles below 90°, the recovery can occur when the meniscus can just touch a fully wet pillar (pillar III in Fig. 5a) while remaining pinned on the partially dry pillars (I and II in Fig. 5a). If θr is above 90°, the behaviour at the bottom of the structure may lead to a lower recovery pressure. The curvature radius of the pinned meniscus is
 | (2) |
 | (3) |
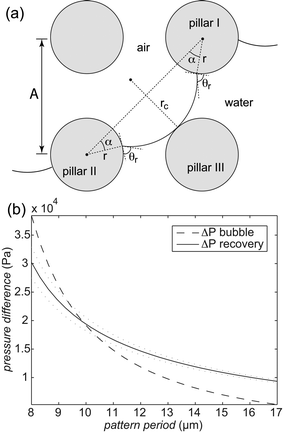 | ||
| Fig. 5 (a) A schematic describing the condition for air film recovery. A curvature rc of the air–water interface is required for the meniscus to reach pillar III. (b) The calculated overpressure in the air film compared to the water phase required for bubble formation (dashed line) and film recovery (solid line) on a surface with 3 µm radius circular pillars and a receding contact angle of 85°. The dotted lines were calculated using contact angles corresponding to the standard deviation limits on the receding contact angle measured on fluoropolymer coated PE. | ||
We can now insert our values for receding contact angle, pillar radius and pattern period and calculate the curvature radius numerically. Assuming that the pillars are tall compared to the spacing between them, which holds true at least for the more densely pillared samples, we neglect the vertical curvature and calculate the Laplace pressure. Fig. 5b shows the calculated pressures for bubble formation and air film recovery for a range of pattern periods corresponding to those used in the experimental study. For periods below approximately 10 µm the pressure required for recovery is lower than that for bubble formation. This is consistent with the experimental result where pattern periods of 8 and 9 µm gave rise to recovery while periods of 10 µm and above produced bubbles.
Conclusions and outlook
In this study we have showed that the collapse pressure on low aspect ratio immersed superhydrophobic structures is increased due to the compression of the air film trapped in the surface. We have also shown that lateral shape of the pillars plays a small role compared to the vertical profile. Finally, reversibility of the Cassie–Wenzel transition on immersed surfaces by lowering water pressure was demonstrated.It is worth noting that the fabrication of the superhydrophobic PE film presented in this article is based on mass production methods. The microstructured PE films can be useful in industrial applications (e.g. control wetting on curved geometries), especially since the surface is superhydrophobic without adding a coating to the surface.
In the future it would be interesting to perform a similar experiment with nailhead shaped pillars, which have been shown to improve superhydrophobic stability.25 It would also be interesting to test surfaces with two tiers of structures. While we have seen a rich variety of phenomena on the simple structures used in this study, an overlayered smaller structure would most likely give rise to effects not seen here. For example it would be interesting to see how the smaller structure might affect the reversibility of the collapse. As the reversibility appears to be dependent on the balance of how easy it is for air to penetrate back in between the pillars versus how easily a bubble can be formed on top of the surface, simply making the surface more hydrophobic might not automatically imply better reversibility. Perhaps a surface can be designed with this in mind to optimise reversibility.
Acknowledgements
This work was supported by grant from The Swedish Diamond Centre (financed by Uppsala University).References
- D. Quéré, Nat. Mater., 2002, 1, 14–15 CrossRef CAS.
- L. Gao, T. J. McCarthy and X. Zhang, Langmuir, 2009, 25, 14100–14104 CrossRef CAS.
- Q. S. Zheng, Y. Yu and Z. H. Zhao, Langmuir, 2005, 21, 12207–12212 CrossRef CAS.
- E. J. Lobaton and T. R. Salamon, J. Colloid Interface Sci., 2007, 314, 184–198 CrossRef CAS.
- B. Liu and F. F. Lange, J. Colloid Interface Sci., 2006, 298, 899–909 CrossRef CAS.
- H. Kusumaatmaja, M. L. Blow, A. Dupuis and J. M. Yeomans, Europhys. Lett., 2008, 3, 36003 CrossRef.
- N. A. Patankar, Langmuir, 2010, 26, 8941–8945 CrossRef CAS.
- A. Lafuma and D. Quéré, Nat. Mater., 2003, 2, 457–460 CrossRef CAS.
- Y. C. Jung and B. Bhushan, Langmuir, 2008, 24, 6262–6269 CrossRef CAS.
- P. Tsai, S. Pacheco, C. Pirat, L. Lefferts and D. Lohse, Langmuir, 2009, 25, 12293–12298 CrossRef CAS.
- S. Moulinet and D. Bartolo, Eur. Phys. J. E, 2007, 24, 251–260 CrossRef CAS.
- M. Nosonovsky and B. Bhushan, Langmuir, 2008, 24, 1525–1533 CrossRef CAS.
- T.-G. Cha, J. W. Yi, M.-W. Moon, K.-R. Lee and H.-Y. Kim, Langmuir, 2010, 26, 8319–8326 CrossRef CAS.
- E. Bormashenko, R. Pogreb, G. Whyman and M. Erlich, Langmuir, 2007, 23, 6501–6503 CrossRef CAS.
- J. Ou, B. Perot and J. P. Rothstein, Phys. Fluids, 2004, 16, 4635–4643 Search PubMed.
- J. Ou and J. P. Rothstein, Phys. Fluids, 2005, 17, 103606 Search PubMed.
- C.-H. Choi, U. Ulmanella, J. Kim, C.-M. Ho and C.-J. Kim, Phys. Fluids, 2006, 18, 087105 Search PubMed.
- P. Joseph, C. Cottin-Bizonne, J.-M. Benoît, C. Ybert, C. Journet, P. Tabeling and L. Bocquet, Phys. Rev. Lett., 2006, 97, 156104 CrossRef CAS.
- G. McHale, M. I. Newton and N. J. Shirtcliffe, Soft Matter, 2010, 6, 1409 RSC.
- G. Londe, A. Chunder, A. Wesser, L. Zhai and H. J. Cho, Sens. Actuators, B, 2008, 132, 431–438 CrossRef.
- P. Roach, N. Shirtcliffe and M. Newton, Soft Matter, 2008, 4, 224–240 RSC.
- E. Lauga and H. A. Stone, J. Fluid Mech., 2003, 489, 55–77 Search PubMed.
- C. Ybert, C. Barentin, C. Cottin-Bizonne, P. Joseph and L. Bocquet, Phys. Fluids, 2007, 19, 123601 Search PubMed.
- L. Courbin, E. Denieul, E. Dressaire, M. Roper, A. Ajdari and H. A. Stone, Nat. Mater., 2007, 6, 661–664 CrossRef CAS.
- M. Karlsson, P. Forsberg and F. Nikolajeff, Langmuir, 2010, 26, 889–893 CrossRef CAS.
Footnote |
| † Electronic supplementary information (ESI) available: Further details of the sample preparation, some more simulation results and a video showing the reversible Cassie-Wenzel transition as pressure is increased and lowered. See DOI: 10.1039/c0sm00595a |
| This journal is © The Royal Society of Chemistry 2011 |
