Suction of hydrosoluble polymers into nanopores
Lucie
Béguin
a,
Bruno
Grassl
b,
Françoise
Brochard-Wyart
c,
Mohammed
Rakib
a and
Hervé
Duval
*a
aEcole Centrale Paris, Laboratoire de Génie des Procédés et Matériaux, Grande Voie des Vignes, 92295, Châtenay-Malabry Cedex, France
bUniversité de Pau et des Pays de l'Adour, IPREM UMR CNRS/UPPA 5254, Hélioparc Pau Pyrénées, 2 Avenue du Président Angot, 64053, Pau cedex 09, France
cInstitut Curie, Laboratoire PCC/UMR 168, 11 rue Pierre et Marie Curie, 75231, Paris Cedex 05, France
First published on 29th September 2010
Abstract
Forced penetration of large hydrosoluble polymer chains through track-etched membranes has been investigated as a function of both solvent flow rate in the pores and the ratio of polymer hydrodynamic radius to pore radius. We measure the rejection coefficient Robs from retentate and permeate mean concentrations, and its corrected value R including polymer accumulation at the membrane. The variations of R as a function of solvent flow rate per pore in adimensional units collapse into the same curve well fitted by de Gennes' “suction model”. This curve, universal for flexible polymers in good solvents, leads to an estimate of the critical penetration flow.
1. Introduction
The transport of flexible polymers in solution through porous media controls many processes: size exclusion chromatography, ultrafiltration and enhanced oil recovery (extraction of oil from porous geological structures by injection of a high molecular weight polymer solution).A simple view of the passage of polymers through porous media is purely geometrical: solutes of a size comparable to or larger than the pore size cannot easily penetrate.
This picture is relevant for polymer solutions in the dilute regime when the solutions are immobile or when the solvent flow is low. However, flexible polymers deviate from hard-sphere behaviour and penetrate small pores when the polymer concentration or the solvent flow rate is increased.1
Using the scaling approach,2 Daoudi and Brochard3 have evaluated the static partition coefficient (i.e., the ratio of the solute concentration inside the pore to the solute concentration outside) of polymer chains in a good solvent, in both dilute and semi-dilute regimes. Daoudi and Brochard's predictions have been qualitatively confirmed in several experimental studies.4–6 Guillot et al.7 could handle quantitative validations by studying the diffusion of polymer chains through a track-etched membrane with cylindrical pores. In the dilute regime, the parameter that controls the passage of the chains is the ratio λ of the hydrodynamic radius rh to the pore radius rp: for λ > 1, the chains are excluded. When the concentration is increased in the semi-dilute regime, the relevant parameter is the average distance between entanglements which represents the screening length for both excluded volume and hydrodynamic interactions: in the semi-dilute regime, chains penetrate pores up to a diameter of the order of the screening length.
Furthermore, Daoudi and Brochard3 have studied the penetration of polymer chains into pores driven by hydrodynamic flows in the case of a good solvent. They propose the “affine stretching model”. The broad lines of their model are the following: as the flow of solvent is convergent at the entrance of the pores, the velocity field is assumed to be:
 | (1) |
 | (2) |
An isolated molecule subjected to an elongational flow is slightly deformed if the elongational shear s is less than a critical value sc. On the contrary, the molecule follows the deformation imposed by the solvent if s ≥ sc. This type of deformation is called “affine”, meaning that the molecule is deformed in the same way as a fluid element. The critical shear value is of the order of the Zimm relaxation frequency of the polymer chain:
 | (3) |
 | (4) |
The entrance condition R⊥(rp) = rp leads to rc = rg. Thus, the critical solvent flow rate for a chain to enter into a pore is given by:
 | (5) |
Experimental evidence of forced penetration is reported in the literature for the following polymers in good solvent: PEG (molecular weight 1.5 × 10⁴–3.5 × 10⁴ Da, λ unknown) in water,5dextran (7 × 10⁴–2 × 10⁶ Da, λ unknown) in water,5polystyrene (105–2 × 10⁷ Da, λ = 0.8–4.1) in a mixed solvent of 90% tetrachloride–10% methanol,8polystyrene (7.75 × 10⁵–6.8 × 10⁶ Da, λ = 0.8–1.2, 105–3.5 × 10⁵ Da, λ unknown) in ethyl acetate,9,10polystyrene (3.5 × 10⁴ Da and 6.9 × 10⁶ Da, λ = 0.9 and 9.9) in toluene.11
These experiments have been essentially performed in pressure driven dead-end ultrafiltration devices and basically consist of measuring the observed rejection coefficient, Robs, of the polymer, i.e.,
 | (6) |
 | (7) |
Some authors8,9,11 use well-controlled systems, as required for quantitative results, consisting of mono-disperse flexible polymers and well-calibrated membranes such as track-etched ones. Hence, Long and Anderson8 performed ultrafiltration of polystyrene solutions through track-etched mica sheets in an agitated cell. They observed that the true rejection coefficient is independent of polymer and pore dimensions (as long as rh > rp) and is only a function of solvent flow rate per pore, a result consistent with scaling law predictions.3
However, most studies5,8–10 report a smooth transition from total retention to forced penetration, except for Jin and Wu,11 who observed a sharp transition at a critical solvent flow rate. To intercept a smooth transition, de Gennes12 constructed the “suction model”, which gives rise to an energy barrier to enter the pore, and a spreading of the transition.
More recently, Markesteijn et al.13 performed mesoscale simulations to investigate forced penetration of polymers into nanopores. Their numerical results confirm that the critical solvent flow rate is independent on λ, depends linearly on the temperature and is inversely proportional to solvent viscosity. Moreover, their numerical results show a smooth transition from total retention to full transmission.
In order to experimentally study and characterise the transition from total retention to forced penetration, we have undertaken a series of experiments using a high molecular weight hydrosoluble polymer, track-etched membranes and a cross-flow ultrafiltration set-up. Special care has been taken to analyse the molecular weight distribution of the polymer and to characterise the membrane microgeometry. The polarisation effects that control polymer concentration at the membrane surface have been carefully included.
In the present paper, we measure the permeate flow and the observed rejection coefficient of the polymer for different values of the transmembrane pressure and of the polymer concentration. Then, we derive the true rejection coefficient using a model for the polymer accumulation at the membrane. We analyse its variations with the solvent flow rate per pore, using de Gennes' “suction model”.12 Finally, we give an experimental estimate of the critical solvent flow rate per pore leading to polymer suction.
2. Experimental methods
2.1. Membranes
We used commercialised track-etched polycarbonate membranes coated with polyvinylpyrrolidone. These membranes, supplied by GE Osmonics, are symmetric and have controlled cylindrical pores. The experiments were performed on membrane models KN3CP81030 and KN5CP81030. These models essentially differ by their nominal pore diameter, equal to 30 nm and 50 nm, respectively, as given by the supplier. They are referred to below as TEM_0.03 and TEM_0.05, respectively.Two techniques were used to characterise the membrane microgeometry; they are discussed below.
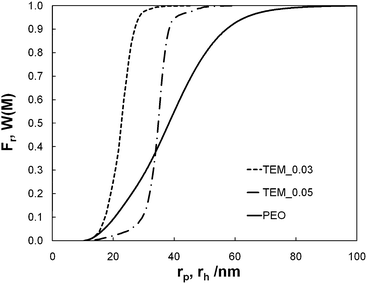 | ||
| Fig. 1 Cumulative pore size distribution (Fr) of membrane models TEM_0.03 (dash line) and TEM_0.05 (dash-dot line) against the pore radius (rp) and cumulative molar mass distribution (W(M)) of PEO (solid line) against the hydrodynamic radius (rh). | ||
2.2. Polymer solution
The hydrosoluble polymer used is a large molar mass polyethylene oxide (PEO) supplied by Sigma Aldrich (CAS number 25322-68-3, nominal molar weight equal to 106 g mol−1). The polymer, in powder form, is dissolved in milliQ water at concentrations ranging from 0.05 g L−1 to 0.3 g L−1. Solutions are homogenized by gentle magnetic agitation for 9 h.The PEO concentration of the permeates and retentates resulting from ultrafiltration is measured by differential refractometry (Knauer Differential Refractometer). Uncertainty of concentration measurement is below 2%.
The weight-average molar mass (Mw), radius of gyration (rg), polydispersity (Ip), and differential molar mass distribution (w(M)) of the PEO samples were determined by size exclusion chromatography (SEC) using a Waters Alliance 2690 (USA) chromatograph equipped with three Shodex OHpak columns (SB-806HQ, SB-804HQ, and SB-802.5HQ) and two online detectors: a differential refractometer and a Dawn DSP light scattering detector (MALS) from Wyatt (USA) equipped with a K5 cell and a He–Ne laser (λ = 632.8 nm). A 0.1 M solution of NaNO3 was used as the eluent at a flow rate of 0.5 mL/min. Samples were prepared by dissolving the polymers in 0.1 M NaNO3 and then filtering with a 0.45 μm filter (Millipore) after about 24 h. 100 μL of the solutions were injected at a concentration of about 0.2 mg/mL. The weight-average molar mass, radius of gyration, and polydispersity were obtained from data collected and analysed using ASTRA SEC-software (version 4.90, Wyatt Technology Corp., USA). The calculations of molar mass and radius of gyration were carried out according to the Zimm fit method (dn/dc = 0.135 ± 0.002 mL/g in 0.1 M NaNO3).16 Systematic errors occur because of incorrect values of dn/dc, refractometer calibration factor k and the band-broadening effect. The band-broadening correction was not considered because this correction did not affect the final results. The effects of k and dn/dc on the weight-average molar mass Mw are proportional to k−1 and (dn/dc)−1, respectively (no effect on rg). For the Mw value, this systematic error can be prevented by using the same refractometer detector for the k and dn/dc determinations. The error limit is estimated at 8% on Mw and rg, based on the mean standard deviation from multiple injections.17
The differential molar mass distribution of the PEO before ultrafiltration is reported in Fig. 2. Its weight-average molar mass is equal to Mw = 1.1 × 10⁶ g mol−1 and its polydispersity to Ip = 1.61. Its z-average gyration radius is equal to rg = 84.5 nm. The values of rg are correctly described by the scaling law rg ∼ M0.61w: it can be observed that the value of the Flory exponent is characteristic of a good solvent system and in accordance with the value obtained by Devanand and Selser,18i.e. rg ∼ M0.58±0.03w, for PEO with molar mass from 105 to 106 g mol−1. Knowing the differential molar mass distribution of the PEO before ultrafiltration and using the relation between the hydrodynamic radius rh and Mw established for PEO by Devanand and Selser,18i.e. rh = 1.45 × 10⁻²M0.57 ± 0.01w nm, we could determine the weight-average hydrodynamic radius of the PEO, i.e. rh = 41.4 nm. It is also deduced (see Fig. 1) that the mass fraction of PEO with a hydrodynamic radius greater than r0p = 23 nm (resp. r0p = 35 nm), i.e. the average radius of TEM_0.03 pores (resp. TEM_0.05), is equal to 86% (resp. 61%). Finally the average steric hindrance of PEO characterised by the ratio λ = rh/r0p is equal to 1.2 and 1.8 for TEM_0.03 and TEM_0.05, respectively.
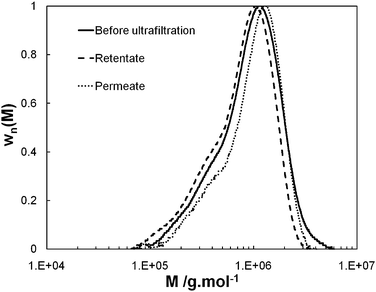 | ||
| Fig. 2 Normalized differential molar mass distribution of the PEO (wn(M)) as a function of the molar mass (M). Before ultrafiltration (solid line), retentate (dash line) and permeate (dot line) for the set of operating parameter values, TMP = 0.4 bar and cr/c* = 0.41. | ||
2.3. Ultrafiltration set-up
The experimental set-up is represented in Fig. 3. It includes a Watson-Marlow 624U peristaltic pump, which pumps the PEO solution from the feed tank to the ultrafiltration module (Rayflow®2 × 100, Orelis-Novasep Group). The volume of PEO solution used for an ultrafiltration test is approximately 500 mL. The feed tank is kept at a constant temperature of 25.0 ± 0.1 °C using an RM6 Lauda cryostat. The membrane feed vein is a channel with length Lc = 170 mm, width 76 mm and thickness 0.5 mm. The equivalent hydraulic diameter of the channel is equal to de = 1 mm. The active surface of the membrane is equal to 129.2 cm2 (only one membrane is mounted at a time). Transmembrane pressure (TMP) is adjusted thank to the pump and a valve located in the retentate loop, with the permeate exiting the module at atmospheric pressure. TMP is measured on entry to the module using an electronic manometer (MD10, Essor Français Electronique) accurate to 0.01 bar. The relative discrepancy between measured transmembrane pressure and the specification pressure is at the most 4%. This is chiefly related to the pulsations of the pump. The loss of pressure throughout the module (from entry to exit on the retentate side) is estimated at the most at 0.07 bar (assuming Poiseuille flow, while suction on the membrane tends to reduce that loss of pressure further), which represents 4%–20% of transmembrane pressure (for TMP = 2 bar and TMP = 0.4 bar, respectively). Retentate flow is measured using a turbine flowmeter (101-8T, McMillan Company). The pulsations of the pump cause oscillation in the flow, of an amplitude that remains below 4% of the specification flow. Finally, permeate flow is determined by weighing.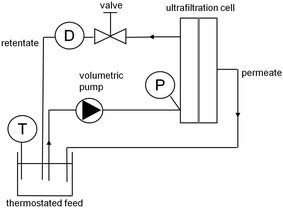 | ||
| Fig. 3 Experimental device (the manometer and the flowmeter are denoted P and D, respectively). | ||
2.4. Experimental protocol
Every experimental trial is carried out with a new membrane. A trial is mainly comprised of two stages: measurement of the hydraulic resistance of the membrane in pure water, then ultrafiltration of the PEO solution as such. The ultrafiltration of PEO solutions is done at constant transmembrane pressure and at constant retentate flow, with total recycling (i.e. of both retentate and permeate) for 4 min. The examined transmembrane pressure is in the range from 0.4 to 2 bars (the maximum transmembrane pressure for using TEM_0.03 and TEM_0.05 membranes in our device is approximately 2 bars). For all PEO ultrafiltration trials, the retentate volume flow is set at 2.25 L min−1, i.e., an average speed of u0 = 1 m s−1 in the feed channel: in these conditions, flow is laminar as the Reynolds number Re = ρsu0de/ηs is equal to 1100 (where ρs is the density of the pure solvent). It should be noted that the ratio of permeate flow to retentate flow is less than 1%. In these conditions, it can reasonably be considered that PEO bulk concentration does not vary between feed and retentate. Samples of retentate and permeate are taken at t = 4 min and analysed by differential refractometry and SEC-MALS: refractometry gives access to the PEO concentration, whereas the SEC-MALS facility is used to check PEO integrity. Each ultrafiltration trial is carried out at least twice.3. Results and discussion
The output data from the ultrafiltration experiments are mainly permeate flux (Jv, ratio of permeate volume flow to active surface of membrane) and observed rejection coefficient (Robs). The input parameters examined are transmembrane pressure (TMP), PEO concentration of feed (cr) and average steric hindrance of PEO in membrane pores (λ): TMP = 0.4, 0.8, 1.2 and 2 bar; cr = 0.05, 0.1, 0.2, and 0.3 g L−1, i.e. cr/c* = 0.07, 0.14, 0.28 and 0.41 (where c* = 0.7 g L−1 is the overlap concentration estimated in assuming that the pervaded volume of the polymer chain is a sphere of radius rg) and λ = 1.2 and 1.8 (corresponding to membrane model TEM_0.05 and TEM_0.03, respectively).First, we examine the effect of transmembrane pressure and PEO concentration on permeate flux and, second, the effect of permeate flux on observed rejection coefficient. Then, we determine the bulk mass transfer coefficient of the PEO chains as a function of permeate flux and we deduce the value of the true rejection coefficient. Finally, we analyse the variations in true rejection coefficient against the solvent flow rate per pore, using (i) Daoudi and Brochard's affine stretching model, (ii) de Gennes' “suction model”. In particular, we quantify the effect of pore polydispersity on the shape of the forced permeation transition.
3.1. Permeate flux and observed rejection coefficient
Fig. 4 summarises the values of the permeate flux and observed rejection coefficient measured at t = 4 min for different sets of operating parameter values, i.e. TMP and cr/c* sets, in the case of membrane model TEM_0.05.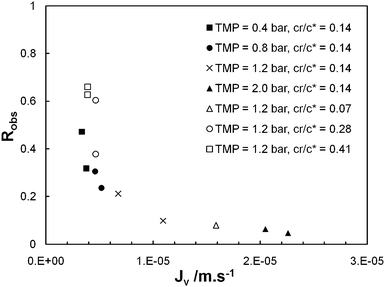 | ||
| Fig. 4 Observed rejection coefficient (Robs) at t = 4 min against instantaneous permeate flux (Jv) at t = 4 min for ultrafiltration tests performed with membrane model TEM_0.05 (λ = 1.2) at sets of operating parameters (TMP = 0.4, 0.8, 1.2, 2.0 bar; cr/c* = 0.14) and (TMP = 1.2 bar; cr/c* = 0.07, 0.14, 0.28, 0.41). | ||
First, it is observed that permeate flux depends of course on the transmembrane pressure (Jv increases from 3.4 × 10⁻⁶ to 2.0 × 10⁻⁵ m s−1 when TMP varies from 0.4 to 2 bars, the PEO concentration of the feed being set at cr/c* = 0.14) but also on the POE concentration of the feed (Jv decreases from 1.6 × 10⁻⁵ to 3.9 × 10⁻⁶ m s−1 when cr/c* varies from 0.07 to 0.41, TMP being set at 1.2 bar). The decrease in permeate flux when PEO concentration increases is explained by concentration polarisation and by PEO chains clogging the pores. Indeed, these phenomena induce an increase in the total hydraulic resistance of the membrane. Hence, the hydraulic resistance associated with the concentration polarisation layer typically varies in a power-law relation to the feed concentration.19,20 The exponent, determined experimentally,21 here has a value of 0.33, in accordance with the data available in the literature, i.e. 0.42 for the ultrafiltration of dextran19 and 0.3 for the ultrafiltration of polyvinylpyrrolidone.20 Last, for the same set of operating parameter values, a dispersion of permeate flux values is seen. This dispersion is related to the history effect: the time to set transmembrane pressure prior to starting the stopwatch is not strictly identical from one trial to another; in those conditions, the total hydraulic resistance of the membrane at t = 0 may differ.
Fig. 4 shows that the observed rejection coefficient is closely correlated to permeate flux. Robs varies from 0.66 to 0.06 when Jv varies from 3.4 × 10⁻⁶ to 2.0 × 10⁻⁵ m s−1. For any trial, SEC-MALS analysis (see an example of SEC-MALS analysis in Fig. 2) shows that the differential molar mass distribution of permeate, retentate and initial feed are close together (discrepancies in molar mass and gyration radius remain within the uncertainty bracket of the SEC-MALS analysis). First, we deduce that the mechanical degradation of the PEO under the effect of shearing22 (which could be responsible for the decrease in Robs when Jv increases) remains negligible in the first four minutes of ultrafiltration. Second, as the permeate and retentate have the same POE molar mass distribution, the values of observed rejection coefficient are not just due to PEO fractions with lower molar mass (hydrodynamic diameter less than pore diameter), but also to fractions with high molar mass, which, under the effect of the shearing of the fluid are stretched and can penetrate the pores. These results suggest that (i) there is forced permeation of polymer chains at high values of Jv (ii) this phenomenon also exists at low values of Jv but less markedly, and (iii) clogging of pores by long chains, i.e. such as λ > 1, probably prevents shorter chains, i.e. such as λ < 1, from going through, hence the observed lack of separation between long and short chains.
It should be noted that on top of the phenomenon of forced permeation, the phenomenon of concentration polarisation may also affect the observed rejection coefficient: polymer chains are convected from the centre of the solution to the membrane where they tend to accumulate. For a given partition coefficient (assumed as independent of Jv) of PEO chains between the inside and outside of pores, PEO concentration at the membrane surface (cm) increases with Jv and becomes greater than the concentration of the bulk, cr, leading to a decrease in observed rejection coefficient. Furthermore, the PEO concentration gradient between membrane and bulk causes a back-diffusion flow of PEO chains in opposition to the convective flow.
3.2. Corrected rejection coefficient
To calculate the true rejection coefficient (R), we need a model to estimate the effective polymer concentration at the membrane surface cm (>cr, mean retentate concentration). The stagnant film model23 expresses cm in term of the mean retentate and permeate concentrations, the permeate flux and the solute bulk mass transfer coefficient (km): | (8) |
 | (9) |
The experimental data (Jv, Robs) obtained for cr/c* = 0.14 and 0.41 in the case of λ = 1.2 are plotted in the form suggested by eqn (9) with the results shown in Fig. 5: both curves are roughly linear for the smallest values of Jv as well as for the largest values of Jv and the curves are strongly non linear for the intermediate values of Jv, this behaviour being attributed to the transition from large retention to full transmission of the PEO chains. This trend has already been noticed by Latulippe et al. for the ultrafiltration of supercoiled plasmid DNA.24 The bulk mass transfer coefficient km can be estimated as the reciprocal of the curve slope. The estimates of km for the experiments performed at cr/c* = 0.14 and 0.41 are reported in Fig. 6. They concur well with Lévêque's boundary layer model25 for the smallest values of Jv and with De and Bhattacharya's model26 for larger values of Jv. Indeed, De and Bhattacharya's approach takes into account the effect of suction on the developing concentration boundary layer leading to:
 | (10) |
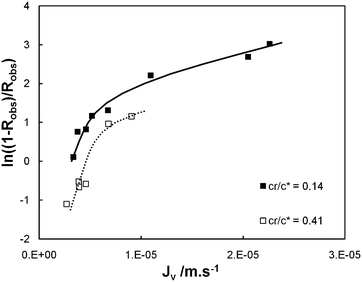 | ||
| Fig. 5 Plot of ln(1/Robs − 1) against the permeate flux (Jv) for ultrafiltration tests performed with membrane model TEM_0.05 (λ = 1.2) at dimensionless PEO concentration cr/c* equal to 0.14 and 0.41. | ||
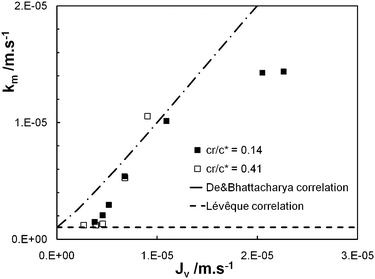 | ||
| Fig. 6 Bulk mass transfer coefficient of PEO chains (km) against the permeate flux (Jv): experimental estimations (for cr/c* = 0.14 and 0.41) and correlations of Lévêque25 and De and Bhattacharya.26 | ||
We plot in Fig. 7 the true rejection coefficient, R, and the observed rejection coefficient, Robs, as a function of the normalized solvent flow rate per pore, qp/(kBT/ηs), for λ = 1.2 and 1.8. It can be noted that the true rejection coefficient is significantly larger than the observed rejection coefficient. For the smallest value of qp, the true rejection coefficient is close to 1 even in the case of TEM_0.05 (weight average ratio characterising hindrance, λ = 1.2). This is surprising because the fraction of PEO chains with a hydrodynamic radius smaller than the mean pore radius is estimated at about 40%. This large PEO retention is attributed to a hindrance effect27,28 which strongly reduces polymer transmission when the polymer chains are smaller but of the order of the pore size, and to pore clogging by larger polymer chains, preventing smaller ones from passing through the membrane. For the largest values of qp, the true rejection coefficient is significantly lower: R falls below 0.2.
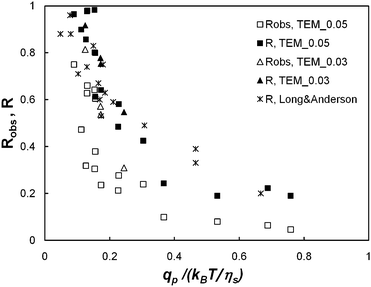 | ||
| Fig. 7 The observed and the true rejection coefficients (Robs and R, respectively) against the dimensionless solvent flow rate per pore (qp/(kBT/ηs)) for membrane models TEM_0.05 and TEM_0.03, i.e. λ = 1.2 and 1.8, respectively. Long and Anderson's8 data (such as λ > 1) are also reported on the present graphic. | ||
The examination of the variations of R as a function of qp shows that the transition from large retention to full transmission is gradual. This result concurs with the findings of most studies.5,8–10 On the other hand, the examination of variations of Robs alone would lead us to believe that this transition is sharp. Hence, we may expect that the sharpness of the transition observed by Jin and Wu11 is a polarisation effect (indeed, they implicitly assimilate Robs to R even though their device is not mechanically agitated).
Finally, Long and Anderson's data,8 obtained for the ultrafiltration of polystyrene in a mixed solvent of 90% tetrachloride–10% methanol are reported in Fig. 7: it appears that Long and Anderson's data collapse into the same curve as the points representing the present experiments.
3.3. Pore polydispersity
As the pore size distribution of the membranes used in the present study has been carefully characterised, we are able to quantify the effect of the pore polydispersity on the apparent spreading of the transition. This effect could be significant (even for track-etched membranes) as the pure solvent flow rate in a pore of radius rp scales as r4p. We have developed a simple “threshold model” which takes into account the pore size distribution of the membrane model (determined in section 2.1), assumes Poiseuille flow in the pores and considers that, for a given pore class, denoted i of radius rip and associated frequency fir, the retention of the polymer is complete (i.e. the true rejection coefficient of class i is equal to Ri = 1) when the solvent flow rate, qip, in the current pore of class i is lower than qcp (according to Daoudi and Brochard's model). And the retention vanishes (Ri = 0) as soon as qip ≥ qcp. Then, the true rejection coefficient of the membrane expresses as: | (11) |
The average solvent flow rate per pore, qp, is given by  and the solvent flow rate in a pore of class i reads qip = (πri4p/8lηs)TMP, which can be rewritten as
  .
.
Fig. 8 presents the comparison between the threshold model and the experimental values of the true rejection coefficient obtained for the membrane model TEM_0.05. The best fit is obtained for a critical solvent flow rate equal to qcp = 0.27(kBT)/ηs. It should be noted that the discretisation of the pore size distribution into classes of finite width is responsible for the steps visible on the curve provided by the threshold model. Fig. 8 shows that the pore polydispersity alone cannot explain the spreading of the forced permeation transition over one decade. In particular, it fails to describe the values of the rejection coefficient for qp/(kBT/ηs) > 0.3. We discuss now a second model developed by de Gennes.12
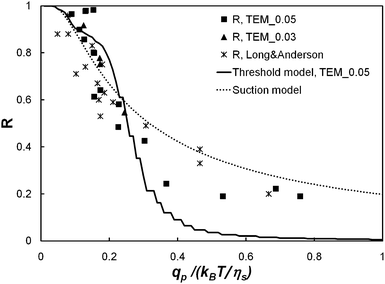 | ||
| Fig. 8 Comparison between the threshold model (solid line), the suction model (dot line) and the experimental values of the true rejection coefficient (square: TEM_0.05, λ = 1.2; triangle: TEM_0.03, λ = 1.8; star: Long and Anderson's8 data). | ||
3.4. de Gennes suction model12
To explain the gradual transition from large retention to full transmission, de Gennes introduced the suction model: under the flow qp = πr2pup inside a pore, a polymer chain (constituted of N monomers) enters progressively. Let us consider the situation corresponding to the penetration of P (P ≤ N) monomers. The conformation of the confined part of the chain can be pictured as a string of blobs of radius rp. The length of this string (y) is given by: | (12) |
 | (13) |
The resisting force due to the confinement scales as:29
 | (14) |
The hydrodynamic force fhyd can be estimated as a Stokes drag on the blobs. Assuming that y is larger than the blob size, we get:
 | (15) |
The variation of free energy (13) can thus be rewritten as:
 | (16) |
 | (17) |
 | (18) |
The suction of polymer chains into pores should be significant when ΔG# is at the most of the order of kBT. The critical flux (qcp) corresponds to ΔG# ≈ kBT and is given by qcp ≈ kBT/ηs which is identical to the critical flux provided by the affine stretching model (eqn (5)). This can be rewritten as:
 | (19) |
The energy barrier corresponds to the penetration of the first blob; as the number of sucked blobs increases, the confinement force stays constant whereas the aspiration force increases linearly with y and the chain is sucked in.
If we assume thermodynamic equilibrium between both sides of the pore entrance, the true rejection coefficient is given by:
 | (20) |
Then, eqn (20) can be used to fit the present experimental results together with Long and Anderson's data. The least square fit (see Fig. 8) is obtained for a critical solvent flow rate equal to qcp = (0.22 ± 0.01)kBT/ηs. When the present experimental results (resp. Long and Anderson's data) are fitted separately, the fitting value of qcp is equal to qcp = (0.24 ± 0.02)kBT/ηs (resp. qcp = (0.19 ± 0.01)kBT/ηs). The discrepancy between both fitting values is attributed to supplementary interactions (physical chemical ones as opposed to purely steric and hydrodynamic ones) acting in the present experiments between the polymer chains and the membrane surface and between the polymer chains themselves.30
The magnitude of the critical solvent flow rate concurs with Daoudi and Brochard's3 and de Gennes'12 theoretical prediction. It is much larger than Jin and Wu’s11 experimental estimate, i.e. qcp = 0.006kBT/ηs. We attribute this discrepancy to the conical shape of the pores of the special double-layer membrane used by Jin and Wu.11 Indeed, according to Daoudi and Brochard,3 the critical solvent flow rate in a conical pore is smaller than the critical solvent flow rate in a cylindrical pore as long as the radius of the cone entrance is larger than the polymer radius: in the limit of a small cone angle, it is given by qcp ≈ εkBT/ηs where ε is the angle of the cone.
It must be noticed that as in section 3.3, it is possible to take into account the pore size distribution of the membrane. The true rejection coefficient is then given by:
 | (21) |
For the present membrane models, i.e. TEM_0.05 and TEM_0.03, the pore size distribution is too narrow to significantly affect the estimation of qcp.
4. Conclusion
For the first time, forced permeation transition has been quantitatively analysed using de Gennes’ suction model.The comparison of the present experimental results (PEO aqueous solution through track-etched polycarbonate membrane) and those of Long and Anderson8 (polystyrene solution through track-etched mica sheet) shows that the variations of the true rejection coefficient, R, as a function of the dimensionless solvent flow rate per pore, qp/(kBT/ηs), collapse into the same curve. This curve should be universal for flexible linear polymers in good solvent (as long as rh > rp).
The transition from total retention (R = 1) to full transmission (R = 0) does not occur as abruptly as Daoudi and Brochard's3 affine stretching model predicts. This confirms the findings of earlier experimental studies.5,8–10 The present experiments establish that the smoothness of the transition is not due to the pore polydispersity of the membrane or to the polymer polydispersity of the feed but is intrinsic to the permeation phenomenon.
The shape of R versus qp is well fitted by de Gennes'12 suction model, based on the free energy barrier that a polymer chain must overcome to enter a pore. The equation of the rejection curve can be written as R = 1 − exp(−qcp/qp). The critical solvent flow rate, qcp, has been estimated at qcp = (0.22 ± 0.01)kBT/ηs. It is independent upon the pore size and the polymerization index as predicted by Daoudi and Brochard3 and de Gennes.12
References
- C. K. Colton, C. N. Satterfield and C. J. Lai, AIChE J., 1975, 21, 289–298 CrossRef CAS; C. N. Satterfield, C. K. Colton, B. de Turckheim and T. M. Copeland, AIChE J., 1978, 24, 937–940 CrossRef CAS.
- P. G. De Gennes, Macromolecules, 1976, 4, 587–593 CrossRef.
- S. Daoudi and F. Brochard, Macromolecules, 1978, 11, 751–758 CrossRef CAS.
- D. S. Cannell and F. Rondelez, Macromolecules, 1980, 13, 1599–1602 CrossRef CAS.
- Q. T. Nguyen and J. Neel, J. Membr. Sci., 1983, 14, 111–128 CrossRef.
- T. D. Long and J. L. Anderson, J. Polym. Sci., Polym. Phys. Ed., 1985, 23, 191–197 CrossRef CAS.
- G. Guillot, L. Léger and F. Rondelez, Macromolecules, 1985, 18, 2531–2537 CrossRef CAS.
- T. D. Long and J. L. Anderson, J. Polym. Sci., Polym. Phys. Ed., 1984, 22, 1261–1281 CrossRef CAS.
- G. Guillot, Ph. D. Thesis, University of Paris Sud, 1986.
- M. A. M. Beerlage, M. L. Heijnen, M. H. V. Mulder, C. A. Smolders and H. Strathmann, J. Membr. Sci., 1996, 113, 259–273 CrossRef CAS.
- F. Jin and C. Wu, Phys. Rev. Lett., 2006, 96, 237801–4 CrossRef.
- C. Gay, P.-G. de Gennes, E. Raphaël and F. Brochard-Wyart, Macromolecules, 1996, 29, 8379–8382 CrossRef CAS; P.-G. De Gennes, in Advances in Polymer Science, ed. S. Granick, Springer, Berlin, 1999, vol. 138, pp. 92–105 Search PubMed; T. Sakaue, E. Raphaël, P.-G. de Gennes and F. Brochard-Wyart, Europhys. Lett., 2005, 72(1), 83–88 Search PubMed.
- A. P. Markesteijn, O. B. Usta, I. Ali, A. C. Balazs and J. M. Yeomans, Soft Matter, 2009, 5, 4575–4579 RSC.
- J. I. Calvo, A. Hernandez, G. Caruana and L. Martinez, J. Colloid Interface Sci., 1995, 175, 138–150 CrossRef CAS.
- C. Schonenberger, B. M. I. vanderZande, L. G. J. Fokkink, M. Henny, C. Schmid, M. Kruger, A. Bachtold, R. Huber, H. Birk and U. Staufer, J. Phys. Chem. B, 1997, 101, 5497–5505 CrossRef; P. Y. Apel, I. V. Blonskaya, S. N. Dmitriev, O. L. Orelovitch and B. Sartowska, J. Membr. Sci., 2006, 282, 393–400 CrossRef CAS.
- S. Paillet, B. Grassl and J. Desbrieres, Anal. Chim. Acta, 2009, 636(2), 236–41 CrossRef CAS.
- G. Dupuis, J. Rigolini, G. Clisson, D. Rousseau, R. Tabary and B. Grassl, Anal. Chem., 2009, 81(21), 8993–9001 CrossRef CAS.
- K. Devanand and J. C. Selser, Macromolecules, 1991, 24, 5943–5947 CrossRef CAS.
- H. M. Yeh and T. W. Cheng, Sep. Sci. Technol., 1993, 28, 1341–1355 CrossRef.
- H. M. Yeh and H. H. Wu, J. Membr. Sci., 1997, 124, 93–105 CrossRef CAS.
- L. Béguin, Ph. D. Thesis, Ecole Centrale Paris, 2008.
- S. A. Vanapalli, M. T. Islam and M. J. Solomon, Phys. Fluids, 2005, 17, 095108 Search PubMed; A. R. D'Almeida and M. L. Dias, Polym. Degrad. Stab., 1997, 56, 331–337 CrossRef CAS; B. A. Buchholz, J. M. Zahn, M. Kenward, G. W. Slater and A. E. Barron, Polymer, 2004, 45, 1223–1234 CrossRef CAS.
- L. J. Zeman, A. L. Zydney, in Microfiltration and Ultrafiltration, Principles and Applications, ed. Marcel Dekker, Inc., New York, 1996, ch. 7, pp. 354–357 Search PubMed.
- D. R. Latulippe, A. Kimberlyn and A. L. Zydney, J. Membr. Sci., 2007, 294, 169–177 CrossRef CAS.
- M. A. Lévêque, Ann. Mines Paris, 1928, 13, 201–409 Search PubMed.
- S. De and P. K. Bhattacharya, J. Membr. Sci., 1997, 128, 119–131 CrossRef CAS.
- J. D. Ferry, J. Gen. Physiol., 1936, 20(1), 95–104 CrossRef CAS.
- P. Dechadilok and W. M. Deen, Ind. Eng. Chem. Res., 2006, 45, 6953–6959 CrossRef CAS.
- M. Daoud and P.-G. de Gennes, J. Phys., 1977, 38(1), 85–93 CAS.
- P. Pang and P. Englezos, Fluid Phase Equilib., 2002, 194–197, 1059–1066 CrossRef CAS; M. W. Liberatore and A. J. McHugh, J. Non-Newtonian Fluid Mech., 2005, 132, 45–52 CrossRef CAS.
| This journal is © The Royal Society of Chemistry 2011 |
