Spectroscopy and ionization thresholds of π-isoelectronic 1-phenylallyl and benzylallenyl resonance stabilized radicals†
Joshua A.
Sebree
a,
Nathanael M.
Kidwell
a,
Evan G.
Buchanan
a,
Marek Z.
Zgierski
b and
Timothy S.
Zwier
*a
aDepartment of Chemistry, Purdue University, West Lafayette, IN 47907-2084, USA. E-mail: zwier@purdue.edu
bNational Research Council Canada, Ottawa, ON, Canada
First published on 16th June 2011
Abstract
Mass-selective two-color resonant two-photon ionization (2C-R2PI) spectra of two resonance stabilized radicals (RSRs), 1-phenylallyl and benzylallenyl radicals, have been recorded under jet-cooled conditions. These two radicals, while sharing the same radical conjugation, have unique properties. The D0–D1 origin of the 1-phenylallyl radical is at 19208 cm−1, with extensive vibronic structure extending over 2000 cm−1 above the D1 origin. Much of this structure is assigned based on comparison with DFT and TDDFT calculations. Two-color photoionization efficiency scans reveal a sharp ionization threshold, providing a precise adiabatic ionization potential for the radical of 6.905(2) eV. By comparison, the benzylallenyl radical has an electronic origin at 19703 cm−1 and Franck–Condon activity similar to phenylallyl. The photoionization efficiency curve shows a gradual onset with apparent threshold at ∼7.50(2) eV. Visible–visible holeburning was used to show that each radical exists in one isomeric form in the expansion. The CH stretch IR spectrum of each radical was taken using D0-resonant ion dip infrared spectroscopy (D0-RIDIRS) in a novel four-laser experiment. Comparison of the IR spectrum with the predictions of DFT B3LYP calculations leads to firm assignment of each radical as the trans isomer. TDDFT calculations on the excited states of benzylallenyl suggest the possibility that the excited state levels originally excited convert to an all-planar form prior to ionization. The potential role that these radicals could play in Titan's atmosphere as intermediates in formation pathways for polycyclic aromatic hydrocarbons (PAHs) is briefly discussed.
Introduction
Resonance stabilized radicals (RSRs) play an important role in many contexts. By delocalizing the unpaired electron across a neighbouring π-system, the radical gains stability over that of localized radicals. This stability both favors chemical pathways that lead to the formation of RSRs and allows them to build-up their relative concentration compared to other more reactive radicals. This can have important implications for reaction schemes that take place in a variety of environments, including planetary atmospheres, the interstellar medium and combustion. Once these radicals are formed, a common termination step involves their recombination, producing more complex molecules.The chemistry of small RSRs has been explored in some detail. Propargyl radical (C3H3), one of the smallest RSRs, has been of great interest in the formation of benzene both experimentally1 and in theoretical models.2 Large RSRs offer further possibilities for resonance stabilization, particularly if the radical site is conjugated with a phenyl ring. Vibronic spectra of a number of important RSRs of this type have recently been observed for the first time and characterized under jet-cooled conditions.3–9
In recent ground-breaking work, Schmidt and co-workers spectroscopically characterized the doubly resonance-stabilized 1-phenylpropargyl radical,5,6 with its benzylic radical site linking the phenyl and ethynyl groups. Detection of analogous absorptions in the vinylpropargyl7 and 1-indanyl8 radicals have also been found. Sebree et al. recently recorded vibronic spectra and ionization threshold measurements for 1- and 2-hydronaphthyl and 1,2,3-trihydronaphthyl radicals, determining the binding energy of the ‘extra’ hydrogen in all three cases.3,4 An interesting and potentially important attribute of the benzylic type radicals is that their first excited state absorption occurs in the middle of the visible, near 500 nm. This fact makes them interesting candidates as potential carriers of the diffuse interstellar bands (DIBs) that occur in the same region. However, to date, no matches have been found.
This paper discusses the spectroscopy of two additional doubly resonance-stabilized radicals: phenylallyl and benzylallenyl. The phenylallyl radical (C9H9) exists in two isomeric forms (1-phenylallyl and 2-phenylallyl), with resonance stabilization favoring the former over the latter. In addition, 1-phenylallyl could exist in both cis and trans forms (Scheme 1), thereby presenting a circumstance ideally suited to isomer-specific double-resonance methods that can distinguish the presence and characterize the spectroscopy of each isomer in turn.
 | ||
| Scheme 1 | ||
The 1-phenylallyl radical is a close analog of 1-phenylpropargyl,5,6 here combining benzylic and allylic moieties sharing the same radical center. As a doubly resonance-stabilized radical, 1-phenylallyl possesses the same energetic benefits as 1-phenylpropargyl, and therefore may play a role of similar importance in pathways that lead from benzene to indene, naphthalene and beyond to larger PAHs. From an electronic structure viewpoint, 1-phenylallyl is also a close analog of the 1-hydronaphthyl radical,3,4 which is π-isoelectronic with 1-phenylallyl in its cis form. As we shall see, the 1-phenylallyl radical can be generated by a discharge from either 1-phenylpropene (β-methylstyrene) or 3-phenylpropene (allylbenzene) by the loss of a single H-atom. A recent study by Zhang et al. reported the formation of both of these precursors in crossed molecular beam studies of phenyl radical reactions with propylene, postulating that these products may go on to form indane and indene.10
The benzylallenyl radical (C6H5–ĊH–CH![[double bond, length as m-dash]](https://www.rsc.org/images/entities/char_e001.gif) C
C![[double bond, length as m-dash]](https://www.rsc.org/images/entities/char_e001.gif) CH2) is a C10H9 isomer that extends the phenylallyl structure by one more doubly bonded CH2, forming a terminal allene moiety. It can be produced by removing one hydrogen from benzylallene (C6H5–CH2–CH
CH2) is a C10H9 isomer that extends the phenylallyl structure by one more doubly bonded CH2, forming a terminal allene moiety. It can be produced by removing one hydrogen from benzylallene (C6H5–CH2–CH![[double bond, length as m-dash]](https://www.rsc.org/images/entities/char_e001.gif) C
C![[double bond, length as m-dash]](https://www.rsc.org/images/entities/char_e001.gif) CH2), which is the head to tail product of benzyl and propargyl radicals, two RSRs. We are currently pursuing a photochemical study of benzylallene that has led us to consider the possibility that the benzylallenyl radical could be an intermediate in pathways that lead to the formation of naphthalene from benzylallene,11 motivating its spectroscopic characterization. The out-of-plane π-systems of 1-phenylallyl and benzylallenyl radicals are isoelectronic with one another, since the allene moiety of benzylallene lies in the plane of the ring, with its terminal double bond also in-plane where it is not directly conjugated to the radical site. Again, cis and trans isomers are possible (Scheme 2), with the former well-suited to cyclization.
CH2), which is the head to tail product of benzyl and propargyl radicals, two RSRs. We are currently pursuing a photochemical study of benzylallene that has led us to consider the possibility that the benzylallenyl radical could be an intermediate in pathways that lead to the formation of naphthalene from benzylallene,11 motivating its spectroscopic characterization. The out-of-plane π-systems of 1-phenylallyl and benzylallenyl radicals are isoelectronic with one another, since the allene moiety of benzylallene lies in the plane of the ring, with its terminal double bond also in-plane where it is not directly conjugated to the radical site. Again, cis and trans isomers are possible (Scheme 2), with the former well-suited to cyclization.
 | ||
| Scheme 2 | ||
In the present study, we characterize the vibronic spectroscopy of 1-phenylallyl and benzylallenyl radicals using two-color, resonant two-photon ionization, visible-visible holeburning, threshold photoionization efficiency scans, and resonant ion-dip infrared spectroscopy. In each case, only a single isomer is detected, ascribed based on the spectroscopic evidence as trans-1-phenylallyl and trans-benzylallenyl radicals, those calculated to be the most stable isomeric forms. A complimentary study by Schmidt and co-workers can be found in this volume comparing the spectroscopy of the 1-phenylallyl and inden-2-ylmethyl radicals.9
Experimental methods
Mass selective, isomer-specific studies of RSRs were carried out in a vacuum chamber that has been detailed previously.1 The 1-phenylallyl radical was created by entraining samples of either 1-phenylpropene (β-methylstyrene) or 3-phenylpropene (allylbenzene) in argon at room temperature at a backing pressure of 1 bar. The mixture was then pulsed into a reaction channel (2 mm dia. × 7 mm long) using a pulsed valve (R. M. Jordan) where an electric discharge was timed to interact with the gas pulse just prior to a final expansion, resulting in cold discharge products. In a typical discharge, voltages of +450 V and −50 V were applied to the outer and inner electrodes respectively. These electrodes were held 1 mm apart by a Teflon spacer at the end of the reaction channel (Fig. 1, upper inset).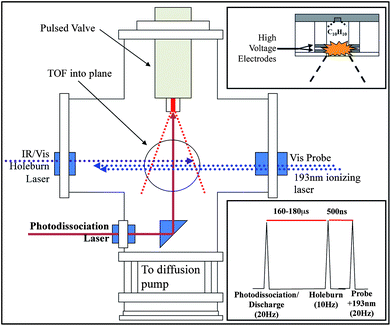 | ||
| Fig. 1 Schematic of the ion-source region of the time-of-flight spectroscopy chamber showing photodissociation setup and (upper right) cutaway of the interchangeable discharge source and (lower right) timing diagram for photodissociation/discharge setups. | ||
The benzylallenyl radical was created by photolysis of benzylallene. The output from a frequency-doubled, Nd:YAG-pumped dye laser was directed into the aforementioned reaction channel and timed to interacted with the gas pulse just prior to final expansion and cooling (Fig. 1). It was found that a photolysis wavelength of 266.745 nm, which is resonant with the S0–S1 origin of benzylallene, produced the benzylallenyl radical most efficiently of the UV wavelengths tested. The radical could also be produced via electric discharge of the gas pulse, but photolysis yielded about ten times the signal.
Once the RSR of interest was generated, it was cooled by expansion from the reaction tube into the ion source region of a time-of-flight mass spectrometer.12 The radicals were detected using two-color, resonant two-photon ionization (2C-R2PI) spectroscopy. The fundamental of a Nd:YAG-pumped dye laser was tuned through the excitation spectrum of the species of interest in the visible. The output of an ArF-excimer laser at 193 nm was used as the second photon, ionizing the molecule out of the excited electronic state. The ionized molecule was mass-analyzed viatime-of-flight methods, producing a mass-resolved, visible excitation spectrum of the radical. Varying the delay between the probe laser and the ionization laser allowed for the determination of the excited-state lifetimes of the radicals. Rotation band contours (RBCs) were also collected by scanning the probe laser over the origin of the molecule at a higher resolution (∼0.04 cm−1).
In order to determine the adiabatic ionization threshold of the radicals, two-color, photoionization efficiency (2C-PIE) scans were carried out. To do so, the probe laser mentioned above was tuned to the D0–D1 origin of the radical. The tuneable output of a frequency double dye laser was used as the second photon. The ion signal was monitored as the ionization laser was scanned to look for the turn-on of ion signal. The initial turn-on of ion signal is taken to be the IP of the molecule.
Conformation specific spectra were collected using visible–visible holeburning (VHB) spectroscopy. A holeburning laser, tuned to a transition in the R2PI spectrum, was spatially overlapped with the probe and ionization lasers and fired ∼500 ns prior in time at 10 Hz. The probe laser at 20 Hz was then tuned through the spectrum and the difference in probe laser ion signal between laser shots with and without the holeburn laser was collected using active baseline subtraction. If the probe laser is tuned through a transition that shares the same ground state as the holeburn laser, the ion signal from the probe laser is depleted, allowing for the collection of conformation specific spectra.
The ground-state CH stretch infrared spectrum of the radicals was collected using resonant ion-dip infrared spectroscopy (RIDIRS). The setup is similar to that used in VHB, only the output from a Nd:YAG pumped LaserVision OPO/OPA system is used in place of the holeburn laser. The probe laser was then set to the electronic origin of the radical and the IR laser was scanned over the region from 2900 to 3200 cm−1. When the IR laser was resonant with a transition of the radical, the ion signal from the probe laser dipped. Monitoring the signal depletion vs. IR wavelength gave the spectrum of the radical in the CH stretch region.
Computational methods
Geometry optimizations of local minima were carried out using Gaussian 09.13 Ground state (DFT) and excited state (TDDFT) optimizations were carried out using the B3LYP14 functional with a 6-311+G** basis set. Vibrational frequency calculations were carried out at the same level of theory for use in spectral assignments. Resolution-of-identity (RI) coupled cluster CC2 model15,16 was used to calculate geometries and force-fields of the D0 and first two excited doublet states of benzylallenyl radical. RI-CC2 calculations were run using the cc-pVDZ basis set using TURBOMOLE version 5.7.17,18Rotational band contours were simulated according to previous methods using JB954,19 and compared to experimental spectra.
Results and analysis
Calculated structures and vibrational frequencies
Optimized structures for the ground electronic state (D0), first excited state (D1) and ion of trans-1-phenylallyl radical are shown in Fig. 2a, calculated at the DFT (D0, S0 ion) and TDDFT (D1) levels of theory. The radical is calculated to be planar in both the D0 and D1 states of the neutral and the ground state ion. Furthermore, the geometry changes upon electronic excitation or ionization are rather small. Most significant changes involve C(phenyl)–C(α) and C(β)–C(γ) bonds, which are more nearly equal in length in the excited state, with a shortening of the former bond and lengthening of the latter relative to the ground state. The corresponding structural data for the cis-1-phenylallyl isomer are included in the supplementary material.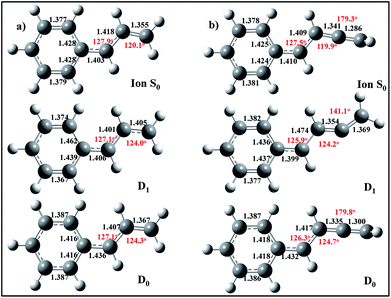 | ||
| Fig. 2 Ground state (D0), excited state (D1) and ground state ion (So) geometries for (a) trans-1-phenylallyl and (b) trans-benzylallenyl radicals (B3LYP/6-311+G(d,p)). | ||
Table 1 lists the calculated low-energy frequencies for the D0 and D1 states of trans-1-phenylallyl radical. Vibrational numbering in the table and figure uses the Mulliken numbering scheme, with vibrations 1–33 in-plane (a′) vibrations and 34–48 out-of-plane (a′′) vibrations.20 Comparison of the vibrational frequencies in D0 and D1 states shows very little change in the frequencies of most vibrations, particularly the low frequency vibrations of most direct interest here. A complete table of frequencies can be found in the supplementary material.
| Phenylallyl | Benzylallenyl | ||||||
|---|---|---|---|---|---|---|---|
| Mode | D0 (DFT) | D1 (TDDFT) | D1 (Expt) | Description | Mode | D0 (DFT) | Dn (Expt) |
| a Varsanyi notation.21 | |||||||
| A′ | A′ | ||||||
| ν 24 | 1100 | 1023 | 1035 | ν 23 | 1099 | ||
| ν 25 | 1044 | 1000 | 999 | ν 24 | 1057 | ||
| ν 25 | 1039 | ||||||
| ν 26 | 1008 | 971 | CH bend | ν 26 | 999 | ||
| ν 27 | 990 | 947 | 936 | Ring breath | |||
| ν 27 | 886 | 917 | |||||
| ν 28 | 834 | 799 | 793 | Allyl bend | ν 28 | 858 | |
| ν 29 | 630 | 614 | 598 | Phenyl 6aa | ν 29 | 634 | 736 |
| ν 30 | 624 | 567 | 574 | Phenyl 6ba | ν 30 | 626 | 655 |
| ν 31 | 413 | 410 | 401 | C2–C1–Ca bend | ν 31 | 509 | 502 |
| ν 32 | 377 | ||||||
| ν 32 | 360 | 344 | 339 | Allyl bend | ν 33 | 230 | 238 |
| ν 33 | 158 | 156 | 156 | Allyl wag | ν 34 | 103 | 103 |
| A′′ | A′′ | ||||||
| ν 44 | 497 | 414 | 400 | ν 46 | 495 | ||
| ν 45 | 410 | 394 | 382 | ν 47 | 410 | ||
| ν 48 | 297 | ||||||
| ν 46 | 254 | 212 | 208 | ν 49 | 226 | ||
| ν 47 | 134 | 144 | 142 | Styryl torsion | ν 50 | 100 | 86 |
| ν 48 | 89 | 84 | 81.5 | C1–Ca bend | ν 51 | 70 | 70 |
The optimized ground state of benzylallenyl has A′′ symmetry, with the structure shown in Fig. 2b. The radical is heavy-atom planar, with the allenyl carbons linear and the hydrogens of the terminal CH2 group perpendicular to the heavy-atom plane, as they would be in allene. This renders the two sets of π orbitals perpendicular to one another, suggesting the presence of π-type electronically excited states with similar character to those in the phenylallyl radical. However, the optimized structure for the D1 state is an A′ state with a trans-bent C4 chain and the radical center a σ-type radical on the γ-carbon. The terminal CH2 group is now in a planar configuration. Careful searches for a minimum near the D0 minimum geometry, with CH2 group perpendicular, yielded only a transition state with a single imaginary frequency of 425i due to the terminal CH2 twist, leading to the planar minimum. This transition state on the D1 surface is located 0.5 eV above the planar minimum. The ground state of the ion (Fig. 2b) once again has a linear allenyl chain and perpendicular terminal CH2 group.
Table 1 also includes the calculated ground state vibrational frequencies for benzylallenyl radical, there compared with the phenylallyl radical. Further consideration of the structures and vibrations of benzylallenyl will be left until after the experimental data has been introduced.
2C-R2PI and VHB spectra
Fig. 3a presents an overview 2C-R2PI scan of the m/z 117 discharge product in a 2% 1-phenylpropene (β-methylstyrene) in Ar mixture. This discharge product involves loss of a single H-atom from the precursor. The electronic origin transition at 19208 cm−1 is consistent with attribution to the 1-phenylallyl radical based upon previous studies of related systems.3–6 The 1-phenylallyl radical could also be produced via discharge of 3-phenylpropene; however, the 1-phenylpropene precursor gave approximately six times more signal than 3-phenylpropene, which instead produced benzyl radicals in high concentration. These benzyl radicals were formed by breaking the Cα–Cβ bond in 3-phenylpropene, which is not available as a dissociation pathway in 1-phenylpropene. A similar preference was observed in radical studies of α-methylbenzyl radical by the Lee group, where precursors having a Cα–Cβ bond that is weaker than the Cα–H bond were used to produce the radical.22 In the present case, by having the vinyl group conjugated with the phenyl ring, the discharge more selectively loses the terminal hydrogen to give the radical of interest.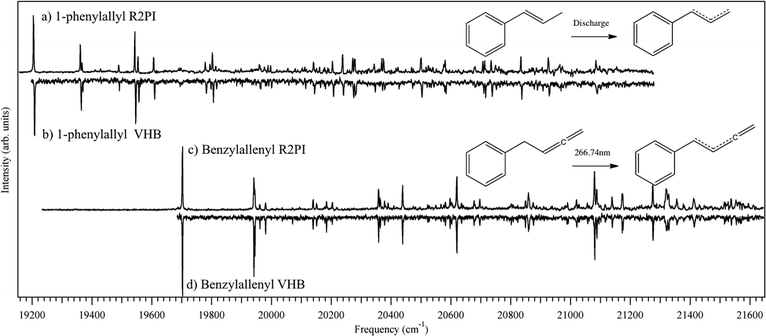 | ||
| Fig. 3 (a) 2C-R2PI and (b) VHB of 1-phenylallyl radical from discharge of 1-phenylpropene. (c) 2C-R2PI and (d) VHB of benzylallenyl radical from photodissociation of benzylallene at 266.74 nm. | ||
The 1-phenylallyl radical shows strong Franck–Condon activity that continues for almost 2000 cm−1 above the electronic origin. This spectrum is similar to that obtained concurrently by Troy et al., published in the adjoining article.9 As noted in the introduction, the 1-phenylallyl radical can exist in both cis and trans isomeric forms, with a calculated energy difference of 1.7 kJ mol−1 favoring the trans isomer. In order to check for the possible presence of transitions due to both isomers, a visible-visible holeburning (VHB) spectrum was recorded with holeburn laser fixed on the electronic origin at 19208 cm−1. This spectrum is shown directly below the 2C-R2PI spectrum in Fig. 3b. Careful comparison between the two shows that all significant vibronic transitions burn together, indicating that they share the same ground state level, and thereby proving that they all belong to a single isomer.
Fig. 4a shows an expanded view of the first 1100 cm−1 of the 2C-R2PI spectra of phenylallyl radical. The intensities of vibronic transitions in this spectrum relative to that in the LIF spectrum from Schmidt and co-workers indicate that the vibronic transitions in Fig. 4a are partially saturated.9 The assignments put forward here employ only even overtones and combination bands of the out-of-plane vibrations, proving that the 1-phenylallyl radical is planar in both D0 and D1 states. All assignments in the first 500 cm−1 are made on the basis of correspondence between experiment and theory within a few cm−1, lending confidence to the predictive capability of the calculations. On this basis, assignments are made to the ten lowest frequency in-plane fundamentals (ν24–33). Without further experimental data linking excited and ground state frequencies (e.g., from dispersed fluorescence spectra), the assignments of the higher frequency transitions must be considered tentative. The strong vibronic transitions 156 and 339 cm−1 above the origin are assigned to the two lowest frequency in-plane fundamentals corresponding to the allyl wagging (3310) and bending (3210) modes respectively. The weak side band at 000 + 163 cm−1 is the first overtone of the lowest frequency out-of-plane mode (4820) involving the bending of the molecule about the C1–Cα bond. The ν30 and ν29 vibrations are in-plane phenyl ring distortions identified as 6b and 6a, respectively, in Varsanyi notation.21 The tentative assignments of these fundamentals in Fig. 4a) occur in the midst of a clump of transitions in the frequency region where these vibrations are predicted to occur, and is consistent with the pervasive presence of these bands in π–π* transitions of aromatic derivatives.
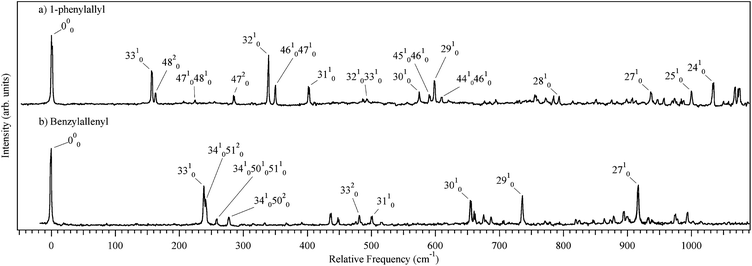 | ||
| Fig. 4 Expanded view of (a) 1-phenylallyl and (b) benzylallenyl radicals with selected vibronic transitions labeled. | ||
This vibronic analysis lends considerable support to an assignment of the observed spectrum to the trans-1-phenylallyl radical. By comparison, the calculated vibrational frequencies of cis-1-phenylallyl are a much poorer match with experiment (see ESI†). In addition, DFT and TDDFT calculations predict non-planar geometries for the cis isomer in both D0 and D1, so fundamentals of all vibrations would be allowed and should be observable
Fig. 3c and d show the analogous 2C-R2PI and visible–visible holeburning spectra of the benzylallenyl radical, appearing in the m/z 129 mass channel in the TOF mass spectrum. As mentioned previously, the benzylallenyl radical was generated from benzylallene by photolysis via its S0–S1 origin. The spectrum shows striking similarities to that of 1-phenylallyl above it. Its electronic origin appears at 19703 cm−1 (507.54 nm), 495 cm−1 blue shifted from the origin of 1-phenylallyl. Strong vibronic activity is also observed here, with intensities somewhat greater than in phenylallyl in several transitions. Again, VHB was used to look for the presence of multiple conformers, but as with the phenylallyl radical, only one isomer was observed.
The expanded view of the 2C-R2PI spectrum in Fig. 4b is shown on a relative frequency scale that enables its direct comparison with the spectrum of the phenylallyl radical above it. In many ways, the spectrum of the benzylallenyl radical mirrors that of phenylallyl, with its electronic origin transition dominating the spectrum, arguing against any large geometry change accompanying electronic excitation. Notably, the D0–D1 transition is predicted by calculations to have a large geometry change in both the carbon skeleton and terminal CH2 group (Fig. 2b). Furthermore, the D0–D1 transition is calculated to be very weak, and its vibronic transitions will be spread over a large wavelength range due to the large geometry change between the two states. Since the experimental data indicate the presence of a minimum in the excited surface near the ground-state geometry (similar to that present in phenylallyl), there is a clear discrepancy between experiment and the predictions of calculations for the D0–D1 transition, a point to which we will return shortly. It is worth noting that similar competition between σ- and π-type radical structures are found in substituted vinyl radicals (H2C![[double bond, length as m-dash]](https://www.rsc.org/images/entities/char_e001.gif) Ċ–R), with the calculated minimum structure depending on the level of theory used.23 As a result of these inconsistencies in excited state ordering, the observed excited state is referred to in what follows simply as Dn, until the excited states are considered further in the light of calculations in the discussion section.
Ċ–R), with the calculated minimum structure depending on the level of theory used.23 As a result of these inconsistencies in excited state ordering, the observed excited state is referred to in what follows simply as Dn, until the excited states are considered further in the light of calculations in the discussion section.
Close inspection of the observed vibronic structure indicates that much of the vibronic structure can be assigned simply by assuming that the excited state frequencies are close to those in the ground state, much as occurs in the phenylallyl radical. In Fig. 4b, several of the vibronic bands have been assigned this way. Table 1 lists the frequencies of benzylallenyl radical, with the table structured so that modes that are equivalent in form between benzylallenyl and phenylallyl radical paired horizontally. Notably, the ground state frequencies provide a nice match for both the in-plane fundamentals and combination bands involving out-of-plane modes. A prominent progression in a 240 cm−1 mode is assigned a 33n0 progression involving a CCC bend that is the analog of ν33 in trans-phenylallyl (156 cm−1 in that case). In addition, the transitions at 241, 259 and 277 cm−1 are assigned to a triad of transitions (34105120, 341050105110 and 34105020) that involve only even combinations of the out-of-plane modes. This argues strongly for retention of planarity in an A′′ → A′′ transition. These transitions likely gain oscillator strength by anharmonic coupling of the upper state levels with 331, with which they are in close proximity. As with 1-phenylallyl, the cis isomer is predicted to be non-planar in the excited state at all levels of theory tested, which would allow for fundamentals of all vibrations to be visible. In order to strengthen and extend the assignments in Fig. 4, dispersed fluorescence data are still needed.
Photoionization efficiency scans
Fig. 5a shows a photoionization efficiency scan recorded with the resonant laser fixed on the D0–D1 origin transition of 1-phenylallyl. A sharp threshold for ionization is observed at 6.905 ±.002 eV. Estimation of the effects of the electric field in lowering the observed threshold showed them to be less than 0.002 eV (20 cm−1).24 This value of ionization potential is in excellent agreement with the measurement of Troy et al.9 The sharp vertical threshold indicates that the geometry of the ion is similar to that in the D1 excited state, as predicted by the calculations. Since the D0–D1 origin is the most intense band in the vibronic spectrum, we deduce that all three states (D0 and D1 states of the neutral and the ground state of the ion) have similar structures. The experimental IP is also in close agreement with the calculated value of 6.811 eV for trans-1-phenylallyl radical. The corresponding value for the cis isomer (6.980 eV) is also in close proximity, so that the IP measurement alone cannot distinguish cis from trans isomers.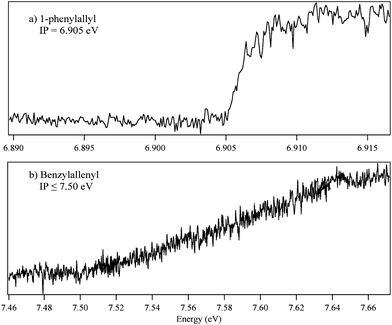 | ||
| Fig. 5 Two-color photoionization scans of (a) 1-phenylallyl and (b) benzylallenyl radicals. 1-phenylallyl shows a sharp turn on at 6.905 eV indicative of a small geometry change upon excitation. The long build of benzylallenyl from 7.50 to 7.64 eV implies a large structure change between Dn and the ion. | ||
Fig. 5b presents the analogous PIE scan of the benzylallenyl radical, again using the D0–Dn origin transition as intermediate state. The long slow rise in signal from 7.50 to 7.64 eV reflects a major geometry change between Dn and ion states. As a result, it is likely that the onset near 7.50 eV is not the adiabatic ionization threshold, especially given the fact that it is ∼0.6 eV higher than its parent radical phenylallyl. Thus, the observed onset at 7.50(5) eV must be considered an upper bound to the IP for the benzylallenyl radical.
Rotational band contours and excited state lifetimes
In order to provide additional insight to the nature of the excited states involved, and provide further evidence for the isomer observed, rotational band contours of the origins of the two radicals were recorded (Fig. 6). In the figure, the experimental contour for phenylallyl is compared with the contour predicted using rotational constants and transition dipole moment directions from DFT/TDDFT calculations of the ground state and excited states, as summarized in Table 2. The calculated TDM directions for both conformers of 1-phenylallyl radical are very similar, resulting in nearly identical simulated rotational band contours making it difficult to glean insight as to which conformer is present. No corresponding analysis of the benzylallenyl radical was attempted due to the calculation's inability to locate an excited state minimum near the ground-state geometry. Nevertheless, the TDM direction appears to be similar to that in the phenylallyl spectrum, consistent with an 2A′′ → 2A′′ transition.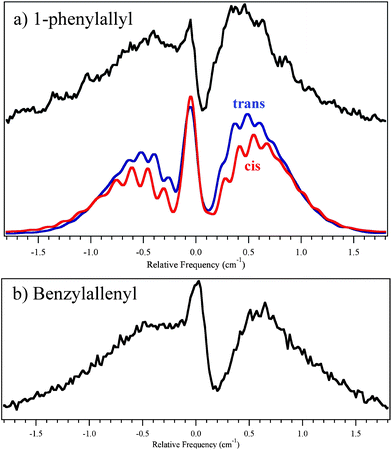 | ||
| Fig. 6 Rotational band contours of (a) 1-phenylallyl and (b) benzylallenyl. Experimental traces (black) were fit for cis-1-phenylallyl (red) and trans-1-phenylallyl (blue) using JB95.19 Ground-state rotational constants were taken from B3LYP/6-311+G(d,p) calculations. Excited state rotational constants and transition dipole moments were taken from TDDFT B3LYP/6-311+G(d,p). | ||
Table 3 presents the lifetimes of the origins of phenylallyl and benzylallenyl radicals compared to several other RSRs. The excited state lifetimes (63 ns for phenylallyl and 121 ns for benzylallenyl) are similar to those observed for the 1- and 2-hydronaphthyl radicals that are of similar nature.4
| Radical | D0–D1/cm−1 | IP/eV | Lifetime/ns |
|---|---|---|---|
| a Ref. 3. b Ref. 9. c Ref. 5. d Ref. 8. e Ref. 25. f Ref. 26. g D2 origin (see text for further discussion). | |||
| 1-Hydronaphthyl a | 18949 | 6.570 | 36 |
| trans-1-Phenylallyl | 19208 | 6.905 | 63 |
| 2-Hydronaphthyl a | 19363g | 6.487 | 58 |
| Inden-2-ylmethyl b | 19365 | 6.737 | 120 |
| trans-Benzylallenyl | 19703g | ≤7.51 | 121 |
| 1-Phenypropargyl c | 21007 | 7.4f | 350 |
| 1-Indanyl d | 21159 | 6.578 | ∼1000 |
| 1,2,3-Trihydronaphthyl a | 21372 | 6.620 | 820 |
| Benzyl e | 22000 | 7.242 | 1860 |
D0-RIDIRS in the CH stretch region
An alternative away to distinguish the trans and cis isomers is via their ground-state infrared spectra. RIDIR spectra of the phenylallyl and benzylallenyl radicals in the CH stretch region (2900–3200 cm−1) are shown in Fig. 7a and b, respectively. The figure includes a comparison with the predictions of the DFT B3LYP 6-311+G(d,p) calculations, scaled by 0.959 and 0.964 in order to line up the most intense calculated and experimental CH stretch transitions for phenylallyl and benzylallenyl radicals respectively. The match between experiment and that calculated for the trans-1-phenylallyl radical is remarkably good, and significantly better than the cis isomer, further strengthening the assignment of the observed spectrum to the trans isomer.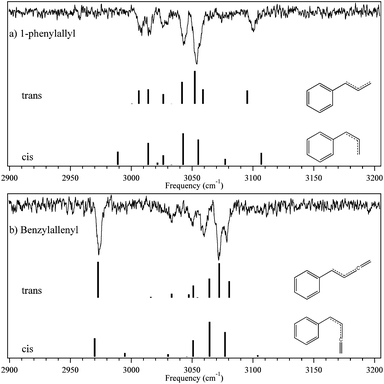 | ||
| Fig. 7 D0-RIDIR spectra for the CH stretch region of (a) 1-phenylallyl and (b) benzylallenyl radicals. Simulated frequencies were calculated using B3LYP/6-311+G(d,p). Frequencies were scaled by 0.959 for 1-phenylallyl and 0.964 for benzylallenyl for best fit of the higher intensity bands. | ||
Similarly, in benzylallenyl, the experimental RIDIR spectrum is also fit best by the trans isomer; however, in this case less definitively so. Nevertheless, in light of the assigned vibronic structure in the 2C-R2PI spectrum and the calculated energetic preference for trans over cis isomers, we tentatively assign the observed spectrum to the trans-benzylallenyl isomer.
Discussion
A summary of properties of 1-phenylallyl and benzylallenyl radicals is presented in Table 3. Also included in the table are the properties of several related radicals that have been the subject of recent studies.3–6,8,25 The D0–D1transition in trans-1-phenylallyl is a π–π* transition like that found in many closed-shell aromatics and RSRs. Modest geometry changes lead to Franck–Condon factors that favor the 000 transitions above all others. Benzyl radical is a notable exception, where vibronic coupling influences the vibronic intensities in the D0–D1 transition.25 The large intensity of the ν32 (allyl bending) and ν33 (allyl wagging) fundamentals in the trans-phenylallyl radical spectrum (Fig. 4a) is indicative of a geometry change involving the allyl moiety, as reflected in the CC bond length changes (Fig. 2). The sharp ionization threshold of trans-1-phenylallyl is evidence of a small geometry change upon ionization.While the cis isomer was not observed in the present work, it would be worthwhile to pursue characterization of its spectroscopy in future studies, especially because its structure is better poised for ring closure than the trans isomer. It may also be that the cis conformer has a low barrier to ring closure to form indene, making it an important intermediate when considering processes that take place in environments like Titan's atmosphere. On the other hand, it also seems plausible that the D1 excited state of the cis radical could undergo fast isomerization over a low barrier back to the trans well, much as occurs in cis-stilbene, shortening its lifetime and limiting the ability to observe it.
The benzylallenyl radical is also an RSR of some note. The spectra recorded in this work show a close similarity with those of the phenylallyl radical and many of the other RSRs studies to date. However, aspects of the excited and ion states are still rather puzzling, calling for further work. Fig. 8 presents energy level diagrams for the trans-phenylallyl and trans-benzylallenyl radicals. From the 2CR2PI (Fig. 3c) and the PIE scan (Fig. 5b), we surmise that there is a small geometry change upon D0–D1 excitation, but a large geometry change between the D1 state and the ion. In contrast, calculations predict a large geometry change for both steps, with the terminal hydrogens rotating from perpendicular to planar upon photo-excitation and then back to perpendicular when ionized. Careful searches for a minimum on the D1 surface near the ground state (perpendicular) structure were unsuccessful both at the TDDFT and RI-CC2 levels of theory. It may be that the observed transition is not D0–D1but rather D0–D2. Furthermore, TDDFT optimization of the D2 state led to a surface crossing with the D1 state. However, when D2 is optimized using coupled cluster theory (RI-CC2/cc-pVDZ), a local minimum is found with similar geometry to that of the ground state, with a calculated D0–D2 origin at 24259 cm−1 (2.947 eV). At this geometry, the D1 and D2 states are separated by less than 0.05 eV, with the D2 state carrying an oscillator strength from D0 which is 7.5 times greater than that for the D0–D1 transition. CC2 frequencies for D2 match closely with those predicted for the ground state, and lead to similar assignments for the observed vibronic structures to those obtained using the D0 frequencies. A summary of the D2 frequencies of relevance to this work is included in the ESI†. At these levels of theory, it is difficult to come to a firm conclusion whether this is a case where the calculations have incorrectly ordered the D1 and D2 states, or if the observed state is indeed D2. In an effort to look for weak bands associated with a lower excited state, the R2PI of benzylallenyl radical was scanned almost 2000 cm−1 red of the observed origin. No transitions were observed.
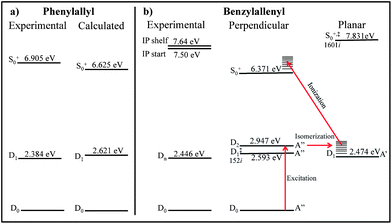 | ||
| Fig. 8 Experimental and calculated energy levels for (a) 1-phenylallyl and the two geometries of (b) benzylallenyl radicals. The red arrows show the proposed path from D0 of benzylallenyl radical to S0 of the ion. Energies of phenylallyl and S0 of benzylallenyl were calculated at TD/B3LYP/cc-pVDZ level of theory, while the doublet states of benzylallenyl were optimized using RI-CC2/cc-pVDZ in TURBOMOL. +Ion state, ‡Transition state. The imaginary frequencies (XXXi) correspond to torsion of the terminal hydrogens of the allene moiety. | ||
Nevertheless, it is possible to explain the observed data using the CC2 results. The observed spectrum of benzylallenyl, shows that the molecule is being excited to a state with similar geometry, be it D1 or D2. While excited, the molecule may be able to interconvert to the planar D1 minimum. The measured excited state lifetime would then be that of the D1 planar structure after isomerization. This excited state isomerization to a planar geometry would account for the slow onset in the PIE scan, since the ion ground state is predicted to be a perpendicular structure. In this scenario, 7.50 eV is not the adiabatic threshold, but rather an upper bound to the IP. If this isomerization is occurring, the timescale must be slow enough not to wash out the observed structure in the rotational band contour in Fig. 6b (>50 ps). This proposed pathway is shown in Fig. 8b. The dynamics of this radical is the subject of current studies as the isomerization to a σ-type radical in the excited state may initiate ring closing mechanisms leading to the formation of indene and/or naphthalene.11
Conclusions
Both 1-phenylallyl and benzylallenyl radicals have properties very similar to the other RSRs listed in Table 3. Both have absorptions close to those of 1- and 2-hydronaphthyl radicals around 500–530 nm. trans-1-Phenylallyl radical is shifted only 255 cm−1 to the blue of 1-hydronaphthyl radical, which could be considered a restricted form of cis-1-phenylallyl radical. The lifetime and IP of trans-1-phenylallyl radical is also similar to that of the mono-hydronaphthyl radicals as would be expected.An important feature shared by all the radicals in this family is that they are all RSRs and are thus more stable than their non-resonantly stabilized counterparts. This extra stability is postulated to allow them to build up in concentration in environments like Titan's atmosphere, leading to formation of more complex molecules through recombination reactions. Current studies in our laboratory are underway investigating the importance of benzylallene and benzylallenyl radical in the photochemical formation of naphthalene in Titan's atmosphere.
Acknowledgements
The authors gratefully acknowledge funding from NASA Planetary Atmospheres program under grant NNX10AB89G. We also thank Dr Talitha Selby for synthesizing benzylallene. The RIDIR scans of the two radicals were recorded with support from DOE Basic Energy Sciences, Division of Chemistry, under grant DE-FG02-96ER14656.References
- J. J. Newby, J. A. Stearns, C. P. Liu and T. S. Zwier, J. Phys. Chem. A, 2007, 111, 10914–10927 CrossRef CAS.
- J. A. Miller and S. J. Klippenstein, J. Phys. Chem. A, 2001, 105, 7254–7266 CrossRef CAS.
- J. A. Sebree, V. V. Kislov, A. M. Mebel and T. S. Zwier, Faraday Discuss., 2010, 147, 231–249 RSC.
- J. A. Sebree, V. V. Kislov, A. M. Mebel and T. S. Zwier, J. Phys. Chem. A, 2010, 114, 6255–6262 CrossRef CAS.
- N. J. Reilly, D. L. Kokkin, M. Nakajima, K. Nauta, S. H. Kable and T. W. Schmidt, J. Am. Chem. Soc., 2008, 130, 3137–3142 Search PubMed.
- N. J. Reilly, M. Nakajima, B. A. Gibson, T. W. Schmidt and S. H. Kable, J. Chem. Phys., 2009, 130.
- N. J. Reilly, M. Nakajima, T. P. Troy, N. Chalyavi, K. A. Duncan, K. Nauta, S. H. Kable and T. W. Schmidt, J. Am. Chem. Soc., 2009, 131, 13423–13429 Search PubMed.
- T. P. Troy, M. Nakajima, N. Chalyavi, R. Clady, K. Nauta, S. H. Kable and T. W. Schmidt, J. Phys. Chem. A, 2009, 113, 10279–10283 Search PubMed.
- T. P. Troy, N. Chalyavi, A. S. Menon, G. D. O'Connor, B. Fückel, K. Nauta, L. Radom and T. W. Schmidt, Chem. Sci., 2011, 2 10.1039/c1sc00247c (accompanying paper).
- F. Zhang, X. Gu, Y. Guo and R. I. Kaiser, J. Phys. Chem. A, 2008, 112, 3284–3290 CrossRef CAS.
- J. A. Sebree, N. Kidwell, B. Amberger, T. Selby, R. McMahon and T. S. Zwier, unpublished work.
- W. C. Wiley and I. H. McLaren, Rev. Sci. Instrum., 1955, 26, 1150–1157 CAS.
- M. J. Frisch, G. W. Trucks, H. B. Schlegel, G. E. Scuseria, M. A. Robb, J. R. Cheeseman, G. Scalmani, V. Barone, B. Mennucci, G. A. Petersson, H. Nakatsuji, M. Caricato, X. Li, H. P. Hratchian, A. F. Izmaylov, J. Bloino, G. Zheng, J. L. Sonnenberg, M. Hada, M. Ehara, K. Toyota, R. Fukuda, J. Hasegawa, M. Ishida, T. Nakajima, Y. Honda, O. Kitao, H. Nakai, T. Vreven, J. A. Montgomery, Jr., J. E. Peralta, F. Ogliaro, M. Bearpark, J. J. Heyd, E. Brothers, K. N. Kudin, V. N. Staroverov, R. Kobayashi, J. Normand, K. Raghavachari, A. Rendell, J. C. Burant, S. S. Iyengar, J. Tomasi, M. Cossi, N. Rega, J. M. Millam, M. Klene, J. E. Knox, J. B. Cross, V. Bakken, C. Adamo, J. Jaramillo, R. Gomperts, R. E. Stratmann, O. Yazyev, A. J. Austin, R. Cammi, C. Pomelli, J. Ochterski, R. L. Martin, K. Morokuma, V. G. Zakrzewski, G. A. Voth, P. Salvador, J. J. Dannenberg, S. Dapprich, A. D. Daniels, O. Farkas, J. B. Foresman, J. V. Ortiz, J. Cioslowski and D. J. Fox, GAUSSIAN 09 (Revision A.1), Gaussian, Inc., Wallingford, CT, 2009 Search PubMed.
- A. D. Becke, J. Chem. Phys., 1993, 98, 5648 CrossRef CAS.
- C. Hattig and F. Weigend, J. Chem. Phys., 2000, 113, 5154–5161 CrossRef CAS.
- O. Christiansen, H. Koch and P. Jørgensen, Chem. Phys. Lett., 1995, 243, 409–418 CrossRef CAS.
- R. Ahlrichs, M. Bar, M. Haser, H. Horn and C. Kolmel, Chem. Phys. Lett., 1989, 162, 165–169 CrossRef CAS.
- F. Weigend, A. Kohn and C. Hattig, J. Chem. Phys., 2002, 116, 3175–3183 CrossRef CAS.
- D. F. Plusquellic, R. D. Suenram, B. Mate, J. O. Jensen and A. C. Samuels, J. Chem. Phys., 2001, 115, 3057–3067 CrossRef CAS.
- R. S. Mulliken, J. Chem. Phys., 1955, 23, 1997–2011.
- G. Varsanyi, Assignments for Vibrational Spectra of 700 Benzene Derivatives, Wiley, New York, 1974 Search PubMed.
- G. W. Lee, H. G. Ahn, T. K. Kim and S. K. Lee, Chem. Phys. Lett., 2008, 465, 193–196 Search PubMed.
- T. P. M. Goumans, K. van Alem and G. Lodder, Eur. J. Org. Chem., 2008, 2008, 435–443 Search PubMed.
- M. A. Duncan, T. G. Dietz and R. E. Smalley, J. Chem. Phys., 1981, 75, 2118–2125 CrossRef CAS.
- M. Fukushima and K. Obi, J. Chem. Phys., 1990, 93, 8488–8497 CrossRef CAS.
- P. Hemberger, M. Steinbauer, M. Schneider, I. Fischer, M. Johnson, A. Bodi and T. Gerber, J. Phys. Chem. A, 2010, 114, 4698–4703 CrossRef CAS.
Footnote |
| † Electronic supplementary information (ESI) available. See DOI: 10.1039/c1sc00246e |
| This journal is © The Royal Society of Chemistry 2011 |

![[thin space (1/6-em)]](https://www.rsc.org/images/entities/char_2009.gif) :
: