Probing the structure of a water/nitrobenzene interface by scanning ion conductance microscopy†‡
Tianrong
Ji
,
Zhongwei
Liang
,
Xinyu
Zhu
,
Lingyu
Wang
,
Shujuan
Liu
and
Yuanhua
Shao
*
Beijing National Laboratory for Molecular Sciences, College of Chemistry and Molecular Engineering, Peking University, Beijing, 100871, P. R. China. E-mail: yhshao@pku.edu.cn; Fax: +86 (10) 6275 1708; Tel: +86 (10) 6275 9394
First published on 16th June 2011
Abstract
A new experimental approach to probe the structure of a water/nitrobenzene (W/NB) interface by scanning ion conductance microscopy (SICM) is presented. A nanopipette filled with aqueous solution serves as a SICM tip. The tip current is produced by the transfer of chloride (Cl−) and tetraphenylarsonium (TPAs+) ions between the aqueous solution inside the pipette and outer organic solution. The tip current increases instantaneously as a sign of touching the interface when such a tip approaches the W/NB interface. The continuous change of tip current suggests ion penetrations into the interfacial region which is less than 1 nm, in accordance with the mixed solvent model. Ion distribution information can also be extracted from the current–distance (approach) curves obtained from solutions with a series of electrolyte concentrations. The experimental results show that the SICM approach curves are sensitive to the thickness of diffuse layers. This type of technique is actually a modified version of SICM, and is similar to the operation of ion transfer mode of scanning electrochemical microscopy (SECM) with a SICM instrumentation.
Introduction
An interface between two immiscible electrolyte solutions (ITIES) has played a central role in the investigations of a wide variety of chemical, physical, and biological processes, such as charge (electron and ion) transfer reactions, phase transfer catalysis, solvent extraction and drug delivery.1–5 The physical nature of the interface is of fundamental importance for these processes, whose kinetics and thermodynamics are strongly dependent upon the interfacial structure. As a result, a detailed knowledge of the distributions of solvent molecules and ions near an interface has attracted more attention lately. Many experimental techniques and computational methods have been developed to gain some insights into molecular level understanding of the interfaces during the past few decades. However, in spite of considerable efforts, the structure of interfaces is still a matter of debate.There are essentially two views about the interfacial structure. One suggests that there is a molecularly sharp interface containing a compact layer formed by oriented solvent dipoles. The other postulates the interface is a mixed solvent layer into which ions of both phases can penetrate. Gavach et al. have proposed that the interface is sharp with a compact layer free of ions, separating two back to back double layers.6 This concept was known as the modified Verwey–Niessen model (MVN), which was supported by Kakiuchi and Senda based on either interfacial tension or relative surface excess measurements.7,8 Samec et al. extended this model by taking account of ion penetration and image force.9 However, Girault and Schiffrin contested the existence of a compact inner layer. Instead, they suggested a mixed solvent interfacial region with continuously changing composition, particularly concentration of ions, from one medium to the other.10–12 In addition, a series of impedance studies found that interfacial capacitance measured at low electrolyte concentrations was much larger than the value yielded from the Gouy–Chapman theory, and was dependent on the nature of ions, electrolyte concentrations and potential.13–17 This deviation was interpreted as ion-pair formation at the mixed solvent interfacial region, dependent on the ionic radius and Gibbs energy of transfer.
Besides electrochemical measurements, several optical spectroscopic techniques have been used to probe the structures of liquid/liquid interfaces. Time-resolved total-internal-reflection (TIR) fluorescence spectroscopy of a polarity probe adsorbed on different interfaces revealed the relationship between interfacial thickness/roughness and the polarity at a water/oil interface. As the polarity of oil increased, the interface became thick and rough.18,19 Vibrational sum-frequency (VSF) spectroscopy has arisen as an effective approach to probe the structure, orientation, and bonding of interfacial water. Results showed that a neat water/1,2-dichloroethane (W/DCE) interface had properties similar to a mixed solvent boundary, in contrast to the W/CCl4 and W/alkane interfaces which had characteristics of a sharp interface.20–23 In an earlier in situellipsometry study of a W/DCE interface, a mixed solvent layer was also proposed.24 The second harmonic generation (SHG) technique combined with a family of solvatochromic surfactants acting as ‘molecular rulers’ could give insight into interfacial thickness and molecular ordering at liquid/liquid interfaces.25–27 Quasi-elastic laser scattering (QELS) measurements both at the absence and presence of electrolytes have been employed to estimate the density and adsorption data at an interfacial region.28,29 Schlossman and co-workers have utilized X-ray scattering technique to predict the ion distributions near the W/NB interface electrified by a common ion.30,31 Based on their analysis, the interfacial liquid structure was important in determining interfacial ion distributions. By including a free energy profile in a generalized Poisson–Boltzmann equation, they predicted full ion distributions which agreed well with experimental measurements. In general, each technique has its own advantage, but they still have not reached a consensus in the interfacial structure.
The debate also appears in the theoretical community. Karaaslan32et al. and Benjamin33 have demonstrated that an interface is molecularly sharp by Monte Carlo and molecular dynamic simulations, respectively. In contrast, a lattice gas model, either treated within the quasi-chemical approximation15,16 or Monte Carlo simulations,34 yielded the interfacial capacity which could be explained in terms of a mixed solvent layer at the interface. This result was supported by further work of Urbakh and co-workers based on a modified non-linear Poisson–Boltzmann equation.35,36 The density functional approach37 could probably interpret the disagreement between different theories by taking into account the intermiscibility of two solvents. Under the condition that two solvents were totally immiscible, the same result of a narrow interfacial region would be predicted both by computer simulations and the lattice gas model.
The debate on the structure of a liquid/liquid interface partially results from a lack of high-resolution scanning techniques. Bard et al. have reported the preliminary study of the thickness of a W/NB interface by scanning electrochemical microscopy (SECM) with a Pt tip of 25 nm in radius.38 They estimated that the thickness of such an interface was less than 4 nm. Bard et al. also demonstrated in the first time that a micropipette could be used as a SECM tip39 and later on Shao and Mirkin proposed a new SECM operation mode based on ion transfer at an ITIES.40 The similar operation mode has also been used to study ion transfer across a bilayer lipid membranes41 and an ultrathin nanoporous silicon membrane42 by Amemiya and co-workers.
Scanning ion conductance microscopy (SICM)43 is one of the scanning probe microscopies utilizing a nanopipette filled with an electrolyte solution as a probe. By applying a bias potential between the electrode inside the pipette and the electrode in the bath solution, an ion current will be generated at the nanopipette tip which will serve as the feedback signal to control the distance between the tip and sample. Due to the high spatial resolution and non-contact characteristic, SICM has been widely employed to image living cells,44proteins45 and pore-suspending membranes.46 Compared with the SECM, SICM can control the position of the probe more precisely because of the improvement of instrumentation. Instead of constant-height mode which is most commonly conducted in SECM imaging, SICM maintains the tip at a fixed distance from the sample while scanning, greatly enhancing the spatial resolution. In addition, with the help of oscilloscope which monitors the z position of the pipette and tip current flowing through the pipette, the position of ITIES is much easier to be found, making SICM especially suitable for detecting ITIES with current–distance (approach) curves.
In this work, SICM was used as a novel technique to probe the microscopic structure of a W/NB interface at the presence of supporting electrolytes. A nanopipette filled with aqueous solutions served as a SICM tip, with Cl− and TPAs+ transfer at ITIES as feedback current. The current–distance curves were obtained by approaching the pipette toward the ITIES and recording the tip current as a function of the distance between the tip and ITIES. The shape of the curves could reflect the interfacial thickness and ion distributions near ITIES. This type of technique is actually a modified version of SICM, and is similar to the operation of ion transfer mode of scanning electrochemical microscopy (SECM) with a SICM instrumentation. Experimental data revealed that ions could penetrate into the interfacial region which is less than 1 nm, suggesting a continuous change of composition at the interface. With the approach step as small as 0.1 nm, ion distribution information could be extracted from the approach curves. The lower the electrolyte concentration is, the wider the diffuse layer will be.
Experimental
Chemicals
Tetraphenylarsonium chloride (TPAsCl, 97%), sodium tetraphenylborate (NaTPB, ≥99.5%), potassium tetrakis(4-chlorophenyl)borate (KTPBCl, ≥98.0%) and bis(triphenylphosphoranylidene)ammonium chloride (BTPPACl, ≥98.0%) were purchased from Aldrich. Lithium chloride (LiCl), potassium chloride (KCl), nitrobenzene (NB) and 1,2-dichloroethane (DCE) were obtained from Beijing Chemical Co. Dibenzo-18-crown-6 (DB18C6, ≥98%) was supplied by Alfa Aesar. All chemicals were analytical grade or better. DCE was washed several times with deionized water before use.Tetraphenylarsonium tetraphenylborate (TPAsTPB) was prepared by metathesis of equimolar solutions of TPAsCl and NaTPB, and bis(triphenylphosphoranylidene)ammonium tetrakis(4-chlorophenyl)borate (BTPPATPBCl) was synthesized the same way but with BTPPACl and KTPBCl solutions. The salts were recrystallized from acetone and then dried in an oven at 95 °C for 24 h. All aqueous solutions were prepared from triply distilled water.
Nanopipettes and electrochemical cells
A Model P-2000 laser puller (Sutter Instrument, USA) was used to fabricate the nanopipettes with an inner radius less than 10 nm from quartz capillaries (1 mm outer diameter, 0.7 mm inner diameter). The pulling program was developed to produce a long shank micropipette in order to minimize the perturbation to the interface caused by the movement of the pipette. The aqueous solution was filled from the back of the nanopipette using a 10 μL syringe. A 0.25 mm Ag silver wire coated with AgCl was inserted into each pipette from the back. Prior to measurements, all prepared pipettes were inspected using an Olympus BX-51 optical microscope (×100 to ×500 magnification) to ensure that no air bubbles were trapped inside.The configuration of the electrochemical cell40 used in the experiments is shown in Fig. 1. The right part of the glass cell was a 2.0 cm-diameter cylinder. A thin horizontal glass plate with a 1.0 cm-diameter aperture in the centre separated the top organic and bottom aqueous layers. The left part of the cell was a narrow tube (about 1 mm in inner diameter) filled with the same aqueous solution as the bottom layer in the wider cylinder. This tube could provide an extra supporting force for the top solution with relatively higher density than the bottom solution and thus yielded a stable ITIES. A two-electrode setup was employed with two 0.25 mm Ag wires. One coated with AgCl immersed in the solution inside the pipette served as an aqueous reference electrode, and the other coated with AgTPB served as an organic reference electrode in the top NB solution.
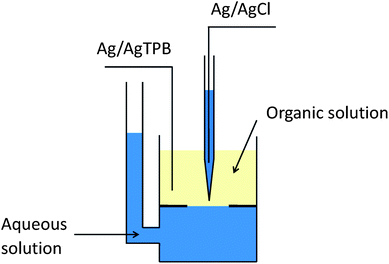 | ||
| Fig. 1 Schematic diagram of a SICM cell. The glass plate with an aperture separates and stabilizes the ITIES between top NB layer and bottom aqueous layer. The pipette is approaching the ITIES from NB phase. | ||
The two liquid phases in all experiments were equilibrated by gentle swirling by hand, and then the samples were kept for 2 h or more before measurements. The top phase contained 10−6 M to 10−3 M TPAsTPB in NB, and the bottom phase contained 10−4 M to 1 M LiCl in water. This cell was mounted on a vibration isolation table (Technical Manufacturing Corporation, U.S.A) and shielded in a Faraday cage.
Apparatus and measurements
SICM measurements were performed using a ScanIC scanning ion conductance microscope (Ionscope, London, U.K.). The pipette was biased at a potential sufficiently negative for Cl− to transfer from water to NB and TPAs+ to transfer reversibly. Before measurements, the tip electrode was positioned in the NB solution (top layer). The coordinate of the ITIES (z = 0) was determined from the sharp increase in tip current that occurred when the tip touched the ITIES. All experiments were carried out at room temperature (25 ± 2 °C). All precautions were considered in order to minimize the problem related to precisely control of the z direction position (see Electronic Supplementary Information, ESI for details†).Electrochemical measurements: Cyclic voltammograms were performed with a CHI 910B electrochemical workstation (CH Instruments, Inc., U.S.A).
Results and discussion
Characterization of the nanopipettes
To improve the vertical resolution as well as minimize the interfacial disturbance, we have prepared nanopipettes with a rather long shank and small orifice radius as SICM probes, and characterized them by optical microscope, electrochemical techniques and scanning electron microscope (SEM).Fig. 2 is the optical microscopic images showing the tips of two different pipettes. The long and thin shank of a nanopipette (Fig. 2A) could bring less perturbation while approaching the interface. It was different from a patch clamping pipette (Fig. 2B) with relatively thicker shank and larger orifice. The pipettes employed in SICM measurements were all of type (A).
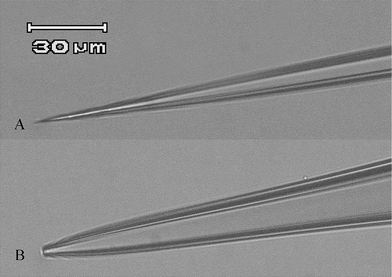 | ||
| Fig. 2 Optical microscopic images of different types of pipettes. (A) A pipette employed in SICM measurements; (B) a patch clamping pipette. (Scale bar = 30 μm). | ||
The electrochemical system based on the transfer of K+ from water to DCE facilitated by dibenzo-18-crown-6 (DB18C6) can be represented as Cell A:
| Ag | AgTPBCl | 2 mM BTPPATPBCl + 2 mM DB18C6 (outer DCE solution) ‖ 100 mM KCl (aqueous solution in pipette) | AgCl | Ag | (Cell A) |
Here BTPPATPBCl is a supporting electrolyte used to provide ionic conductivity to the organic phase. When the concentration of K+ inside the pipette is much larger than that of DB18C6 in DCE, the steady-state current is limited by the diffusion of crown ether to the tip. The empirical equation proposed by Girault et al.47 can be used to characterize the effective radius of a pipette:
| Iss = 3.35πnFDcr | (1) |
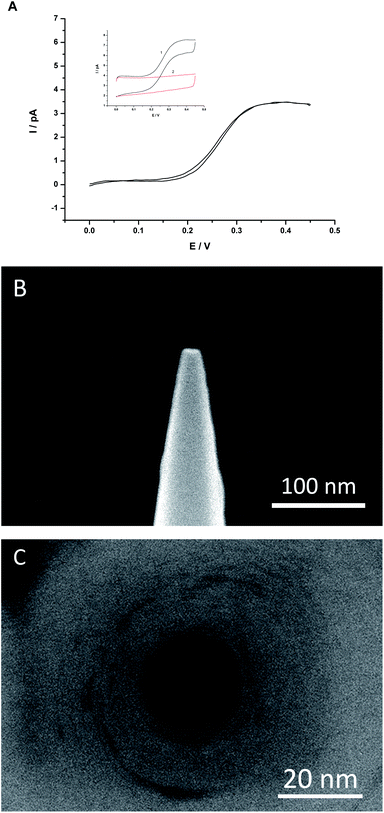 | ||
| Fig. 3 (A) The background-subtracted cyclic voltammogram of K+ transfer from water to DCE facilitated by DB18C6 using Cell A. The sweep rate was 50 mV s−1. (B) Side view SEM image of a nanopipette. (C) Top view SEM image of a nanopipette. | ||
The nanopipette was also characterized by SEM, either FEI XL-30 ESEM-FEG (Fig. 3B) or Hitachi S-4800 (Fig. 3C). Fig. 3B was the side view of a nanopipette with a half-cone angel of about 6° and an apparent outer diameter about 18 nm (including ∼5 nm-thick carbon coating). Supposing the outer/inner diameter ratio of the pipette was preserved during the pulling process, we estimated that the inner radius of the pipette orifice was less than 5 nm, which is more or less in good agreement with the value obtained electrochemically (see Fig. 3A and the ESI†). However, a nanopipette with this small orifice radius was quite difficult to visualize on top view (see the ESI†), so a relatively larger tip with an inner radius about 10 nm was shown in Fig. 3C.
Choosing the bias potential of SICM by voltammetry
In SICM measurements, the bias potential between two electrodes was set at a fixed value to make sure that the tip current was in an appropriate range. Given the asymmetric current–voltage response of quartz nanopipette, a negative potential was chosen as pipette bias. Fig. 4A shows the current rectification at a 5 nm-radius pipette with 0.1 M KCl solution both inside and outside. The currents at positive potentials were lower than the currents at corresponding negative potentials. Bard et al. have investigated this phenomenon at a 20 nm-radius pipette.48 They explained that the current rectification was caused by the negative charge of silanol groups at the quartz surface, which influenced the flow of ions through the orifice.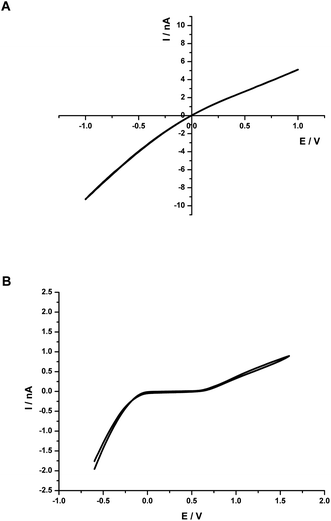 | ||
| Fig. 4 (A) Cyclic voltammogram of a nanopipette in 0.1 M KCl solution. (B) Cyclic voltammogram obtained at the interface: 1 mM TPAsTPB(NB) ‖ 10 mM LiCl(W). The sweep rates were 100 mV s−1. | ||
Similarly, as shown in Fig. 4B, an asymmetric cyclic voltammogram was obtained from the interface between a 10 mM aqueous solution of LiCl and a 1 mM organic solution of TPAsTPB with a nanopipette electrode. The electrochemical cell can be represented as Cell B:
| Ag | AgTPB | 1 mM TPAsTPB (outer NB solution) ‖ 10 mM LiCl (aqueous solution in pipette) | AgCl | Ag | (Cell B) |
Due to the negatively charged quartz surface and small size of the orifice, the current on the left side of potential window was much larger than that on the corresponding right side. As a result, the pipette bias was set at −0.6 V or −0.8 V vs.Ag/AgCl, negative enough for the transfer of aqueous Cl− ion to NB and the transfer of organic TPAs+ ion into aqueous phase simultaneously.
SICM approach curves
A SICM approach curve for a nanopipette filled with 10 mM LiCl aqueous solution approaching the W/NB interface is shown in Fig. 5. Top NB phase contained 1 mM TPAsTPB as supporting electrolyte and the bottom aqueous solution was the same as the solution inside the pipette. Positive horizontal coordinate corresponds to the pipette in NB, and negative coordinate means the pipette is in bottom aqueous solution. Compared to the work of Bard et al. performed with a 25 nm-radius Pt electrode, we chose the nanopipette as the tip to pass through the interface. On the one hand, the vertical resolution has been improved because of the adoption of smaller radius of the pipettes and the improvement of instrumentation. On the other hand, there was less perturbation caused by the movement of the tip due to its smaller size and longer shank. In addition, the outer/inner diameter ratio of a nanopipette was much smaller than that of an ultramicroelectrode, which made the entire top of pipette in nanometer size. This kind of pipette could approach the ITIES with much less disturbance but valuable information about the interfacial structure.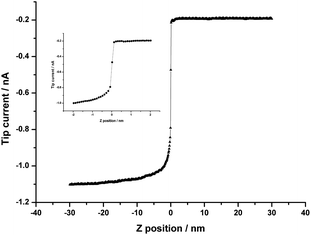 | ||
| Fig. 5 SICM approach curve for a nanopipette tip moving perpendicular to and through the W/NB interface: 1 mM TPAsTPB(NB) ‖ 10 mM LiCl(W). The tip potential was −0.6 V vs.Ag/AgCl. The inset shows details of the middle part of the approach curve (from −2 to 2 nm in z coordinate). Scan rate was 50 nm s−1. | ||
When the tip got close to the ITIES, the tip current increased gradually rather than decreased due to the ITIES-hindered ion diffusion near the tip, which reflected the increased concentration of TPAs+ close to ITIES. When the pipette touched the ITIES, the current increased instantaneously because a larger area (the diffusion field of the pipette which was in micrometer size) became available for ion transfer (see ESI for details†). After the tip traversed the ITIES, the solutions inside and outside the pipette became almost identical, and the external voltage was applied across the micrometer-sized ITIES. The gradually increasing current in bottom aqueous phase was caused by Cl− and TPAs+ transfer across the ITIES. As a result, the approach curve could be divided into three parts: the interfacial region where the current changed dramatically and the other two parts with gradual current change in adjacent phases.
The sudden change of the current at the W/NB interface indicates the asymmetry of the interface, which has been observed by other spectroscopic techniques.18–27 The cause of the sharp change of current is rather complicated. It might be from ion transfers at the W/NB interface, or charging current at the interface, or the dynamic transformation of a liquid/liquid interface into a single liquid phase. The dynamic effect should be in nanosecond scale and the experimental time scale is in millisecond to second range. It is hard to distinguish them. Since the diffusion field of the nanopipette is in about micrometer scale (see the ESI†), the probe moves near to the millimeter-sized interface and traverses it within this scale. The charging current should be in about 20 pA. Checking carefully with Fig. 4B, we find that the jump current is in the same range with the current of ion transfers. Therefore, we can conclude that the big change at the interface is dominated by the ion transfer currents. With each approach step of 0.1 nm, the interfacial thickness could be estimated from the middle section of an approach curve, where the tip current finished 80% of the dramatic change in about 0.7 nm (see inset in Fig. 5). This value is a little larger than the thickness of a neat W/NB interface, quoted as 0.53 nm.2 However, it is consistent with the value reported by Schlossman et al., in which the interfacial thickness of a W/NB interface electrified by a common ion, tetrabutylammonium (TBA+), was 0.62 to 0.80 nm.30 Moreover, the tip current changed continuously in the interfacial region, probably indicating that ions could penetrate into the interfacial region which could be considered as a mixed solvent layer.
Ion distributions near the ITIES can be predicted by Gouy–Chapman theory,49,50 which can also be extracted from two gradually changing parts of SICM approach curves. According to the theory, the diffuse layer will be compressed when the concentration of electrolyte increases. As far as we are concerned, few experimental techniques can directly probe this property of an ITIES. A series of X-ray reflectivity studies30,31 have investigated the electron density profile and ion distributions near the W/NB interface. Herein, with this new experimental approach, we have investigated the effect of electrolyte concentration on the thickness of diffuse layers.
Fig. 6A shows a family of SICM approach curves with different LiCl concentrations of 1, 1 × 10⁻¹, 1 × 10⁻², 1 × 10⁻³ and 1 × 10⁻⁴ M when the concentration of TPAsTPB was fixed at 1 × 10⁻³ M. The potential imposed on the interface was kept at −0.6 V vs.Ag/AgCl. With the same composition of organic phase, the difference between five approach curves mainly focused on aqueous side, i.e. the part with negative coordinate. After the tip passed through the ITIES, the potential of bottom aqueous side was lower than that of top organic side, so the aqueous diffuse layer primarily contained Cl− ions with the concentration enhanced over the bulk value. This concentration gradient counteracted part of the potential imposed on the macroscopic interface, resulting in a relatively smaller tip current. When the tip went further into the aqueous phase, the concentration of Cl− reduced to its bulk value, so the tip current increased gradually to the aqueous limiting current, iW,∞, i.e., the tip current at z < 0 was negatively correlated with the distribution of Cl− at aqueous side. As shown in Fig. 6A, the aqueous transitional part of each approach curve could reflect Cl− ion distributions near the ITIES. To study the thickness of the aqueous diffuse layer, we defined the distance between ITIES (z = 0) and the coordinate where the tip current reached 90% of iW,∞ as aqueous specific distance. We consider this specific distance is primarily correlated with the thickness of aqueous diffuse layer. As the concentration of LiCl increased (curve 1 to 5), the aqueous specific distance became smaller, referring to thinner diffuse layer (see Fig. 6B).
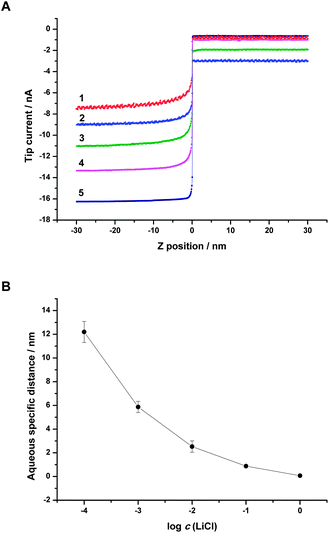 | ||
| Fig. 6 (A) SICM approach curves obtained with different concentrations of LiCl in the bottom aqueous phase and constant composition of the organic phase (1 × 10⁻³ M TPAsTPB in NB). Concentration of LiCl in the bottom aqueous phase was (1) 1 × 10⁻⁴ (scaled 50×), (2) 1 × 10⁻³ (scaled 30×), (3) 1 × 10⁻² (scaled 10×), (4) 1 × 10⁻¹ (scaled 1.6×), (5) 1 M. The solution filled in the pipette was kept the same as bottom phase for each curve. The tip potential was −0.6 V vs.Ag/AgCl. Scan rate was 50 nm s−1. (B) Aqueous specific distance for different concentrations of LiCl in water. Error bars are indicated by vertical lines through the data points and are smaller than the symbols when not visible. | ||
The effect of TPAsTPB concentration on the thickness of organic diffuse layer was also investigated. A series of approach curves in Fig. 7A were obtained by moving a pipette toward the interfaces between 1 × 10⁻⁶, 3 × 10⁻⁶, 1 × 10⁻⁵, 1 × 10⁻⁴, 1 × 10⁻³ M solutions of TPAsTPB in NB and 1 × 10⁻⁴ M LiCl solution in water. The pipette bias was set at −0.8 V vs.Ag/AgCl to gain a proper signal to noise ratio. The difference between the curves centered on the organic side since the concentration of LiCl in the pipette and bottom aqueous phase was kept constant. The tip current increased gradually when the pipette approached the interface because of the increasing concentration of TPAs+, thus the distribution of TPAs+ could be extracted from the approach curves. Similar to the study of aqueous diffuse layer, we defined the organic specific distance as the distance between the ITIES (z = 0) and the coordinate where the tip current reached 110% of iO,∞, the organic limiting current. As shown in Fig. 7B, higher concentration of TPAsTPB corresponded to smaller organic specific distance, suggesting that the organic diffuse layer was compressed by the higher concentration of electrolyte.
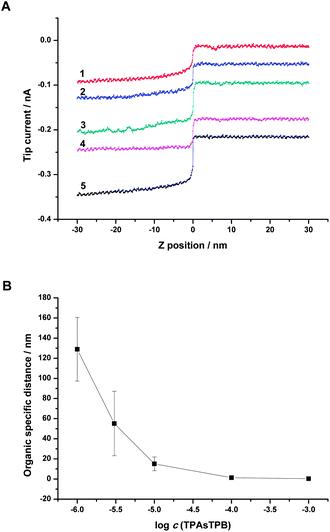 | ||
| Fig. 7 (A) SICM approach curves obtained with different concentrations of TPAsTPB in the top organic phase and constant composition of the aqueous phase (1 × 10⁻⁴ M LiCl in water). Concentration of TPAsTPB in the organic phase was (1) 1 × 10⁻⁶, (2) 3 × 10⁻⁶ (moved down 0.04 nA), (3) 1 × 10⁻⁵ (moved down 0.08 nA), (4) 1 × 10⁻⁴ (moved down 0.15 nA), (5) 1 × 10⁻³ (moved down 0.20 nA) M. The solution filled in the pipette was the same as bottom aqueous phase. The tip potential was −0.8 V vs.Ag/AgCl. Scan rate was 50 nm s−1. (B) Organic specific distance for different concentrations of TPAsTPB in NB. Error bars are indicated by vertical lines through the data points and are smaller than the symbols when not visible. | ||
Conclusions
Using SICM as a novel technique, we have demonstrated that it is possible to probe the structure of a W/NB interface, including the distributions of solvent molecules and dissolved ions near the interface. These experimental results show that the thickness of W/NB interface is less than 1 nm, in accordance with X-ray reflectivity measurements. The continuously changing current in the interfacial region of SICM approach curve suggests ions of adjacent phases can penetrate into the interface, just as described in a mixed solvent model. In addition, the approach curves obtained with different electrolyte concentrations vary in shapes, revealing that the thickness of diffuse layers will be compressed by higher electrolyte concentrations. This approach broadens the application fields of SICM and provides a new experimental methodology to investigate the structure of liquid/liquid interfaces.Acknowledgements
The financial support for this work from the National Natural Science Foundation of China (20735001 and 21075004) and the Innovation Team Programs of the Ministry of Education of China are gratefully acknowledged.Notes and references
- H. Girault, in Electroanal Chem., ed. A. J. Bard and C. G. Zoski, CRC Press, Boca Raton, 2010, pp. 1–104 Search PubMed.
- R. A. W. Dryfe, in Adv. Chem. Phys., ed. S. A. Rice, John Wiley & Sons, Inc., New York, 2009, pp. 153–215 Search PubMed.
- P. Jing, S. L. He, Z. W. Liang and Y. H. Shao, Anal. Bioanal. Chem., 2006, 385, 428–432 CrossRef CAS.
- B. Liu and M. V. Mirkin, Anal. Chem., 2001, 73, 670A–677A CAS.
- S. J. Liu, Q. Li and Y. H. Shao, Chem. Soc. Rev., 2011, 40, 2236–2253 RSC.
- M. Gros, S. Gromb and C. Gavach, J. Electroanal. Chem., 1978, 89, 29–36 Search PubMed.
- T. Kakiuchi and M. Senda, Bull. Chem. Soc. Jpn., 1983, 56, 1322–1326 CAS.
- T. Kakiuchi and M. Senda, Bull. Chem. Soc. Jpn., 1983, 56, 1753–1760 CAS.
- Z. Samec, V. Marecek and D. Homolka, J. Electroanal. Chem., 1985, 187, 31–51 Search PubMed.
- H. H. Girault and D. J. Schiffrin, J. Electroanal. Chem., 1983, 150, 43–49 CrossRef CAS.
- H. H. J. Girault and D. J. Schiffrin, J. Electroanal. Chem., 1984, 170, 127–141 Search PubMed.
- H. H. Girault, Electrochim. Acta, 1987, 32, 383–385 CrossRef CAS.
- C. Yufei, V. J. Cunnane, D. J. Schiffrin, L. Mutomaki and K. Kontturi, J. Chem. Soc., Faraday Trans., 1991, 87, 107–114 RSC.
- C. M. Pereira, A. Martins, M. Rocha, C. J. Silva and F. Silva, J. Chem. Soc., Faraday Trans., 1994, 90, 143–148 RSC.
- C. M. Pereira, W. Schmickler, A. F. Silva and M. J. Sousa, Chem. Phys. Lett., 1997, 268, 13–20 CrossRef CAS.
- C. M. Pereira, W. Schmickler, F. Silva and M. J. Sousa, J. Electroanal. Chem., 1997, 436, 9–15 CrossRef CAS.
- C. M. Pereira, F. Silva, M. J. Sousa, K. Kontturi and L. Murtomaki, J. Electroanal. Chem., 2001, 509, 148–154 Search PubMed.
- S. Ishizaka, S. Habuchi, H.-B. Kim and N. Kitamura, Anal. Chem., 1999, 71, 3382–3389 CrossRef CAS.
- S. Ishizaka, H.-B. Kim and N. Kitamura, Anal. Chem., 2001, 73, 2421–2428 CrossRef CAS.
- L. F. Scatena, M. G. Brown and G. L. Richmond, Science, 2001, 292, 908–912 CrossRef CAS.
- M. G. Brown, D. S. Walker, E. A. Raymond and G. L. Richmond, J. Phys. Chem. B, 2003, 107, 237–244 CrossRef CAS.
- D. S. Walker, M. Brown, C. L. McFearin and G. L. Richmond, J. Phys. Chem. B, 2004, 108, 2111–2114 CrossRef CAS.
- D. S. Walker, F. G. Moore and G. L. Richmond, J. Phys. Chem. C, 2007, 111, 6103–6112 CrossRef CAS.
- R. D. Webster and D. Beaglehole, Phys. Chem. Chem. Phys., 2000, 2, 5660–5666 RSC.
- W. H. Steel and R. A. Walker, Nature, 2003, 424, 296–299 CrossRef CAS.
- W. H. Steel, Y. Y. Lau, C. L. Beildeck and R. A. Walker, J. Phys. Chem. B, 2004, 108, 13370–13378 CrossRef CAS.
- W. H. Steel, C. L. Beildeck and R. A. Walker, J. Phys. Chem. B, 2004, 108, 16107–16116 CrossRef CAS.
- I. Tsuyumoto, N. Noguchi, T. Kitamori and T. Sawada, J. Phys. Chem. B, 1998, 102, 2684–2687 CrossRef CAS.
- A. Trojanek, P. Krtil and Z. Samec, Electrochem. Commun., 2001, 3, 613–618 CrossRef CAS.
- G. M. Luo, S. Malkova, J. Yoon, D. G. Schultz, B. H. Lin, M. Meron, I. Benjamin, P. Vanysek and M. L. Schlossman, J. Electroanal. Chem., 2006, 593, 142–158 Search PubMed.
- G. M. Luo, S. Malkova, J. Yoon, D. G. Schultz, B. H. Lin, M. Meron, I. Benjamin, P. Vanysek and M. L. Schlossman, Science, 2006, 311, 216–218 CrossRef CAS.
- E. Yurtsever and H. Karaaslan, Ber. Bunsenges. Phys. Chem., 1987, 91, 600–603.
- I. Benjamin, J. Chem. Phys., 1992, 97, 1432–1445 CrossRef.
- S. Frank and W. Schmickler, J. Electroanal. Chem., 2000, 483, 18–21 CrossRef CAS.
- L. I. Daikhin, A. A. Kornyshev and M. Urbakh, J. Electroanal. Chem., 2001, 500, 461–470 Search PubMed.
- L. I. Daikhin and M. Urbakh, J. Electroanal. Chem., 2003, 560, 59–67 Search PubMed.
- D. J. Henderson and W. Schmickler, J. Chem. Soc., Faraday Trans., 1996, 92, 3839–3842 RSC.
- C. Wei, A. J. Bard and M. V. Mirkin, J. Phys. Chem., 1995, 99, 16033–16042 CrossRef CAS.
- T. Solomon and A. J. Bard, Anal. Chem., 1995, 67, 2787–2790 CrossRef CAS.
- Y. H. Shao and M. V. Mirkin, J. Electroanal. Chem., 1997, 439, 137–143 CrossRef CAS.
- S. Amemiya and A. J. Bard, Anal. Chem., 2000, 72, 4940–4948 CrossRef CAS.
- R. Ishimatsu, J. Kim, P. Jing, C. C. Striemer, D. Z. Fang, P. M. Fauchet, J. L. McGrath and S. Amemiya, Anal. Chem., 2010, 82, 7127–7134 Search PubMed.
- P. K. Hansma, B. Drake, O. Marti, S. A. C. Gould and C. B. Prater, Science, 1989, 243, 641–643 CrossRef CAS.
- Y. E. Korchev, C. L. Bashford, M. Milovanovic, I. Vodyanoy and M. J. Lab, Biophys. J., 1997, 73, 653–658 CrossRef CAS.
- A. I. Shevchuik, G. I. Frolenkov, D. Sanchez, P. S. James, N. Freedman, M. J. Lab, R. Jones, D. Klenerman and Y. E. Korchev, Angew. Chem., Int. Ed., 2006, 45, 2212–2216 CrossRef CAS.
- M. Bocker, S. Muschter, E. K. Schmitt, C. Steinem and T. E. Schaffer, Langmuir, 2009, 25, 3022–3028 CrossRef.
- P. D. Beattie, A. Delay and H. H. Girault, J. Electroanal. Chem., 1995, 380, 167–175 CrossRef.
- C. Wei, A. J. Bard and S. W. Feldberg, Anal. Chem., 1997, 69, 4627–4633 CrossRef CAS.
- G. Gouy, C.R. Acad. Sci., 1910, 149, 654–657 Search PubMed.
- D. L. Chapman, Philos. Mag., Ser. 5, 1913, 25, 475–481 Search PubMed.
Footnotes |
| † Electronic supplementary information (ESI) available: Modification of the instrument, SEM images of the nanopipette, approach curves with different scan rates and the effect of charging current. See DOI: 10.1039/c1sc00133g |
| ‡ Tianrong Ji and Zhongwei Liang contributed equally and can be considered as co-first authors. |
| This journal is © The Royal Society of Chemistry 2011 |
