Prebiotically relevant mixed fatty acid vesicles support anionic solute encapsulation and photochemically catalyzed trans-membrane charge transport†
Jonathan L.
Cape
a,
Pierre-Alain
Monnard
ab and
James M.
Boncella
*a
aMaterials, Physics and Applications Division, Los Alamos National Laboratory, MS J514, Los Alamos, New Mexico 87545, USA. E-mail: boncella@lanl.gov
bFLinT Center, Dept of Physics and Chemistry, University of Southern Denmark, Campusvej 55, DK 5230, Odense M, Denmark
First published on 21st January 2011
Abstract
The spontaneous assembly of amphiphile-based compartments in aqueous solution is widely viewed as a key step in models for the abiotic formation of primitive cell-like structures. Proposed organic components for such systems consist of mixed short chain fatty acids (FA) and polycyclic aromatic hydrocarbon (PAH) species, the composition of which have been modeled after organic extracts of carbonaceous meteorites. Self-assembly of amphiphiles from these extracts into aqueous suspensions of bilayer structures was long ago demonstrated, although little has since been reported concerning the stability and potential functionality of these complex mixtures. This work explores the thermodynamic and kinetic stability of vesicles prepared from complex mixtures of short chain FA species (CH3COOH–C9H19COOH) with membrane solubilized PAH species. Critical vesicle concentration measurements and ultrafiltration analyses of decanoic acid in the presence of other shorter chain FA species indicate the formation of mixed component vesicle phases composed mainly of C10–C8 FA components. An electrostatic barrier to trans-membrane diffusion of negative charges allows observation of stably encapsulated poly-anionic solutes inside these vesicles. As a model for primitive energy transduction, trans-membrane electron transfer between EDTA and encapsulated ferricyanide was demonstrated, driven catalytically via PAH photochemistry without substantial decomposition of the chromophores or vesicles. These results indicate a plausible role for compartmentalization and catalysis by short chain fatty acids and PAH species in prebiotic vesicle-encapsulated systems.
The spontaneous assembly of enclosed bilayer vesicles from organic amphiphiles in aqueous solution is widely viewed as a key step in models for the abiotic origins of cellular life.1–4 Such structures might have imparted both compartmentalization and catalytic functions to primitive prebiotic systems.2,3,5 Since no physical record of prebiotic membranes exist, these functions can only be speculated upon, and determined plausible or not, by the study of model chemical systems.
To investigate catalysis and compartmentalization in primitive membranous systems we have used the composition of carbon containing meteorites6 as a model for the organic composition of early terrestrial environments. The accumulation of organic matter in the prebiotic environment likely originated, at least in part, from interstellar infall, prompting previous interest in its chemical makeup7–15 as well as the composition of aqueous colloids and suspensions formed from this material.3,4,16 Analysis of carbonaceous chondrites6 revealed an abundance of short chain saturated fatty acids (FA; < C10H20O2, hereafter fatty acids are denoted by their carbon chain length, e.g. C10)6,9,14,17 and certain polycyclic aromatic hydrocarbons8,11,18–20 (PAH, e.g. pyrene, chrysene, phenanthrenes and benzopyrenes).21 Magnitude estimates of interstellar infall to Earth suggest an early environment potentially abundant in these organic components.22,23 These findings led to proposals that interstellar infall might provide some of the basic chemical components for compartmentalization and catalytic moieties in early protocellular systems.19
A continually growing literature on FA-based model systems has demonstrated similarities with many of the dynamic properties associated with evolutionarily advanced cell membranes: growth,2,24,25 division,1,2,26 and selective permeability.4,16,27–30 Addition of co-surfactants, such as fatty alcohols4 or glycerol-monoesters,31–33 have been shown to extend the robustness of these systems in terms of aggregation equilibria, pH, temperature sensitivity, and solute encapsulation. Additionally, ‘bottom up’ approaches to synthetic biology have demonstrated that FA vesicle systems are adequate enough in their compartmentalization function to support model processes resembling genetic replication27,32 and certain types of nonenzymatic34 and enzymatically catalyzed reactions.35
Despite the robustness and utility of single component FA systems in the study of prebiotic chemistry, these simple mixtures (e.g. typically oleic acid/sodium oleate or decanoic acid/sodium decanoate) are far removed from the complex distribution of amphiphiles and other organic constituents that compose interstellar infall, and hence may not adequately model proposed chemical compositions of early terrestrial environments. The long chain fatty acids typically used in model systems exhibit favorable vesicle aggregation equilibria,25,36,37 high solute encapsulation yields,4,28,32 and well delineated phase behavior.38–41 In contrast, organic extracts of chondrites6 reveal the potential for far more complicated membranes that might contain a variety of short chain FA (C10–C2 acids) and PAH species. Previous attempts at solute encapsulation in these systems demonstrated far less robustness than longer chain FA aggregates.4,42 Moreover, no specific studies of the structural, thermodynamic and reactive properties of these mixtures have been reported.
Using the composition of carbonaceous chondrites as a model for prebiotic surfactant and PAH distributions, this work presents studies on vesicle stability, membrane partitioning, permeability and trans-membrane charge transport in complex mixtures of short chain fatty acids and PAH species. The results obtained from this work allow an assessment of potential compartmentalization and catalytic functions of these models as plausible prebiotic membranous systems.
Materials and methods
Chemicals
Decanoic acid and pyrene were obtained from Acros Chemicals. Nonanoic acid, octanoic acid, hexanoic acid, butyric acid, Sephadex G-25, 2,3(a)-naphthopyrene, and Ru(bpy)3Cl2 were obtained from Sigma (St. Louis, MO). Valeric acid was obtained from Alfa Aesar. Disodium phosphate, acetic and propionic acids were obtained from Fisher Scientific. Ferrioxalate43 and tris-(5,5′-dicarboxy-2,2′-bipyridine)ruthenium44 were prepared according to literature procedures. All chemicals were obtained in the highest purity available and used as received. Absorption measurements were performed on either an Agilent 8453 diode array spectrophotometer, or a Cary 100 UV-vis spectrophotometer. Fluorescence measurements were performed on a Shimadzu RF-5301 PC spectrofluorimeter. Dynamic light scattering measurements were performed on a 90° light scattering instrument PDDLS/CoolBatch 90T (Precision Detectors). HPLC was performed on a Dionex HPLC system using a 4.6 × 250 mm C18 column (Dionex, Acclaim-120-C18-Reversed-Phase). Microscopic fluorescence images of vesicle populations were obtained on a Vanguard 1200ECM series fluorescence microscope at 1000× magnification equipped with a Canon EOS XSI-Rebel digital SLR camera for image capture. Stock solutions of fatty acid vesicles were prepared by the adjusting the pH of a fatty acid suspension in 50 mM phosphate to pH 7.2 with NaOH and allowing the solution to equilibrate overnight at 23 °C.Measurement of the critical vesicle concentration of fatty acid mixtures
Two methods were used to estimate the critical vesicle concentration (CVC) for fatty acid mixtures. Complex mixtures of fatty acids, ternary and higher, exhibited a large background in light scattering at concentrations below the CVC which complicated absorbance measurements for dye based assays (see below). For these mixtures, the intensity of 90° light scattering from a dynamic light scattering detector was used to estimate the CVC.For binary mixtures of fatty acids the solvochromic absorbance shift of the dye merocyanine 540 (MC540) was used to estimate the minimum concentration of surfactant able to form bilayer structures.45 This solvochromic shift was quantified by the 570–530 nm absorbance difference. The CVC determination was carried out by titrating fatty acids from 1 to 35 mM in 50 mM phosphate (pH 7.2) containing 10 μM MC540. Each point in the titration was prepared as a separate sample diluted from a concentrated fatty acid stock solution (100 mM, pH 8.5) to which was added 10 μM MC540. The pH of samples containing high surfactant concentrations (e.g. approaching the buffer concentration) were checked and adjusted with dilute HCl as needed. Samples for 90° DLS detection were prepared in a similar manner, omitting addition of the MC540 dye. All samples were vortexed for 30 s after preparation and allowed to equilibrate for a minimum of two hours prior to measurement. It is noteworthy that equivalent results for CVC titrations were obtained whether samples were prepared by dilution of the sodium salts of the fatty acids into a pH 7.2 buffer, or by dilution of a concentrated pre-formed vesicle stock at pH 7.2 into the same buffer. This observation suggests that the route to vesicle formation on these timescales is irrelevant, and that a pseudo-equilibrium of the vesicle phase was achieved.
Ultrafiltration and HPLC analysis
Ultrafiltration of vesicle samples was used to analyze the composition of the soluble, monomeric surfactant phase. Briefly, concentrated stock solutions of fatty acid mixtures (decanoic acid through butyric acid) were prepared with 30 mM of each fatty acid in 50 mM phosphate buffer (pH 7.2); equivalent results were also achieved using only 15 mM of each fatty acid (data not shown). 500 μL of this stock was loaded onto a 3 kD MW cutoff Microcon spin column (Millipore, Bedford, MA) and centrifuged at 4500 × g for 20 min at 23 °C, filtering approximately 20% of the total volume. DLS measurements on the supernatant confirmed that the centrifugation procedure did not substantially alter the apparent size distribution of the vesicle containing solution retained by the filter. 60 μL aliquots of the original stocks, the filtrate, and supernatant from above were acidified with 5 μL concentrated HCl, and extracted with methylene chloride 1 × 200 μL. The organic extracts were removed and dried under a stream of argon, then redissolved with 300 uL of an acetonitrile solution containing 25 mM p-bromophenacyl bromide and 75 mM triethylamine and heated in a 60 °C water bath for 30 min.46 HPLC analysis of the derivatized fatty acids was performed using an initial gradient elution from (80/20) 0.1% TFA![[thin space (1/6-em)]](https://www.rsc.org/images/entities/char_2009.gif) :methanol to (20/80) over a 20 min period, then an isocratic phase at (20/80) 0.1% TFA:methanol to 60 min using UV detection at 260 nm. Peaks were identified by comparison with authentic standards of p-bromophenacyl bromide-derivatized fatty acids. Quantitation of vesicle solubilized PAHs was performed by comparison of CHCl3 extracts of aqueous vesicle suspensions with PAH standard curves.
:methanol to (20/80) over a 20 min period, then an isocratic phase at (20/80) 0.1% TFA:methanol to 60 min using UV detection at 260 nm. Peaks were identified by comparison with authentic standards of p-bromophenacyl bromide-derivatized fatty acids. Quantitation of vesicle solubilized PAHs was performed by comparison of CHCl3 extracts of aqueous vesicle suspensions with PAH standard curves.
Solute encapsulation and permeability
Encapsulation of solutes within fatty acid vesicles was achieved by pH and temperature manipulation of concentrated vesicle mixtures. Briefly, the pH of a vesicle solution (> 30 mM in all fatty acid components) in the presence of selected co-solutes, was made alkaline (pH∼9.0) by NaOH addition, followed by acidification to pH 7.2 with HCl. The concentration of the co-solutes used were 50 mM Fe(CN)63−, ∼100 μM 5(6)-carboxyfluorescein, 1.1 mM pyranine, and ∼500 μM Ru(dcbpy)34−. Samples were then incubated for 20 min at 60 °C in sealed tubes in order to equilibrate solute and ionic gradients. After cooling to room temperature, samples were chromatographed on a Sephadex G-25 column (10 × 0.7 cm) equilibrated with 50 mM phosphate (pH 7.2) and pre-equilibrated with the same fatty acid composition as the encapsulation preparation at concentrations in excess of the CVC (∼30 mM). In most cases the length of the column bed was adjusted to achieve adequate separation of the solute encapsulated vesicles from non-encapsulated species. Spectroscopic monitoring of the column effluent was achieved by fixing the effluent tube in the optical path of either a diode array or fluorescence spectrophotometer. Repeated chromatography on 0.5 mL aliquots of the encapsulated vesicle preparation allowed direct monitoring of the time dependent proportions of encapsulated and escaped solute. Assuming first order efflux kinetics, the rate constant for solute efflux is given by eqn (1) and (2)47| ln(Fencaps)t = −kt | (1) |
| Fencaps = Aencaps/(Aencaps + Afree) | (2) |
| P = (S/V)k | (3) |
Photochemical reactivity of PAH species
Fatty acid vesicles (50 mM decanoic acid, 50 mM phosphate, pH 7.2) with encapsulated Fe(CN)63− (50–150 mM) were prepared using the pH/heat treatment encapsulation method described above and chromatographed on a Sephadex G-25 column (0.7 × 20 cm) to separate the encapsulated from free solutes. The fraction containing encapsulated Fe(CN)63− (∼2.0 mL) was collected and diluted two-fold with empty decanoic acid vesicle stock solution (same composition as used above during chromatography) in order to fill the dead volume of the flow cuvette and associated tubing (see below). PAH from an acetonitrile stock solution and EDTA were added to the encapsulated vesicle solution at concentrations of 1–2 μM and 22.7 mM, respectively. The final acetonitrile concentration did not exceed 1.3% v/v; this addition did not induce measurable effects on the DLS-estimated size distributions or scattering intensity of the vesicle suspensions. Final reaction suspensions were placed in a 30 mL round bottom flask and deoxygenated while stirring under hydrated Ar flow for at least 15 min prior to measurement, with continuous Ar flow over the headspace for the measurement duration. Optical measurements were conducted in a Cary 100 UV-vis spectrophotometer in a continuous flow cuvette using a peristaltic pump to recycle the reaction solution between the sealed reaction flask and flow cuvette. Illumination of the reaction flask was provided by a broad-band near UV excitation centered around 365 nm. Quantification of Fe(CN)63− reduction was performed using the 420–490 nm difference absorption (ε = 1050 M−1 cm−1).48 At any point in time, approximately 75% of the reaction solution was under illumination in the reaction flask with the remaining 25% being cycled through the cuvette and associated tubing. Ferrioxalate actinometry was used to quantify photon flux and quantum yields.43,49 The free Fe2+ produced in the ferrioxalate decomposition reaction was quantified by complexation with 1,10-phenanthroline (0.1 M in 0.1 M H2SO4); the product was quantified on the low energy end of its visible band at 575 nm using ε575 = 1250 M−1 cm−1 to avoid interference with absorbance from excess ferrioxalate.Results and discussion
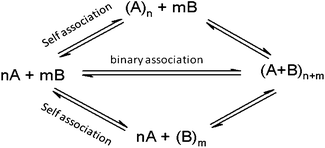
This work probes the propensity for binary and higher order mixtures of fatty acids of differing chain length to aggregate into mixed surfactant vesicle phases according to the equilibria shown in simplified form in Scheme 1. The primary criteria for aggregation of monomeric fatty acid species into a bilayer vesicle phase is given by the critical vesicle concentration (CVC), defined empirically as the minimal concentration of surfactant needed to obtain the aggregation of monomers into bilayer structures. The CVC is thermodynamically equivalent to a single species solubility product, [FA]* in eqn (4) and 5.| nFA → (FA)n | (4) |
| CVC = [FA]/[(FA)n] ≈ [FA]* | (5) |
 | ||
| Scheme 1 Aggregation equilibria involving a binary surfactant system. | ||
Aggregation equilibria involving more than a single surfactant species can result in multiple association phenomena including binary association, self-association, or non-associative spectator behavior with respect to each surfactant component (see Scheme 1). In the case where two amphiphile species are known to aggregate 1:1 into a mixed vesicle phase, the CVC is commonly reported as the sum of their individual concentrations at the point where aggregate formation occurs (i.e. in terms of the total surfactant concentration).
In cases of unknown aggregation equilibria involving multiple species, some added components may simply behave as a spectator species to vesicle formation and should not be included in the CVC expression. Since this work primarily probes such unknown aggregation equilibria, the differences in the apparentCVC values for the primary vesicle forming component, decanoic acid, were measured in the presence and absence of added amounts of second and further components (shorter chain fatty acid species, C9 and lower). As can be inferred from Scheme 1, the ratio of CVC values between the pure decanoic acid system and when additional surfactants are present provides a measure of the change in driving force of decanoic acid incorporation into vesicles and serves as a convenient probe of multi-component vesicle formation under these conditions. This approach allows these equilibria to be probed without making assumptions about which species thermodynamically contribute to vesicle formation and which do not, and avoids erroneous conclusions that might result from including spectator species in the CVC expression.
Aggregation behavior of fatty acid/sodium salt aqueous mixtures
Fig. 1A shows the phase behavior of the decanoic acid/sodium decanoate system (hereafter referred to simply as the decanoic acid system) measured by DLS light scattering intensity at constant concentration (50 mM) as a function of pH. Micellular aggregates are the predominant phase present above the apparent pKa of decanoic acid. As the apparent pKa at ∼7.1 is titrated, a lamellar vesicle phase becomes the predominant aggregate, finally forming a crystalline decanoic acid precipitate below pH 6.7. This phase behavior results from relief of charge repulsion and the introduction of hydrogen bonding interactions as the concentration of protonated and deprotonated fatty acids equalize, and is limited by the solubility of pure decanoic acid. CVC values for the decanoic acid system were ∼18–22 mM at pH 7.2 (±0.05). This CVC range is comparable to those previously reported, 10–40 mM,4,50,51 which vary depending on experimental conditions such as pH, ionic strength and temperature. Also consistent with previous reports,51 the decanoic acid CVC was found to be pH dependent (data not shown), with lower values being obtained upon progressive acidification. We hereafter restricted measurements to pH 7.2 (±0.05) in order to remain within the maximal buffering capacity of phosphate, which is coincidentally an ideal pH for vesicle formation from short chain fatty acids. Also present in these solutions were sodium ions (0–150 mM) originating from neutralization of the fatty acids and the buffer (50 mM Na2HPO4), which slightly increased CVC values above what would be measured for pure 1:1 decanoic acid/sodium decanoate in unbuffered solution (see Smith and Anderson52 for a detailed discussion of this effect in the lauric acid-Na+/K+ laurate system).
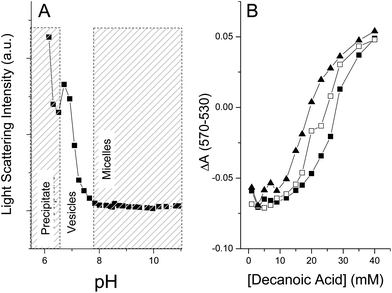 | ||
| Fig. 1 pH dependent phase behavior of decanoic acid and binary titrations with nonanoic and octanoic acids. Panel A demonstrates the pH dependence of 90° DLS scattering intensity from a 50 mM solution of decanoic acid buffered with 10 mM phosphate, revealing changes in phase composition as the ratio of sodium decanoate and decanoic acid are varied. Regions of differing phase (e.g. precipitate, vesicles, micelles) are indicated by the shaded boxes. Panel B shows CVC titrations in binary surfactant systems at pH 7.2 using the MC540 assay, see Materials and Methods: decanoic acid alone (filled squares), decanoic acid titrated in the presence of 40 mM nonanoic acid (filled triangles), and decanoic acid titrated in the presence 40 mM octanoic acid (open squares). | ||
The CVC values of decanoic acid in binary systems (Fig. 1B) containing nonanoic acid at 0, 20, or 40 mM, were lower than that found in the pure decanoic acid system. The observed CVC decrease depended on the concentration of the fatty acid additive, reaching a 40% decrease at 40 mM nonanoic acid (Fig. 1B). Note that this concentration of nonanoic acid is well below the intrinsic CVC of pure nonanoic acid (∼85 mM4) indicating that the observed aggregates likely consist of a decanoic and nonanoic acid-salt mixture. Mixed binary systems containing decanoic and octanoic acids had less of an effect on the decanoic acid CVC, decreasing by only 15% in the presence of 40 mM octanoic acid. Binary systems composed of decanoic acid and either heptanoic or hexanoic acids did not cause any changes to the decanoic acid CVC.
Decanoic acid CVC values in more complex fatty acid mixtures (i.e. n fatty acid components where n ≥ 2) are shown in Fig. 2. In Fig. 2A the CVC values for decanoic acid were determined in the presence of multiple other shorter chain components, 20 mM each, all held at constant concentration throughout the decanoic acid titration. In this plot, each CVC (from left to right) represents an increasingly complex system in order to survey mixtures ranging from pure decanoic acid to those containing decanoic through valeric (C5) acids. Results comparable to those of the binary systems were obtained in these measurements. Here, the decanoic acid CVC decreased from 21 mM in a pure decanoic acid system to ∼11 mM in the presence of nonanoic and octanoic acids. The subsequent addition heptanoic (C7) through valeric (C5) acids into these mixtures had no further effect on the decanoic acid CVC.
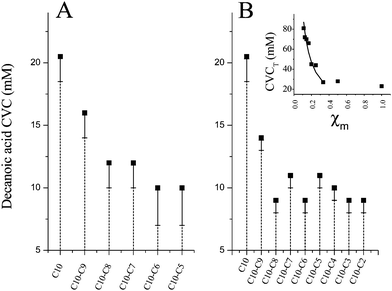 | ||
| Fig. 2 CVC determinations for mixed fatty acid systems. Panel A—The CVC for decanoic acid (pH 7.2) when assayed in the presence of constant concentrations of other shorter chain fatty acid components (20 mM each). Panel B—CVC values for decanoic acid when equimolar ratios of all surfactants (decanoic acid included) in the mixture were maintained throughout these measurements, and titrated simultaneously. Bars extending below the data points represent the beginning of the titration interval upon which vesicle formation begins. Inset—Data from Panel B plotted as the CVC with respect to total amphiphile concentration in solution (CVCT) as a function of the mole fraction of decanoic acid in the complex mixture. The solid line indicates the theoretical amount by which the CVCT should increase if the added additional components (C7 and lower chain lengths) did not participate in vesicle formation. | ||
The absence of large effects on the decanoic acid CVC in these experiments might be explained if too low a concentration of other components were selected for these initial determinations. In order to test for such a concentration effect while minimizing the number of variables investigated, a separate set of CVC determinations was conducted in which equimolar ratios of all components were maintained by titrating all components, including decanoic acid, simultaneously. The results of these titrations, shown in Fig. 2B, exhibited similar results to those obtained when other added short chain fatty acid components were held at a constant concentration. The decanoic CVC decreased by ∼50% in the presence of equimolar concentrations of nonanoic and octanoic acids, with no additional changes observed on addition of components with chain lengths below eight carbons.
The inset of Fig. 2B shows the same data from Fig. 2B replotted as the CVC with respect to the total amphiphile concentration in solution (CVCT) versus the mole fraction of decanoic acid in the mixture (χm). Plotting the data in this way demonstrates little perturbation of CVCT as the mole fraction of decanoic decreases for mixtures of C10, C9 and C8 acids (0.33 < χm < 1.0), indicating that vesicles form at lower and lower decanoic acid concentrations with these additives. Note that the concentration of nonanoic and octanoic acids are also well below their own pure CVC values (∼85 mM, and ∼130 mM, respectively4). Thereafter CVCT sharply increases on addition of heptanoic acid and further short chain components (χm < 0.33). The solid line in Fig. 2B-inset demonstrates that the slope of this portion of the curve is exactly what one should expect for spectator behavior with these additional components (i.e. the apparent CVCT rises monotonically by the amount of additional amphiphile added to the solution).
The overall behavior discussed above is consistent with the formation of vesicles of similar size and aggregation number to the pure decanoic acid system on addition of nonanoic and octanoic acids, but with a mixed composition reflecting these added components. This behavior is not unexpected; chain length compatibility and phase mixing should be expected for surfactants with chain length differences of 2–3 carbons or lower, whereas phase separation tends to occur for surfactants with chain length differences beyond three carbons.53–55 The modest lowering of the apparent decanoic acid CVC under these conditions (corresponding energetically to a ∼1.1 kJ mol−1) results from substitution by nonanoic and octanoic acids for decanoic acid in the mixed component vesicles. Overall phase stability of these mixed component vesicles can be rationalized in terms of an enthalpy/entropy tradeoff. An enthalpic penalty is paid by substituting surfactants with one or two fewer carbons in the aliphatic chain, resulting in decreased hydrophobic attraction. This penalty appears to be more than offset by the overall entropic phase stability of these mixed vesicles relative to the soluble monomeric forms of nonanoic and octanoic acids, which require a fair amount of aqueous solvent ordering and are entropically disfavored. Fatty acids with chain lengths of seven carbons and shorter did not alter the decanoic acid CVC value, either alone or in more complex mixtures, and are likely spectator species to these equilibria. In these cases the enthalpy/entropy compensation for membrane formation is probably tipped just enough in the opposite direction from longer chain species to disfavor mixed component vesicle formation.
DLS analysis of aggregate size distributions
Vesicle preparations from the n-component fatty acid mixtures discussed above were polydisperse with respect to DLS-estimated hydrodynamic radii (Ro). Two identifiable populations of aggregates were observed in the pure decanoic acid system, one with Ro values greater than 1 μm which were detected by light microscopic analyses of rhodamine-6B dyed samples (not shown), and a population with smaller Ro values ranging from 50–100 nm, identifiable by DLS measurements only. The smaller Ro population was assumed to be small unilamellar vesicles (SUV's) by comparison with previously reported electron micrographic and DLS analyses,51 as well as additional encapsulation experiments demonstrating the presence of an inner aqueous phase (see below). This population was separable from the larger aggregates by filtration. All further work and analyses, except for fluorescence microscopy, were performed on this population of SUV's in order to eliminate inconsistencies and uncertainties in the size, shape and lamellarity of the larger aggregates.Estimates of the hydrodynamic radii for the proposed SUV population of the mixed FA vesicles were obtained from additional DLS analyses (see Supporting Information†). Ro values for these mixtures ranged from 56–109 nm, and did not deviate substantially from decanoic acid alone (Ro = 86 nm) or previously published values for decanoic acid vesicles.42,51
Structural components of mixed fatty acid SUV's
Ultrafiltration and HPLC analyses of mixed fatty acid vesicle preparations were performed in order to gain insight into their major structural components. In these experiments ultrafiltration (3 kD MW cutoff) partially concentrated the retained solution in vesicles while leaving the soluble monomer containing filtrate partially depleted of species present in the filtered aggregates. DLS analyses of the supernatants indicated no substantial changes in the size distribution of the vesicles upon partial concentration (< 20% volume decrease of the supernatant), and a linear increase in light scattering intensity as samples became more concentrated. The bottom filtrates did not significantly scatter light in DLS analyses, indicating that vesicles neither permeated nor were extruded through the filter. Together, these observations indicate that partial concentration of the vesicle phase did not cause further aggregation or large structural perturbations that would have affected partitioning of soluble monomeric species into the vesicle phase.After filtration, the supernatants and filtrates were analyzed by HPLC as bromophenacyl ester derivatives to determine which species are retained in the vesicle aggregate phase. Fig. 3 shows that decanoic, nonanoic and octanoic acids were the primary components retained in the concentrated supernatant fractions, yielding enrichment percentages of 35–50%, 10–20% and 1–3% respectively. These measurements were performed with similar results in the mixtures of C10–C7, C10–C5, and C10–C4 acids. No apparent enrichment in the vesicle phase was detected for species with chain lengths shorter than C8. We note that this analysis can only identify the major components retained in the filtered vesicle phase. These results do not rule out the partitioning of species C8 and lower into the bilayer membranes. If such partitioning occurs, such short chain components likely make up < 1–3% of the lipid content in the mixed fatty acid vesicle bilayers (i.e. below the error limits of these measurements).
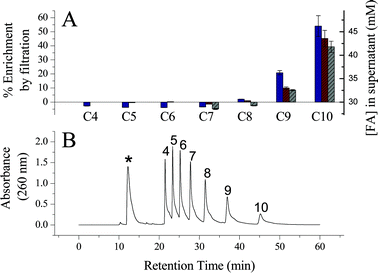 | ||
| Fig. 3 HPLC analysis of the fatty acid composition of the vesicle aggregates. Panel A. Percent enrichment (left Y-axis) and total concentration (right Y-axis) of fatty acids in the filtered vesicle containing solution. These experiments quantified individual fatty acids from the ultrafiltration of three different mixtures: C10–C7 (grey bars), C10–C5 (red bars), and C10–C4 (blue bars) fatty acids. Panel B. Representative chromatogram of p-phenacylbromide derivatized fatty acids from a C10–C4 mixture filtrate sample. The numbers above the peaks indicates the chain length of the fatty acid derivative and the asterisk above the fastest eluting peak indicates unreacted p-bromophenacyl bromide. | ||
Solute permeability and passive transport in mixed fatty acid SUV's
Restriction of small molecule trans-membrane diffusion is a key property allowing compartmentalization in model protocellular systems and in living cells. The permeability coefficients of several anionic and cationic solutes were determined by size exclusion chromatography (Fig. 4A and B) in the mixed fatty acid systems described above in order to gain a better understanding of compartmentalization in these systems (see Materials and Methods and Supporting Information for details of the encapsulation procedure and characterization of vesicles). Fluorescence micrographs of the microscopically visible population (> 1 μm) of vesicles prepared with pyranine (Fig. 5) provide verification that these solutes were contained inside vesicles following chromatographic separation from free solute. Many of the other solutes analyzed in Table 1 are non-fluorescent, and are not amenable to direct microscopic analyses. Encapsulation was inferred for these species based on the similar chromatographic behavior of vesicle encapsulated preparations from these solutes to those of pyranine and other fluorescent solutes (e.g. Ru(dcb)3Cl2) for which both microscopic and chromatographic lines of evidence support encapsulation. Further chromatographic evidence disproving that these solutes were merely associated with the outside of the vesicle membranes is provided as Supporting Information.†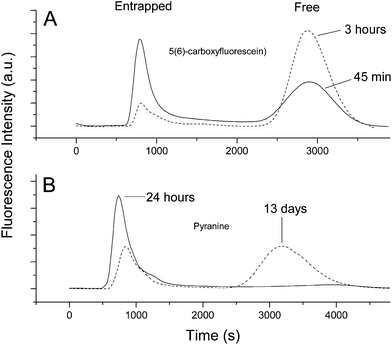 | ||
| Fig. 4 Size exclusion chromatography (Sephadex G-25) of encapsulated 5(6)-carboxyfluorescein (Panel A) and pyranine (panel B). Chromatograms demonstrate the relative leakage rates of these two solutes out of decanoic acid/sodium decanoate vesicles. Solutes entrapped in the vesicles are larger and elute first (entrapped), whereas solute that has leaked out elutes slower (free). Following the kinetics of conversion of the entrapped to free peak allows permeability coefficients to be determined. Details of these experiments are given in the Materials and Methods section. | ||
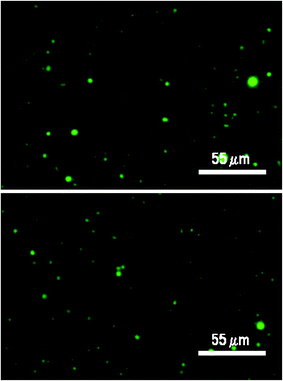 | ||
| Fig. 5 Narrow field views (1000× oil immersion) of pyranine encapsulated vesicles made from 30 mM decanoic acid, 50 mM phosphate, pH 7.25. See Supporting Information for details.† | ||
| Solute | C10 (cm s−1) | C10–C8 (cm s−1) | C10–C6 (cm s−1) | log Pa/charge |
|---|---|---|---|---|
| a log P values are expressed as the log of partitioning between octanol and water. Values for 5(6)-carboxyfluorescein and pyranine are from ref. 74 and the value given from Ru(bpy)32+ from ref. 75. n.s. indicates no known solubility in octanol. | ||||
| 5(6)-CF | 3.6 × 10⁻⁹ | 2.7 × 10⁻⁹ | 4.0 × 10⁻⁹ | −3.45/−1 |
| Pyranine | 1.5 × 10⁻¹² | 1.3 × 10⁻¹² | 4.6 × 10⁻¹² | −4.95/−3 |
| Fe(CN)63− | >1.9 × 10⁻¹¹ | >1.9 × 10⁻¹¹ | >1.3 × 10⁻¹¹ | n.s./−3 |
| Ru(dcbpy)34− | >1 × 10⁻¹⁰ | — | — | n.s./−4 |
| Ru(bpy)32+ | n.d. | — | — | −2.5/+2 |
Table 1 shows permeability coefficients for the encapsulated anionic solutes potassium ferricyanide, pyranine, and 5(6)-carboxyfluorescein (5(6)-CF) in mixed fatty acid vesicle systems. The permeability of these solutes is related to their overall charge and relative ability to partition into organic solvents, represented by the water
:octanol partition coefficients in Table 1. 5(6)-CF exhibited the highest permeability of the anionic solutes tested (Pavg = ∼10−9 cm s−1), which is attributed to equilibrium with its neutral form through protonation (pKa = 6.5) and isomerization to the neutral lactone.56 In contrast, at pH 7.2 the water soluble dye pyranine is in equilibrium between its tetra-anionic and tri-anionic forms, and is highly water soluble, causing a large electrostatic barrier to passive diffusion through the negatively charged fatty acid membrane, Pavg = ∼3 × 10⁻¹² cm s−1. Likewise, FeCN63− is expected to have low trans-membrane diffusion rates as it exhibits zero solubility in organic solvents, which is confirmed by its low permeability coefficient, Pavg > 1 × 10⁻¹¹ cm s−1. Similar values for Fe(CN)63− permeability have also been reported in phospholipid vesicles.57 Lastly, Table 1 also demonstrates that permeability coefficients were similar between C10, C10–C8, and C10–C6 mixed fatty acid vesicle preparations.
Repeated attempts at encapsulating the cationic species Ru(bpy)32+ using size exclusion chromatography failed to yield the desired solute encapsulated vesicles, although encapsulation of Ru(bpy)32+ has been reported in dihexadecyl phosphate58 and phospholipid vesicles59 under certain conditions. The tetra-anionic Ru(5,5′-dicarboxy-2,2-bpy)34− species was, however, encapsulated in decanoic acid vesicles efficiently for at least 6–12 h after the initial separation from free solute (P > 1 × 10⁻¹⁰ cm s−1). It is inferred that the cationic solute, Ru(bpy)32+, has a relatively high permeability through such membranes and leaked out during attempted chromatographic separation from the free Ru(bpy)32+ species. A reasonable explanation for these results is that ion pairing with deprotonated fatty acid species facilitates trans-membrane diffusion of cationic solutes as a net neutral ion-paired species, as has been previously proposed for the fatty acid-assisted alkali metal trans-membrane diffusion.25,60
Incorporation and reactivity of PAH species in mixed fatty acid vesicles
The incorporation and fluorescence properties of representative PAH species in mixed short chain fatty acid vesicles were next studied to determine their membrane solubility and effects on vesicle phase stability. Naphtho[2,3a]pyrene (NP) and perylene were chosen as representative PAH species for their similarities to the extended PAH structures observed in analyses of chondrites,21 as well as their favorable photophysical and photoredox properties (e.g. visible/near UV light excitation, relatively stable cation and anion radical forms).Incubation of crystalline NP or perylene with decanoic acid vesicles (50 mM, pH 7.2) partially solubilized the crystalline PAH into the aqueous phase, yielding bulk concentrations of 342 and 201 nM for NP and perylene, respectively. Similar results were obtained whether incubations were carried out overnight or for 14 days. Bulk PAH solubility from the crystalline phase in mixed C10 through C8 and C10 through C6 vesicle preparations also yielded similar results, e.g. ∼100–300 nM PAH solubilized. PAH solubility in vesicle suspensions could be further increased several fold, into the μM range, if added as an acetonitrile stock solution (see below). DLS measurements and CVC titrations indicate negligible perturbations to the vesicle structure and aggregation properties at these concentrations, with similar results being obtained in the C10, C10–C8 and C10–C6 mixed vesicle systems. X-ray diffraction measurements also confirmed that negligible perturbations occurred to the bilayer d-spacing of hydrated membrane films containing far higher concentrations of these PAH species (see Supporting Information†). Ultrafiltration of the PAH solubilized vesicle preparation yielded filtrates nearly absent of fluorescence attributable to the PAH species, whereas strong PAH fluorescence was observed in the vesicle-containing supernatants.
Lastly Fig. 6 shows that excitation and emission spectra of the PAH solubilized vesicle preparations exhibited sharp peaks attributable to the vibronic structure of the PAH excited electronic states. These spectra indicate a relatively hydrophobic environment for these chromophores and the absence of emission from excimer species. These results indicate that the PAH species were solubilized within the hydrophobic bilayer of these vesicles, with little or no PAH being found in the bulk aqueous medium.
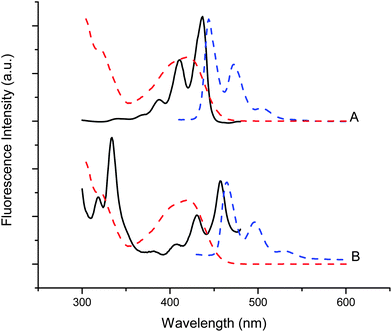 | ||
| Fig. 6 Excitation (black lines, 510 nm em) and emission (blue dashed lines, 410 nm ex) spectra of perylene (A) and 2,3a-naphthopyrene (B) solubilized in decanoic acid vesicles with encapsulated Fe(CN)63−. The absorbance spectrum of Fe(CN)63− (red dashed line) is also shown to illustrate the inner filter effect arising from its competing absorbance over the sensitizers. | ||
Combining the DLS data, CVC titrations, and fatty acid headgroup areas obtained from crystallographic61 and diffraction studies62 allows an estimation of the PAH/vesicle ratio (see Supporting Information†). This ratio was approximately 10 molecules of PAH per vesicle for preparations containing 50 mM decanoic acid.
Photochemical reactivity of PAH species in fatty acid membranes
A simple photochemical trans-membrane charge transfer reaction (Scheme 2) using membrane solubilized naphtho[2,3a]pyrene and perylene was investigated in order to assess whether or not these species are viable catalysts for a primitive form of energy transduction in this specific membrane system (e.g. simple establishment of a trans-membrane redox gradient). When incorporated into FeCN63− encapsulated vesicles, trans-membrane photoinduced electron transfer occurred in the presence of a suitable soluble electron donor in the external medium, in this case membrane impermeable EDTA, which has been widely used as a sacrificial reductant in similar reactions.63–66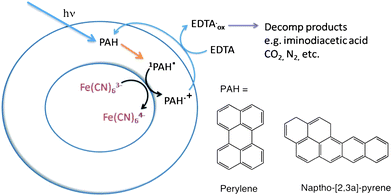 | ||
| Scheme 2 Proposed reaction scheme for trans-membrane photoredox catalyzed by membrane solubilized PAH species. | ||
Fig. 7 shows the change in the absorbance spectra during the complete reduction of encapsulated FeCN63− catalyzed by naphtho[2,3a]pyrene under broad band 365 nm excitation (bandwidth ∼50 nm). Reaction rates (Table 2) were related to the amount of PAH photocatalyst solubilized and light intensity. In the absence of either PAH or 365 nm excitation, reaction rates decrease by > 90%. Fe(CN)63− reduction rates did not vary by more than an order of magnitude for any of the conditions tested and remained in the < 10 μM min−1 range with quantum efficiencies of ∼1% or less. The true quantum efficiency using the number of photons actually absorbed by the PAH phosensitizers was likely much higher due to their low concentrations (hence low absorbance) and inner filter effects from competing absorbance with Fe(CN)63− in these preparations (Fig. 5). DLS analyses of the reaction mixtures post illumination showed little change in aggregate size distributions and scattering intensity, providing evidence that the vesicles maintain structural integrity over the course of these reactions.
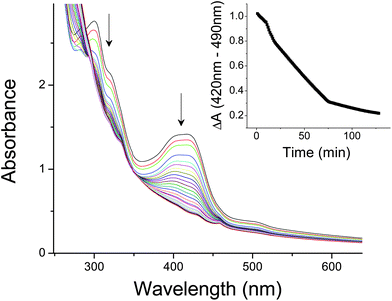 | ||
| Fig. 7 Photocatalytic reduction of Fe(CN)63− (101 mM) encapsulated inside decanoic acid vesicles (50 mM decanoic acid, pH 7.2) catalyzed by 2,3a-naphthopyrene (1 μM) using external EDTA (22.7 mM) as a sacrificial donor. Arrows denote the direction of absorbance change over time. Inset: Wavelength difference kinetics (420 nm minus 490 nm) of the reduction process. Rates were taken during the linear phase of the kinetic traces. | ||
| [NpPy] (μM) | [Fe(CN)63−] (mM) | Rate (μM min−1) | TN (min−1) | Φ SS |
|---|---|---|---|---|
| 2 | 151 | 8.9 | 4.5 | 0.017 |
| 2 | 179 | 8.0 | 4.0 | 0.016 |
| 1 | 101 | 4.3 | 4.3 | 0.008 |
| 0.5 | 132 | 3.2 | 6.3 | 0.006 |
| [Perylene] (μM) | ||||
| 2 | 175 | 5.6 | 2.3 | 0.011 |
| 2 | 74 | 2.9 | 1.5 | 0.006 |
| 1 | 145 | 6.4 | 6.4 | 0.013 |
| 0.5 | 92 | 3.5 | 7.0 | 0.007 |
A detailed mechanistic understanding of trans-membrane charge transfer in this system is presently incomplete and is the subject of ongoing studies. Nonetheless, several salient observations allow for a preliminary mechanistic proposal: 1) EDTA did not quench fluorescence of the membrane solubilized sensitizers NpPy and Perylene indicating that electron transfer from the EDTA/EDTAox couple to the singlet excited state was rather slow compared with radiative decay, 2) overall rates exhibit a non-linear sensitivity to both sensitizer and encapsulated Fe(CN)63− concentrations, and 3) with either PAH the estimated driving force for oxidative quenching by Fe(CN)63− is greater than that for reductive quenching by EDTA (see Supporting Information†). We thus propose that the reaction proceeds via initial photoinduced oxidation of the membrane bound PAH by Fe(CN)63− to form a PAH˙+ species, which then goes on to oxidize EDTA on the opposite side of the membrane. The details of trans-membrane movement of the cation radical PAH˙+ species is still speculative, but may involve either direct diffusion or electron hopping mechanisms by comparison with literature reports (see63 and references therein).
The near complete reduction of encapsulated Fe(CN)63− indicates facile diffusion of sodium and other cations across the membrane, which are needed in the internal volume to maintain electroneutrality during charge transport. In these experiments up to 150 mM Fe(CN)64− is formed in the internal volume, creating (minimally) a −300 mV trans-membrane electric potential which would counter further movement of charges across the membrane. Such electric gradients are alleviated by the unique permeability of fatty acid vesicles to alkali cations.25,60
The significance and implications of fatty acid membrane compartmentalization and PAH catalyzed charge transfer to prebiotic and biomimetic systems
The ability of a compartmentalized system to actively transport and store trans-membrane ionic and osmotic gradients is an essential energy transduction mechanism in all living cells. This work demonstrates two essential features of this energy transduction mechanism, compartmentalization and catalytic transport, in a fatty acid based model system whose composition is relevant to prebiotic systems.67 These results demonstrate the formation of mixed fatty acid vesicles from mixtures of decanoic, nonanoic and octanoic acids with molar ratios of approximately ∼20:4:1, respectively, determined from analyses of fatty acid enrichment in filtered vesicle phases. This finding provides evidence that short chain amphiphilic components of carbonaceous chondrites besides decanoic acid might serve as building blocks for membranous material, although these shorter chain FA components still rely on decanoic acid to provide the majority of the driving force for vesicle formation and to serve as a major structural component of these membranes. Importantly, this work reveals the appropriate conditions for solute encapsulation in short chain FA systems, demonstrating that these vesicles are indeed capable of providing a compartmentalization function for a restricted set of water soluble, polyanionic small molecule solutes. This particular class of solutes exhibits the two key properties that retard passage across the membrane, high negative charge density and unfavorable solubility in organic solvents, which is demonstrated by the results obtained in Table 1. Although the anionic hydrophilic species pyranine and Fe(CN)63− are retained for long periods, the organic soluble cationic species Ru(bpy)32+ does not encapsulate well, if at all, in these membranes. Similar fast permeability behavior for Ru(bpy)32+ is observed in the basic, negatively charged, form of dihexydecyl phosphate membranes,58,68 whereas slow leakage is observed in the acidic, neutral, form of the same membranes. These results and observations show that membrane surface charge is an important contributor to membrane permeability in vesicle systems composed of short chain acidic amphiphiles.
These results also suggest that the fatty acid membrane leakage mechanism consists of at least two barriers to passive trans-membrane transport,69 the first being the electrostatic interaction of the solute with the lipid headgroup region, and second, partitioning of the solute into the aliphatic chain region of the bilayer. Charge–charge repulsion between the anionic solutes and the carboxylate headgroups on the membrane surface tends to lead to a high barrier in the first step for anionic solutes, but a low barrier for cationic solutes, which strongly adsorb to the membrane surface.58,63,68,70,71 The second barrier to transport can be understood in terms of the Born energy for partitioning of the solute into low dielectric region of the bilayers, which can be predicted qualitatively using water:octanol partition coefficients. An additional factor affecting the permeability of cationic species is ion pairing with deprotonated fatty acids followed by trans-membrane diffusion as a net neutral species, although this additional mechanism is at present speculative. Regardless, the relative permeability of the solutes discussed here are easily rationalized by the interplay between the molecular properties of the solute and these electrostatic barriers.
The proposed mechanism of passive transport in fatty acid membranes raises additional issues for their potential function as protocellular membranes. While encapsulation of anionic species supports a plausible compartmentalization function for fatty acid membranes in prebiotic systems, the high permeability of neutral and cationic species suggests just the opposite (except in the unlikely scenario in which all solutes in the prebiotic world were anionic). On the other hand, such selective permeability may have led to certain evolutionary advantages in terms of formation of solute gradients. We therefore suggest that early prebiotic membranes, if fatty acid based, likely contained additional co-surfactants with either longer chain lengths, or alcohol and cationic co-surfactants to confer additional selectivity in solute permeability.5,33 Such additives should also dramatically lower the CVC values of the pure decanoic acid and mixed fatty acid systems, thus addressing the prebiotic relevance of the relatively high CVC values in short chain fatty acid systems.
Might PAH containing membranes function as energy transduction catalysts?
Trans-membrane charge transfer from external EDTA to internal Fe(CN)63− is a well studied prototype reaction for charge transport in vesicle systems (see63,72,73 and references therein), and is used here to test whether short chain fatty acid membranes can serve as a platform for such reactions. Fatty acid vesicle membranes appear to be well suited to supporting this type of catalysis, and are likely able to support other forms of trans-membrane electron transfer given the appropriate redox reagents. Exactly how a prebiotic system, or synthetic biomimetic system for that matter, might use trans-membrane redox to drive further down stream reactions remains unresolved. Photo-oxidative activation of small molecule feedstocks, such as simple alcohols, might be an attractive way of trapping redox energy in the form of chemical bond energy, although the means for converting the one-electron photochemistry driving charge transfer into the net-two-electron chemistry required for most organic transformations remains elusive. Work towards designing an electron transfer “gearing mechanism” of this type is currently underway.Acknowledgements
The authors would like to thank Drs Hans-Joachim Ziock, Martin Hanczyc, Sarah Mauer, and Steen Rasmussen for stimulating discussions regarding this work. Funding for this work was provided by the NASA Exobiology Program, grant # NNH08AI881.References
- T. F. Zhu and J. W. Szostak, J. Am. Chem. Soc., 2009 Search PubMed.
- M. M. Hanczyc and J. W. Szostak, Curr. Opin. Chem. Biol., 2004, 8, 660–664 CrossRef CAS.
- P. A. Monnard and D. W. Deamer, Anat. Rec., 2002, 268, 196–207 CrossRef CAS.
- C. L. Apel, D. W. Deamer and M. N. Mautner, Biochim. Biophys. Acta, Biomembr., 2002, 1559, 1–9 CrossRef CAS.
- S. S. Mansy and J. W. Szostak, Proc. Natl. Acad. Sci. U. S. A., 2008, 105, 13351–5 CrossRef CAS.
- Y. Huang, Y. Wang, M. R. Alexandre, T. Lee, C. Rose-Petruck, M. Fuller and S. Pizzarello, Geochim. Cosmochim. Acta, 2005, 69, 1073–1084 CrossRef CAS.
- E. Anders, Nature, 1989, 342, 255–7 CAS.
- S. J. Clemett, X. D. Chillier, S. Gillette, R. N. Zare, M. Maurette, C. Engrand and G. Kurat, Origins Life Evol. Biosphere, 1998, 28, 425–48 CrossRef CAS.
- J. G. Lawless, Life Sci. Space Res., 1980, 18, 19–27 Search PubMed.
- J. Llorca, Int. Microbiol., 2005, 8, 5–12 Search PubMed.
- M. Maurette, Origins Life Evol. Biosphere, 1998, 28, 385–412 CrossRef CAS.
- S. Pizzarello, Acc. Chem. Res., 2006, 39, 231–7 CrossRef.
- S. Pizzarello, Chem. Biodiversity, 2007, 4, 680–93 CrossRef CAS.
- M. A. Sephton, Nat. Prod. Rep., 2002, 19, 292–311 RSC.
- M. A. Sephton, Philos. Trans. R. Soc. London, Ser. A, 2005, 363, 2729–42 CrossRef CAS.
- W. R. Hargreaves and D. W. Deamer, Biochemistry, 1978, 17, 3759–68 CrossRef CAS.
- S. Epstein, R. V. Krishnamurthy, J. R. Cronin, S. Pizzarello and G. U. Yuen, Nature, 1987, 326, 477–9 CrossRef CAS.
- L. Becker, D. P. Glavin and J. L. Bada, Geochim. Cosmochim. Acta, 1997, 61, 475–81 CrossRef CAS.
- D. W. Deamer, Adv. Space Res., 1992, 12, 183–9 CrossRef CAS.
- P. Thaddeus, Philos. Trans. R. Soc. London, Ser. B, 2006, 361, 1681–7 CrossRef CAS.
- M. H. Briggs and G. Mamikunian, Space Sci. Rev., 1962, 1, 647–682.
- M. Pasek and D. Lauretta, Origins Life Evol. Biosphere, 2008, 38, 5–21 CrossRef CAS.
- D. C. Whittet, Origins Life Evol. Biosphere, 1997, 27, 249–62 CrossRef CAS.
- N. Berclaz, M. Muller, P. Walde and P. L. Luisi, J. Phys. Chem. B, 2000, 105, 1056–1064.
- I. A. Chen and J. W. Szostak, Proc. Natl. Acad. Sci. U. S. A., 2004, 101, 7965–70 CrossRef CAS.
- P. L. Luisi, P. S. Rasi and F. Mavelli, Artif. Life, 2004, 10, 297–308 CrossRef.
- S. S. Mansy, J. P. Schrum, M. Krishnamurthy, S. Tobe, D. A. Treco and J. W. Szostak, Nature, 2008, 454, 122–5 CrossRef CAS.
- D. P. Summers, J. Noveron and R. C. Basa, Origins Life Evol. Biosphere, 2009, 39, 127–40 CrossRef CAS.
- T. Namani and D. W. Deamer, Origins Life Evol. Biosphere, 2008, 38, 329–41 CrossRef CAS.
- P. A. Monnard and D. W. Deamer, Methods Enzymol., 2003, 372, 133–51 CAS.
- P. A. Monnard, C. L. Apel, A. Kanavarioti and D. W. Deamer, Astrobiology, 2002, 2, 139–52 CrossRef CAS.
- I. A. Chen, K. Salehi-Ashtiani and J. W. Szostak, J. Am. Chem. Soc., 2005, 127, 13213–13219 CrossRef CAS.
- S. E. Maurer, D. W. Deamer, J. M. Boncella and P.-A. Monnard, Astrobiology, 2009, 9, 979–987 CrossRef CAS.
- M. S. DeClue, P.-A. Monnard, J. A. Bailey, S. E. Maurer, G. E. Collis, H.-J. Ziock, S. Rasmussen and J. M. Boncella, J. Am. Chem. Soc., 2009, 131, 931–933 CrossRef CAS.
- P. L. Luisi, Anat. Rec., 2002, 268, 208–14 CrossRef CAS.
- I. Budin, R. J. Bruckner and J. W. Szostak, J. Am. Chem. Soc., 2009, 131, 9628–9 CrossRef CAS.
- I. A. Chen and J. W. Szostak, Biophys. J., 2004, 87, 988–98 CrossRef CAS.
- D. P. Cistola, D. Atkinson, J. A. Hamilton and D. M. Small, Biochemistry, 2002, 25, 2804–2812.
- D. P. Cistola, J. A. Hamilton, D. Jackson and D. M. Small, Biochemistry, 2002, 27, 1881–1888.
- M. N. G. de Mul, H. T. Davis, D. F. Evans, A. V. Bhave and J. R. Wagner, Langmuir, 2000, 16, 8276–8284 CrossRef CAS.
- P. A. Kralchevsky, K. D. Danov, C. I. Pishmanova, S. D. Kralchevska, N. C. Christov, K. P. Ananthapadmanabhan and A. Lips, Langmuir, 2007, 23, 3538–3553 CrossRef CAS.
- K. Morigaki, P. Walde, M. Misran and B. H. Robinson, Colloids Surf., A, 2003, 213, 37–44 CrossRef CAS.
- S. Goldstein and J. Rabini, J. Photochem. Photobiol., A, 2008, 193, 50–55 CrossRef CAS.
- O. Schwarz, D. van Loyen, S. Jockusch, N. Turro and H. Dürr, J. Photochem. Photobiol., A, 2000, 132, 91–98 CrossRef CAS.
- J. M. Gonzalez-Manas, P. Kaschny and F. M. Goni, J. Phys. Chem., 2002, 98, 10650–10654 Search PubMed.
- H. D. Durst, M. Milano, E. J. Kikta Jr.,, S. A. Connelly and E. Grushka, Anal. Chem., 1975, 47, 1797–1801 CrossRef CAS.
- H. Komatsu and P. L.-G. Chong, Biochemistry, 1998, 37, 107–115 CrossRef CAS.
- J. J. Alexander and H. B. Gray, J. Am. Chem. Soc., 2002, 90, 4260–4271.
- W. D. Bowman and J. N. Demas, J. Phys. Chem., 2002, 80, 2434–2435 Search PubMed.
- K. Morigaki, P. Walde, M. Misran and B. H. Robinson, Colloids Surf., A, 2003, 213, 37–44 CrossRef CAS.
- T. Namani and P. Walde, Langmuir, 2005, 21, 6210–6219 CrossRef CAS.
- S. W. Smith and B. D. Anderson, Pharm. Res., 1993, 10, 1533–43 CAS.
- M. Fieldes and L. Hartman, Proc. R. Soc. London, Ser. A, 1955, 233, 195–202 CrossRef CAS.
- F. Francis, S. H. Piper and T. Malkin, Proc. R. Soc. London, Ser. A, 1930, 128, 214–252 CrossRef CAS.
- S. Y. Shiao, V. Chhabra, A. Patist, M. L. Free, P. D. T. Huibers, A. Gregory, S. Patel and D. O. Shah, Adv. Colloid Interface Sci., 1998, 74, 1–29 CrossRef CAS.
- J. Barbet, P. Machy, A. Truneh and L. D. Leserman, Biochim. Biophys. Acta, Biomembr., 1984, 772, 347–356 CrossRef CAS.
- I. Stanish, D. A. Lowy, L. M. Tender and A. Singh, J. Phys. Chem. B, 2002, 106, 3503–3509 CrossRef CAS.
- M. Castaing, J. L. Kraus and C. Ponge, Biophys. Chem., 1991, 39, 17–29 CrossRef CAS.
- W. Zhan and A. J. Bard, Anal. Chem., 2005, 78, 726–733.
- Y. Zeng, X. Han, P. Schlesinger and R. W. Gross, Biochemistry, 1998, 37, 9497–508 CrossRef CAS.
- A. Bond, New J. Chem., 2004, 28, 104–114 RSC.
- A. Datta, J. Kmetko, A. G. Richter, C. J. Yu, P. Dutta, K. S. Chung and J. M. Bai, Langmuir, 1999, 16, 1239–1242.
- S. V. Lymar, V. N. Parmon and K. I. Zamaraev, Topics in Current Chemistry, 1991, 159, 1–59 CAS.
- W. Ford, J. Otvos and M. Calvin, Proc. Natl. Acad. Sci. U. S. A., 1979, 76, 3590–3593 CAS.
- L. Hammarstroem, M. Almgren and T. Norrby, J. Phys. Chem., 1992, 96, 5017–5024 CrossRef.
- C. Laane, W. Ford, J. Otvos and M. Calvin, Proc. Natl. Acad. Sci. U. S. A., 1981, 78, 2017–2020 CAS.
- D. W. Deamer, Microbiol. Mol. Biol. Rev., 1997, 61, 239–61 CAS.
- Y. M. Tricot, D. N. Furlong and W. H. F. Sasse, Aust. J. Chem., 1984, 37, 1147–1156 CAS.
- B. S. Prabhananda and M. H. Kombrabail, J. Phys. Chem. B, 1998, 102, 8619–8628 CrossRef CAS.
- R. F. Khairutdinov and J. K. Hurst, J. Am. Chem. Soc., 2001, 123, 7352–9 CrossRef CAS.
- S. V. Lymar, R. F. Khairutdinov, V. A. Soldatenkova and J. K. Hurst, J. Phys. Chem. B, 1998, 102, 2811–2819 CrossRef CAS.
- J. K Hurst in Kinetics and Catalysis in Microheterogenous Systems; M. Gratzel, K. Kalyanasundaram, ed.; Marcel Dekker Inc.: New York, NY; Vol. Surfactant Science Series: 38, pp 183–222 Search PubMed.
- J. R. Escabi-Perez, A. Romero, S. Lukac and J. H. Fendler, J. Am. Chem. Soc., 1979, 101, 2231–2233 CrossRef CAS.
- K. Lahnstein, T. Schmehl, U. Rüsch, M. Rieger, W. Seeger and T. Gessler, Int. J. Pharm., 2008, 351, 158–164 CrossRef CAS.
- C. A. Pucket and J. K. Barton, J. Am. Chem. Soc., 2007, 129, 46–47 CrossRef CAS.
Footnote |
| † Electronic supplementary information (ESI) available: Supporting Information includes fluorescence micrographic, chromatographic, dynamic light scattering, thermodynamic, and X-ray diffraction data and analyses. See DOI: 10.1039/c0sc00575d |
| This journal is © The Royal Society of Chemistry 2011 |