Does supramolecular ordering influence exciton transport in conjugated systems? Insight from atomistic simulations†
Theodoros A.
Papadopoulos‡
*a,
Luca
Muccioli
*b,
Stavros
Athanasopoulos
*c,
Alison B.
Walker
a,
Claudio
Zannoni
b and
David
Beljonne
c
aDepartment of Physics, University of Bath, BA2 7AY, Bath, U.K.. E-mail: tp239@bath.ac.uk
bDipartimento di Chimica Fisica e Inorganica and INSTM, Università di Bologna, IT-40136, Bologna, Italy. E-mail: luca@fci.unibo.it
cLaboratory for Chemistry of Novel Materials, University of Mons, B-7000, Mons, Belgium. E-mail: stavrosa@averell.umh.ac.be
First published on 11th March 2011
Abstract
We have developed a theoretical platform for modelling temperature-dependent exciton transport in organic materials, using indenofluorene trimers as a case study. Our atomistic molecular dynamics simulations confirm the experimentally observed occurrence of a liquid crystalline smectic phase at room temperature and predict a phase transition to the isotropic phase between 375 and 400 K. Strikingly, the increased orientational disorder at elevated temperatures barely affects the ability of excitons to be transported over large distances, though disorder influences the directionality of the energy diffusion process. Detailed quantum-chemical calculations show that this result arises from a trade-off between reduced excitonic couplings and increased spectral overlap at high temperatures. Our results suggest that liquid crystalline oligomeric materials could be promising candidates for engineering optoelectronic devices that require stable and controlled electronic properties over a wide range of temperatures and supramolecular arrangements.
1. Introduction
Organic electronics is recognised as a disruptive technology, offering new applications rather than competing head to head with inorganic counterparts. Optoelectronic devices, such as organic light emitting diodes (OLEDs),1 field effect transistors,2 chemical sensors3 and solar cells4,5 offer novel performance at low cost. However, significant enhancements to performance and lifetime are required if these devices are to fulfil this potential. Although there has been a considerable improvement in the efficiencies of organic devices over the last years, most advances are due to unsystematic development of novel materials implemented in new architectures.6 Such efforts risk being fragmented or even ill-directed in the absence of effective routes for predicting, rather than discovering, the optoelectronic properties of the materials. New materials result in new morphologies and physical properties,7 and since progress and understanding run in tandem, tailoring charge and energy transport properties and improving the efficiency requires the description of both the morphological and electronic properties using physical models that retain information at an atomistic level.Energy transfer occurs via diffusion of excitons, electronically excited states of molecules. Excitons are created by the absorption of light or by binding of free charges that come within close proximity and play a key role in the operation and degradation of organic devices. In organic blend and hybrid photovoltaic devices, excitons must diffuse to an interface between the component materials where they can be dissociated into free charges. In OLEDs and chemical sensors, excitons need to move around until they decay by fluorescence at a desired site. The efficiency of these processes is to a large extent determined by the exciton diffusion length Ld, the average distance over which an exciton moves before it decays. Ld is normally obtained from the exciton diffusion coefficient DE and the radiative lifetime of an excitation τL as  , but here we obtain Ld by computing exciton trajectories. To realize exciton motion over long distances, fundamental insights into the factors that govern Ld are essential. Singlet excitons have been shown to play a major role in device degradation8 and thus it is necessary to predict how their concentration profile changes during device operation.
So far, improvements in organic device performance have been hindered due to a lack of detailed theoretical understanding of the combined effects of morphological and electronic properties on energy transport. This is partly due to the complexity of the materials involved and the large number of parameters in play. One way to overcome some of these difficulties by reducing the number of uncontrolled parameters is the oligomer approach.9 Systems that are built up of single spectroscopic units and have well defined conjugation lengths, are largely free from chemical and structural defects and exhibit a high degree of orientational and/or positional order. Energy transfer in such controlled morphologies benefits from reduced energetic disorder, the latter being one of the main limiting factors for exciton diffusion.10 Hence conjugated oligomers, due to their reduced complexity, could work as prototypes for validating theory through comparison with experiment.
The purpose of this paper is to provide a protocol for calculating exciton transport properties in conjugated materials and to test how sensitive the transport properties of oligomeric materials are to changes in the morphology and temperature. We employ methods from statistical physics and quantum chemistry that allow us the exciting possibility of linking electronic structure to the (opto)electronic properties. The morphological properties are evaluated with atomistic molecular dynamics (MD) simulations, while exciton transfer rates are directly evaluated via correlated quantum-chemical calculations and transport properties are sampled with a kinetic Monte Carlo (MC) model. We can therefore avoid any a priori assumptions on molecular conformations and packing.
The system chosen to validate the theoretical approach is an indenofluorene trimer (IF3) that has recently been studied experimentally and was shown to form smectic mesophases.11 We show first that our MD simulation results for the morphology are consistent with wide angle X-ray scattering data and predict a phase transition from smectic to the isotropic phase in fair agreement with experiment.11 We then demonstrate that in a system with limited energetic disorder, the decrease in orientational order with increasing temperature does not affect the magnitude of the diffusion length Ld. We also find, however, that the directionality of the exciton dynamics is affected resulting in a loss of the transport anisotropy at high temperatures. These results help to build an understanding of how morphology and chemical structure influence exciton transport, which is an essential prerequisite in order to exploit the potential applications of organic materials in optoelectronic devices.
2. Computational details
2.1. Molecular Dynamics simulations
Molecular Dynamics simulations of bulk IF3 samples in the NPT ensemble were conducted with the NAMD code,12 integrating the equations of motion with a time step of 2 fs for short range and bonded interactions, and 4 fs for long range non bonded interactions. Both pressure and temperature were controlled with weak coupling schemes.13 Potential energy was in the CHARMM form,14 composed of harmonic stretching and bending terms, dihedrals described by a series of cosines, and Coulomb and Lennard-Jones terms for non-bonded interactions. Electrostatic interactions were calculated with the particle mesh Ewald method with a mesh spacing of about 1.5 Å,15 whilst a cutoff of 10 Å was employed in the evaluation of Lennard-Jones terms. IF3 molecules were described at united atom (UA) level, i.e., without explicit hydrogens. This approach offers the advantage of reducing the number of centers while maintaining an accurate description of the static physical properties.16–18 The dynamics take place faster than in experiment,17,19 improving the phase sampling and thus reducing the equilibration times.Atomic charges at the equilibrium geometry and the torsional potential for a given angle ϕ between two indenofluorene monomers were calculated from density functional theory (DFT) implemented in the Turbomole 5.9 code20 with the 6-31G basis set and the B3LYP functional (Fig. 1). In all these calculations octyl chains were omitted and replaced by hydrogens. To comply with the UA model, each UA center was given the sum of the charges of the corresponding carbon and its geminal hydrogens, charges on chemically equivalent centers were equalized and alkyl chain charges were set equal to zero following ref. 18. To reproduce the ab initio torsional potential with the classical force field we used the approach described in ref. 21 to take into account the non-bonded interaction contributions. Aromatic carbons without implicit hydrogens and aliphatic carbons were described with the AMBER UA force field,22,23 while aromatic carbons with one implicit hydrogen were parameterized following ref. 24.
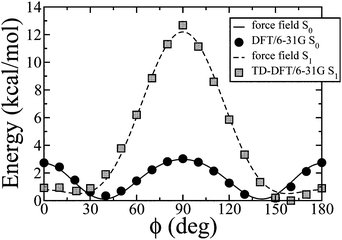 | ||
| Fig. 1 Ground and excited state torsional potential calculated at the B3LYP level using the 6-31G basis set. | ||
A low density (≈0.1 g cm−3) sample of 128 IF3 molecules arranged parallel to each other was built and quickly compressed applying a pressure of 1000 atm at 400 K until the system reached approximate values for the density of 1 g cm−3, box size of 90 × 80 × 60 Å, smectic order parameter τ = 0.4 and nematic order parameter P2 = 0.76 with the director oriented along the z axis. This configuration was used as starting geometry for simulation runs at 350, 375, 400, 425, 450, 475, 500 K and pressure of 1 atm. At the three higher temperatures the order parameter dropped to isotropic values after 20–40 ns and the runs were not continued. For the other temperatures we performed equilibration runs of 100 ns, during which P2 reached a stationary value after an initial decrease, with the exception of 425 K which exhibited a continuous slow decay. After this preliminary step, the box sizes were doubled along the z axis and the new 256-molecule samples were simulated at the same temperatures and pressure. Two additional temperatures, 300 and 325 K, were started from the 350 K configuration. These large samples were further equilibrated until reaching constant density and P2; this required from 80 to 300 ns of simulation. Finally, production runs were performed, with duration decreasing with temperature, ranging from 170 ns at 300 K to 60 ns at 500 K; during the runs, configurations were stored with a frequency of 100 ps and afterwards processed for calculating the observables reported in this work.
2.2. Quantum-chemical calculations and Monte Carlo energy transport simulations
In the weak coupling regime appropriate here (vide infra), excitons are localised on single molecular sites and exciton transfer takes place via resonant energy transfer from a donor molecule D in the excited state to an acceptor molecule A in its ground state.25 The rate of hopping is26,27 | (1) |
| JDA = ∫∞0FD(ω)AA(ω)dω. |
where the sum runs over the donor
 and acceptor
  atomic positions produced by the MD simulation, ρ are the atomic transition charge densities and ε0 the vacuum permittivity. The transition charges have been computed through correlated coupled cluster calculations,32 using the intermediate neglect of differential overlap (INDO) Hamiltonian,33 for all 256 chromophores in the sample in a few representative configurations of the morphology at each temperature.
Absorption and emission spectra of indenofluorene trimers at different temperatures have been obtained by means of ab initio simulations. DFT and TD-DFT approximation levels were used for the equilibrium ground and first excited state geometries and frequencies, respectively. The geometric distortions between the ground and excited state geometries were mapped onto the ground and excited state normal modes for the absorption and emission spectra respectively. All vibrational modes except librations were used in an undistorted displaced harmonic oscillator model.30 We used the procedures of ref. 34 to treat librational modes, as these modes are soft, causing large distortions when going from the ground state to the excited state. Anharmonic effects are taken into account by numerical diagonalization of the nuclear Hamiltonian obtained from the (TD-)DFT calculations. This model leads to a natural description of the mirror asymmetry between the absorption and emission spectra as well as of the Stokes shift. The line shape is not treated here as an adjustable parameter but is largely a consequence of the thermal population of the libration modes.34 Each molecule explores locally the torsion potential energy surface over time scales that are short compared to the exciton hopping time, contributing thereby to the dynamic homogeneous line width. Large amplitude conformational changes involving crossing the barrier at 90°, 0° and 180° occur at much longer times yielding a distribution of conformers that can be assumed to be static over the exciton lifetime. Another contribution to energetic disorder arises from the dielectric environment. It has been introduced through a random rigid shift of absorption and emission spectra, as extracted from a Gaussian distribution of standard deviation σ.
Kinetic Monte Carlo simulations suffice to model the exciton diffusion as a random walk. The model requires as an input the molecular positions, provided by the MD simulations, and exciton transfer rates between molecular sites, calculated at the quantum-chemical level. An exciton is randomly placed in the system and a waiting time to hop from oligomer i to a neighboring oligomer j is sampled from an exponential distribution 35,36:
 , where Δx, Δy and Δz are the x, y, z components of the displacement between the initial and final point on the exciton trajectory, is calculated imposing proper periodic boundary conditions. Quantities of interest such as Ld were averaged over ∼106 trajectories. This procedure gives a variance of 0.2 nm for Ld in each MD configuration.
3. Results and discussion
3.1. Phase behaviour of indenofluorene trimers
In this section we describe the temperature dependence of the bulk phase physical properties of IF3 predicted by our MD simulations. The purpose of the investigation is twofold: on the one hand to assess the microscopic structure of the material and validate it through the comparison with experimental data, on the other hand to obtain atomic coordinates for a realistic simulation of the energy transport process in the system. As for the corresponding polymer 2,8-poly-6,6′,12,12′-tetraoctyl-6,12-dihydroindeno[1,2b] fluorene,38IF trimers form a smectic phase above the glass transition temperature at 261 K and melt at 411 K.11Reproduction of this phase transition and the temperature at which it occurs with atomistic simulations is challenging39,40 so makes an important test of the simulation methodology.Starting from an ordered sample, the onset of the disordering transition was monitored through the average values of the orientational order parameter 〈P2〉 = 〈3(u·n)2 − 1〉/2 associated with the long molecular axis, u, the unit vector joining the aromatic carbons at the two ends of IF3, with respect to the phase director n.17
Fig. 2 shows that 〈P2〉 drops smoothly as T increases, until 400 K where the system becomes isotropic. Smectic order parameters 〈τn〉 characterize the nature of the mesophases through measuring the extent of positional order along the alignment direction z∥n. We obtained 〈τn〉 from a least square fitting of the scaled density function along z with the first four terms of the McMillan's expansion41:
| ρ(z)/ρ0 = 1 + 〈τ1〉cos(2πz/〈d〉)+…+〈τn〉cos(n2πz/〈d〉). | (2) |
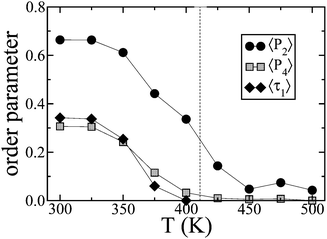 | ||
| Fig. 2 Temperature dependence of order parameters: average second and fourth order parameters 〈P2〉, 〈P4〉 and average smectic order parameter 〈τ1〉. | ||
This method provides the layer spacing d of the smectic phase, which yields a constant value of 31.5 Å, corresponding approximately to the end-to-end distance of the trimer, noting that no significant interdigitation occurs. A smectic phase at temperatures below 400 K can be seen from 〈τ1(T)〉 in Fig. 2; the higher terms 〈τ2〉 and 〈τ3〉 are much smaller but follow the same behaviour. The periodicity of the density fluctuations along z, typical of the smectic phase, and the applicability of eqn (2) can be seen more clearly in Fig. 3. The snapshot in the top left hand panel of Fig. 3 shows the molecular arrangement is typical of a smectic A phase, in which the molecular centers of masses are distributed on diffuse layers perpendicular to the ordering direction (indicated with vertical orange bars), with liquid-like positional disorder within the layers.
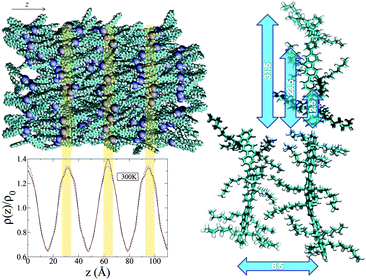 | ||
| Fig. 3 Top left panel: A snapshot of 256 IF3 molecules in the smectic phase at 300 K (top, alkyl chains omitted for clarity, hydrogen atoms artificially added, blueish spheres indicate IF3 centers of mass). Bottom left panel: The scaled density distribution function along the alignment direction z (red line). Orange vertical bars underline the correspondence of the peaks of the density distribution with the layers in the snapshot. Right panel: A schematic of the most representative distances in the smectic phase (units in Å). | ||
To investigate the effect of the phase transition on molecular mobility and for more detailed information, we calculated the autocorrelation functions Cf(t) = 〈f(0)·f(t)〉, where f can be either u (short or long molecular axes), or sin(ϕ) (Fig. 4), as Cf(t) is a measure of the overall and internal rotational dynamics. The effective decay times for f(t):42
 | (3) |
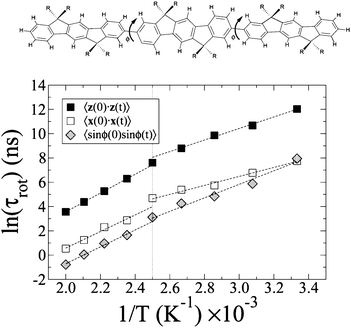 | ||
| Fig. 4 Top panel: Chemical sketch of the 6,6′,12,12′-tetraoctylindenofluorene trimer studied in this work (R = n-octyl chains), with monomer-monomer dihedral angles indicated. Bottom panel: Arrhenius plot of some rotational diffusion indicators: decay times of the autocorrelation function of the molecular axes z (black squares) and x (white squares), and of sin(ϕ) (grey rhombs) where ϕ is the torsional dihedral angle. All indicators suggest a phase transition between 375 and 400 K. | ||
The decay time of Cf(t) can be much longer than the simulation time as the rotation is progressively hindered by lowering the temperature, so we extrapolated the long-time behaviour by fitting Cf(t) with a sum of three exponentials for the first half of the simulation period. This functional form makes no assumptions about the symmetry of the rotational diffusion tensor.43 We then estimated the rotational decay time from eqn (3), replacing C(t) with its fitting function. The procedure allows to clearly identify the temperature trends of the rotational times, shown in Fig. 4, where two separate regions with different activation energy are clearly visible, at low T (smectic phase), and at high T (isotropic phase). The relaxation times in the smectic phase appear to be much longer than the simulation period, leading to some uncertainty, but they do reveal that the rotational motion in this phase is severely hindered and suggest a high viscosity. All these indicators confirm a phase transition between 375 and 400 K agreeing with the temperature behaviour of the translational diffusion coefficient shown in Fig. ESI 3.†
Our simulations have been validated through reproducing the experimental phases and thermal behaviour with reasonable accuracy so we can use them to provide details of the molecular arrangement of IF3 in the condensed phase. The intermonomer dihedral angle ϕ is of particular interest as it can influence photoluminescence through promoting or preventing intermolecular aggregation.44
Similar to oligofluorenes,45–47 gas phase oligophenyls48,49 and biphenyls dissolved in liquid crystals,50 the ground state is not planar and 〈ϕ〉 = ±38° + kπ, in the smectic and in the isotropic phase of IF3. The peaks of the distribution of ϕ can be reproduced by Gaussian functions: while their width increases linearly with temperature from 9° to 13°, it does not show significant change at the smectic-isotropic transition. As mentioned above, the torsion angles vary quickly (compared to the exciton hopping time) around the equilibrium ground-state values, Fig. 5, so that coupling to intramolecular vibrational mode is homogeneous; in contrast conformational jumps are much slower and result in decay times that span a large time domain, from ∼0.5 ns at 500 K to ∼300 ns at 300 K, Fig. 4.
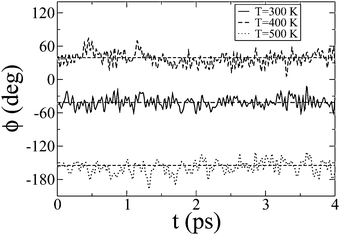 | ||
| Fig. 5 The intramolecular torsional dihedral angle ϕ as a function of time t for different temperatures. | ||
The packing of the molecules in the smectic phase is characterised by the radial distribution function (rdf) of the different atom types composing the molecule. Along the meridional direction (parallel to n) all aromatic carbon rdfs are dominated by the monomer-monomer repeating distance of 12.5 Å, in perfect agreement with the analysis of the polymer X-ray spectrum (12.5 Å);51 the small disagreement with the position of the intense meridional reflection registered for the trimer (dme = 11.7 Å)11 can be explained by the fact that the molecules are slightly bent, so even if two linked monomers are 12.5 Å apart, the third closest monomer is separated by only 23.5 Å from the first, and the closest fourth monomer (belonging to another molecule) is 31.5 Å apart, the layer spacing of the smectic phase (Fig. 3). We therefore suggest that the peak at 11.7 Å contains the contribution of all these reflections.
In the equatorial direction (perpendicular to n) the most important distance is the separation between the first neighbours for molecules belonging to the same smectic layer (deq = 8.5 Å vs. 8.8 Å reported in ref. 11) together with the distance of the second neighbour (16.1 Å); in addition a shoulder centered at around 14.7 Å ( ) reveals the presence of hexagonal order inside the layer. Finally, there is little evidence for π stacking and herringbone packing both in simulation morphologies and in the wide angle X-ray scattering (WAXS) patterns. The octyl substituents apparently prevent these arrangements, typical of planar aromatic compounds, favoring instead the isolation of the aromatic backbones, which are immersed in a bath of entangled alkyl chains. This organization should yield excitons that are confined on single IF3 units rather than being delocalized over molecular aggregates.
3.2. Energy transport in the condensed phase
In a Förster picture, a quantitative assessment of the energy transfer rates relies on the correct prediction of the molecular absorption and emission spectra. The calculated spectra at 300 K are displayed in Fig. 6 along with the experimental spectra in solution and film.11 We observe good agreement for the shape, line width and Stokes shift (≈0.26eV), noting that the absorption spectrum consists of a featureless broad peak while emission exhibits a clear vibronic structure. This loss of mirror symmetry and the relative intensity of the emission peaks are reproduced by our ab initio calculations discussed above. This agreement is established without any fitting procedure, the only adjustment being a blue-shift of the simulated spectra by 7 nm to match the exact positions of the absorption and first emission peaks to the experimental peaks. The similarities between vibronic progression of the IF3 experimental photoluminescence spectra in film and solution, and lack of change for absorption features when going from solution to the liquid crystal phase, demonstrated for similar indenofluorene trimers45 and for the polymer,52 indicates that the weak intermolecular coupling regime is a reasonable assumption for our model. The reduced intensity of the 0–0 line in the photoluminescence spectrum of the film is mostly due to self-absorption effects.11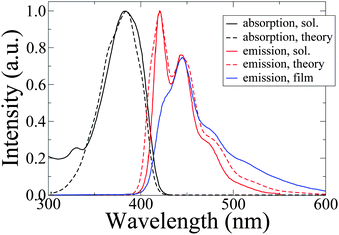 | ||
| Fig. 6 Simulated absorption (black dashed line) and emission (red dashed line) spectra as well as room temperature experimental absorption (black solid line) and emission (red solid line) spectra in toluene and K2CO3 solution.11Emission spectrum for an IF3 film, drop-casted from solution,11 is also shown with a blue solid line. | ||
To confirm the choice of the appropriate transport regime we have calculated the maximum excitonic coupling between first nearest neighbours averaged on all different configurations, 〈|VmaxDA|〉 = 0.038 eV at 300 K, found to be much smaller than the value of the excited state reorganization energy, λ = 0.34eV at 300 K,34 ensuring that transport occurs via incoherent hopping of excitons localized on single IF3 chromophores.
The spatial extent over which an excitation could diffuse during its lifetime depends on the rate of energy transfer which in turn is proportional to the squared excitonic coupling |VDA|2 and the spectral overlap viaeqn (1). As a prelude to the full transport simulations, we explore the sensitivity of VDA to changes on the molecular conformations. The square of the excitonic coupling for two molecules of IF3 depends on the rigid body rotation angle θ about the axis connecting the centre of masses of the two molecules. To amplify, |VDA|2 is an oscillating function of θ with a period of π, reflecting the fact that the excitonic coupling is maximized when the transition dipoles are parallel to each other, θ = 0∘, and vanishes for θ = 90∘ (see Fig. ESI 4†). Hence the coupling will decrease with increasing orientational and positional disorder, due to the increase in temperature, since there will be an increasing probability of finding neighboring chromophores misaligned. The electronic structure calculations confirm this scenario as can be seen on Fig. 7 (a) and from the probability distribution plot of |VDA|2 for the smectic phase at 300 K and the isotropic phase at 500 K (see Fig. ESI 5†). However, the spectral overlap JDA increases linearly with temperature due to the broadening of the absorption and emission spectra. Overall, the combined effect of reduced excitonic coupling and increased spectral overlap thus results in a constant total hopping rate (the ensemble average of the sum of all possible hopping rates for each molecule), as can be seen in Fig. 7 (c).
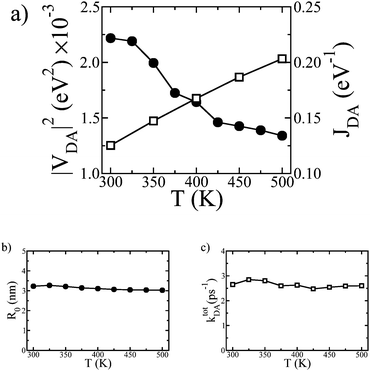 | ||
| Fig. 7 The total squared excitonic coupling |VDA|2 (circles) and spectral overlap JDA (squares) as a function of absolute temperature T (a). The Förster radius R0 (b) and the total hopping rate ktotDA (c) as a function of T. | ||
Having examined the sensitivity of the microscopic parameters that control energy transport we now turn our attention to the Monte Carlo simulations of exciton diffusion. We find that Ld is almost independent of temperature with a mean value of 67.5 nm, as depicted in Fig. 8. It is at first surprising that for all studied morphologies the diffusion length is constant as it would be tempting to assume that Ld should be smaller for the more disordered morphologies. Nevertheless, as demonstrated above, although on average |VDA|2 lowers with increasing temperature, this effect is compensated by the increase in JDA, resulting in a constant transfer rate and hence diffusion length Ld. It has been generally believed that the singlet exciton diffusion length in disordered organic films should be very small 7,53,54; our simulations however suggest that large values of Ld could be expected even in amorphous molecular materials.
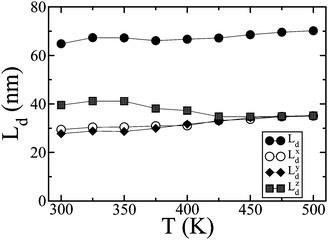 | ||
| Fig. 8 The x, y, z components of the diffusion length (Lxd, Lyd and Lzd respectively) as a function of T. | ||
The above picture could change in cases where coherent effects either due to electronic interactions between chromophores or coupling to the bath are present. There are two ways coherence could alter the picture, delocalization of excitation between chains to form excitonic domains,55 or it can play a role in modifying the dynamics intrinsically.56 In both instances, ordering of molecules or polymer chains could modify the energy transfer dynamics, particularly in cases of substantial electronic coupling. Nevertheless the assumption of incoherent hopping underlying our conclusion is the most likely scenario as discussed previously.
We have also extracted an effective, orientation averaged, Förster radius R0 (the distance at which 〈kDA〉 = 1/τR). Our calculated value of 3.23 nm at 300 K is close to the experimentally determined value of ≈3.3 nm obtained from photoluminescence experiments in samples of perylene end-capped polyindenofluorene chains.57R0 follows the same trend as Ld, being nearly independent of temperature (Fig. 7b). Nevertheless, the decrease in the order parameters with temperature shown in Fig. 2 plays an important role on the diffusion and the pathways that excitons follow. As demonstrated in Fig. 8, excitons benefit from orientational order and better packing, travelling larger distances along the direction perpendicular to the smectic layers (z-direction, Fig. 3 top-left panel) at lower temperatures. The anisotropy of energy transfer in liquid crystals has been predicted in the past by molecular level simulations.58,59 This property, which is very sensitive to the aspect ratio and intermolecular distances between chromophoric units,58,60 could be exploited in designing favorable pathways for excitons in properly engineered devices. As temperature increases transport eventually becomes isotropic via the transition to the isotropic phase: the impact of temperature on the diffusion dynamics can hence be related to the different pathways excitons use to diffuse while overall the diffusion length remains unaltered.
Another physical property that can be easily accessed by fluorescence spectroscopy, and in this case by simulations, is the anisotropy ratio as a function of time r(t) = (I∥ − I⊥)/(I∥ + 2I⊥). Here we excite our sample at t = 0 with vertically (parallel to n) polarised light and find the intensity of light exiting the sample through a parallel (I∥) or perpendicular polarization direction (I⊥) at a given time. As the transition dipoles μ for IF3 are parallel to the long molecular axis u, we computed the two relative intensities as:61
The fluorescence anisotropy, plotted in Fig. 9, is temperature dependent as it sees the average orientational order through its asymptotic value r(∞) = 〈P2〉, allowing to distinguish the smectic phase (T = 300, 350 and 400 K in Fig. 9) from the isotropic phase (T = 450 and 500 K), where the long-time emission is completely depolarised (r(∞) = 0). At short times the anisotropy is always higher as the incident light is polarised, but it quickly reaches asymptotic behavior in about 5 ps at all temperatures, with decay time, obtained from eqn (3), ranging from 0.2 to 0.3 ps. These times are of the same order of magnitude as the average exciton waiting times (Fig. ESI 6†), revealing that in practice only a few exciton hops are sufficient to reach the steady-state anisotropy.
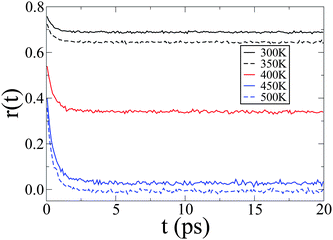 | ||
| Fig. 9 The fluorescence anisotropy ratio r(t) = (I∥ − I⊥)/(I∥ + 2I⊥) as a function of time for different temperatures. | ||
Finally, we explore the role of static energetic disorder on exciton diffusion. As discussed above, conformational disorder arises from local fluctuations of the torsion angles between the indenofluorene units and so is dynamic; it is accounted for explicitly in the homogeneous line width. An additional contribution to the spectral line shapes frequently arises when embedding molecules in a dielectric environment and is included in transport models through a random distribution of site energies obeying a Gaussian distribution of width σ. Fig. 10 shows the effects of inhomogeneous disorder. Ld decreases when σ increases, as documented in previous work.10 This decrease is steeper for the lowest temperatures since there is less thermal energy available to overcome energy barriers. Therefore, high values of static disorder could make Ld sensitive to temperature. However, as an inhomogeneous broadening of only 0.014 eV has been reported for a similar step ladder type paraphenylene oligomer,62 energetic disorder is expected to be low in well-defined molecular systems such as the system investigated here. To quantify the magnitude of electrostatic disorder associated with molecules feeling different dielectric environments, we have calculated the distribution of the difference between the ground and excited state electrostatic energy of the IF3 molecules. The distributions (Fig. ESI 7†) fit reasonably well to Gaussian functions and feature standard deviations lower than 0.007 eV; it is clear from Fig. 10 that such low values of inhomogeneous disorder play a marginal role on the temperature dependence of Ld.
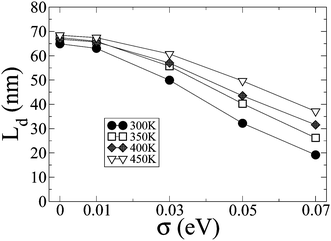 | ||
| Fig. 10 The diffusion length Ld as a function of the energetic disorder width parameter σ for various temperatures. | ||
4. Conclusions
We have presented a detailed atomistic study of exciton transport in conjugated oligomers by combining MD prediction of the morphologies and quantum chemistry and MC simulations of energy transfer. The validity of the MD simulation results is supported by recent experimental data on indenofluorene mesophases. We demonstrate that, unexpectedly, the diffusion length is not affected by the reduction of the order parameters with increasing temperature. This result is attributed to the cancelling effect of the global decrease of the average excitonic coupling and the simultaneous increase of the spectral overlap with increasing temperature. Whilst the phase transition from smectic to isotropic phase does not impact the magnitude of Ld, it has a remarkable effect on the directionality of the exciton transport, which is anisotropic at room temperature in the smectic phase and reaches purely isotropic behaviour only at high temperatures. Our approach adds realism to modelling the transport properties of conjugated systems and sheds light on the impact of both the morphological and temperature change in the material to its optoelectronic properties. In particular, we found that molecules like IF3 organizing into liquid crystalline phases at room temperature can sample many conformational states over short periods of time, thereby resulting in efficient excitation diffusion otherwise strongly limited by static disorder in the solid state. We note that similar dynamic effects have been shown to significantly boost the charge carrier transport mobilities in other conjugated mesophases.18 Altogether, our results suggest that liquid crystalline oligomeric materials could be promising candidates for engineering optoelectronic devices that require stable and controlled electronic properties over a wide range of temperatures and supramolecular arrangements.The authors would like to thank Dr Johannes Gierschner (IMDEA Madrid) for helpful discussions. The research leading to these results has received funding from the European Community through FP6 project MODECOM (NMP-CT-2006-016434) and FP7 project ONE-P (NMP3-LA-2008-212311). S. A. and D. B. are respectively Postdoctoral Research Fellow and Research Director at FNRS.
References
- J. H. Burroughes, D. D. C. Bradley, A. R. Brown, R. N. Marks, K. Mackay, R. H. Friend, P. L. Burns and A. B. Holmes, Nature, 1990, 347, 539 CrossRef CAS.
- H. Sirringhaus, P. J. Brown, R. H. Friend, M. M. Nielsen, K. Bechgaard, B. M. W. Langeveld-Voss, A. J. H. Spiering, R. A. J. Janssen, E. W. Meijer, P. Herwig and D. M. de Leeuw, Nature, 1999, 401, 685 CrossRef CAS.
- S. T. III, G. Joly and T. Swager, Chem. Rev., 2007, 107, 1339 CrossRef CAS.
- G. Li, V. Shrotriya, J. S. Huang, Y. Yao, T. Moriarty, K. Emery and Y. Yang, Nat. Mater., 2005, 4, 864 CAS.
- P. Peumans, A. Yakimov and S. R. Forrest, J. Appl. Phys., 2003, 93, 3693 CrossRef CAS.
- M. Campoy-Quiles, T. Ferenczi, T. Agostinelli, P. G. Etchegoin, Y. Kim, T. D. Anthopoulos, P. N. Stavrinou, D. D. C. Bradley and J. Nelson, Nat. Mater., 2008, 7, 158 CrossRef CAS.
- P. W. M. Blom, V. D. Mihailetchi, L. J. A. Koster and D. E. Markov, Adv. Mater., 2007, 19, 1551 CrossRef CAS.
- R. Seifert, S. Scholz, B. Lüssem and K. Leo, Appl. Phys. Lett., 2010, 97, 13308 CrossRef.
- K. Müllen and G. Wegner, Electronic materials: The Oligomer approach, Wiley-VCHWeinheim, 1998 Search PubMed.
- S. Athanasopoulos, E. V. Emelianova, A. B. Walker and D. Beljonne, Phys. Rev. B: Condens. Matter Mater. Phys., 2009, 80, 195209 CrossRef.
- M. M. Elmahdy, G. Floudas, L. Oldridge, A. C. Grimsdale and K. Müllen, ChemPhysChem, 2006, 7, 1431 CrossRef CAS.
- J. C. Phillips, R. Braun, W. Wang, J. Gumbart, E. Tajkhorshid, E. Villa, C. Chipot, R. D. Skeel, L. Kale and K. Schulten, J. Comput. Chem., 2005, 26, 1781 CrossRef CAS.
- H. J. C. Berendsen, J. P. M. Postma, A. D. Nola and J. R. Haak, J. Chem. Phys., 1984, 81, 3684 CrossRef CAS.
- A. D. MacKerell, D. Bashford, Bellott, R. L. Dunbrack, J. D. Evanseck, M. J. Field, S. Fischer, J. Gao, H. Guo, S. Ha, D. Joseph-McCarthy, L. Kuchnir, K. Kuczera, F. T. K. Lau, C. Mattos, S. Michnick, T. Ngo, D. T. Nguyen, B. Prodhom, W. E. Reiher, B. Roux, M. Schlenkrich, J. C. Smith, R. Stote, J. Straub, M. Watanabe, J. Wiorkiewicz-Kuczera, D. Yin and M. Karplus, J. Phys. Chem. B, 1998, 102, 3586 CrossRef CAS.
- U. Essmann, L. Perera, M. L. Berkowitz, T. A. Darden, H. Lee and L. G. Pedersen, J. Chem. Phys., 1995, 101, 8577 CrossRef CAS.
- V. Marcon, T. Vehoff, J. Kirkpatrick, C. Jeong, D. Y. Yoon, K. Kremer and D. Andrienko, J. Chem. Phys., 2008, 129, 94505 CrossRef.
- G. Tiberio, L. Muccioli, R. Berardi and C. Zannoni, ChemPhysChem, 2009, 10, 125 CrossRef CAS.
- Y. Olivier, L. Muccioli, V. Lemaur, Y. H. Geerts, C. Zannoni and J. Cornil, J. Phys. Chem. B, 2009, 113, 14102 CrossRef CAS.
- J. Budzien, C. Raphael, M. D. Ediger and J. J. de Pablo, J. Chem. Phys., 2002, 116, 8209 CrossRef CAS.
- F. Furche and R. Ahlrichs, J. Chem. Phys., 2002, 117, 7433 CrossRef CAS.
- R. Berardi, G. Cainelli, P. Galletti, D. Giacomini, A. Gualandi, L. Muccioli and C. Zannoni, J. Am. Chem. Soc., 2005, 127, 10699 CrossRef CAS.
- W. D. Cornell, P. Cieplak, C. I. Bayly, I. R. Gould, K. M. Merz Jr, D. M. Ferguson, D. C. Spellmeyer, T. Fox, J. W. Caldwell and P. A. Kollman, J. Am. Chem. Soc., 1995, 117, 5179 CrossRef CAS.
- L. J. Yang, C. H. Tan, M. J. Hsieh, J. M. Wang, Y. Duan, P. Cieplak, J. Caldwell, P. A. Kollman and R. Luo, J. Phys. Chem. B, 2006, 110, 13166 CrossRef CAS.
- O. A. von Lilienfeld and D. Andrienko, J. Chem. Phys., 2006, 124, 54307 CrossRef CAS.
- V. May and O. Kühn, Charge and Energy Transfer Dynamics in Molecular Systems, Wiley-VCH, Berlin, 2000 Search PubMed.
- E. Hennebicq, D. Beljonne, C. Curutchet, G. D. Scholes and R. J. Silbey, J. Chem. Phys., 2009, 130, 214505 CrossRef CAS.
- D. Beljonne, C. Curutchet, G. D. Scholes and R. J. Silbey, J. Phys. Chem. B, 2009, 113, 6583 CrossRef CAS.
- S. Marguet, D. Markovitsi, P. Millié, H. Sigal and S. Kumar, J. Phys. Chem. B, 1998, 102, 4697 CrossRef CAS.
- D. Beljonne, J. Cornil, R. Silbey, P. Millié and J.-L. Brédas, J. Chem. Phys., 2000, 112, 4749 CrossRef CAS.
- E. Hennebicq, G. Pourtois, G. Scholes, L. Herz, D. Russell, C. Silva, S. Setayesh, A. Grimsdale, K. Müllen, J.-L. Brédas and D. Beljonne, J. Am. Chem. Soc., 2005, 127, 4744 CrossRef CAS.
- C. Bacchiocchi, E. Hennebicq, S. Orlandi, L. Muccioli, D. Beljonne and C. Zannoni, J. Phys. Chem. B, 2008, 112, 1752 CrossRef CAS.
- Z. Shuai and J. L. Brédas, Phys. Rev. B: Condens. Matter, 2000, 62, 15452 CrossRef CAS.
- J. Ridley and M. C. Zerner, Theor. Chim. Acta, 1973, 32, 111 CrossRef CAS.
- G. Heimel, M. Daghofer, J. Gierschner, E. J. W. List, A. C. Grimsdale, D. Beljonne and J. Bredas, J. Chem. Phys., 2005, 122, 54501 CrossRef.
- A. P. J. Jansen, Comput. Phys. Commun., 1995, 86, 1 CrossRef CAS.
- J. J. Lukkien, J. P. L. Segers, P. A. J. Hilbers, R. J. Gelten and A. P. J. Jansen, Phys. Rev. E: Stat. Phys., Plasmas, Fluids, Relat. Interdiscip. Top., 1998, 58, 2598 CrossRef CAS.
- S. Athanasopoulos, E. Hennebicq, D. Beljonne and A. B. Walker, J. Phys. Chem. C, 2008, 112, 11532 CrossRef CAS.
- S. Setayesh, D. Marsitzky and K. Müllen, Macromolecules, 2000, 33, 2016 CrossRef CAS.
- I. Cacelli, L. De Gaetani, G. Prampolini and A. Tani, J. Phys. Chem. B, 2007, 111, 2130 CrossRef CAS.
- M. Böckmann, C. Peter, L. Delle Site, N. L. Doltsinis, K. Kremer and D. Marx, J. Chem. Theory Comput., 2007, 3, 1789 CrossRef.
- W. L. McMillan, Phys. Rev. A: At., Mol., Opt. Phys., 1972, 6, 936 CrossRef CAS.
- C. Zannoni, in The Molecular Dynamics of Liquid Crystals, ed. G. Luckhurstand C. Veracini, Kluwer, 1994, ch. 6, p. 139 Search PubMed.
- V. Wong and D. A. Case, J. Phys. Chem. B, 2008, 112, 6013–6024 CrossRef CAS.
- S.-F. Lim, R. H. Friend, I. D. Rees, J. Li, Y. Ma, K. Robinson, A. B. Holmes, E. Hennebicq, D. Beljonne and F. Cacialli, Adv. Funct. Mater., 2005, 15, 981 CrossRef CAS.
- C. Chi, G. Lieser, V. Enkelmann and G. Wegner, Macromol. Chem. Phys., 2005, 206, 1597 CrossRef CAS.
- V. Marcon, N. van der Vegt, G. Wegner and G. Raos, J. Phys. Chem. B, 2006, 110, 5253 CrossRef CAS.
- S. Kilina, E. R. Batista, P. Yang, S. Tretiak, A. Saxena, R. L. Martin and D. L. Smith, ACS Nano, 2008, 2, 1381 CrossRef CAS.
- I. Cacelli and G. Prampolini, J. Phys. Chem. A, 2003, 107, 8665 CrossRef CAS.
- V. Lukeš, R. Šolc, M. Barbatti, M. Elstner, H. Lischka and H.-F. Kauffmann, J. Chem. Phys., 2008, 129, 164905 CrossRef.
- D. Catalano, L. Di Bari, C. A. Veracini, G. N. Shilstone and C. Zannoni, J. Chem. Phys., 1991, 94, 3928 CrossRef CAS.
- P. E. Keivanidis, J. Jacob, L. Oldridge, P. Sonar, B. Carbonnier, S. Baluschev, A. C. Grimsdale, K. Müllen and G. Wegner, ChemPhysChem, 2005, 6, 1650 CrossRef CAS.
- J. Ye, A. C. Grimsdale and Y. Zhao, J. Phys. Chem. A, 2010, 114, 504 CrossRef CAS.
- V. Mikhnenko, F. Cordella, A. B. Sieval, J. C. Hummelen, P. W. M. Blom and M. A. Loi, J. Phys. Chem. B, 2008, 112, 11601 CrossRef CAS.
- P. E. Shaw, A. Ruseckas and I. D. W. Samuel, Adv. Mater., 2008, 20, 3516 CrossRef CAS.
- F. C. Spano, J. Clark, C. Silva and R. H. Friend, J. Chem. Phys., 2009, 130, 74904 CrossRef.
- E. Collini and G. D. Scholes, Science, 2009, 323, 369 CrossRef CAS.
- L. M. Herz, C. Silva, A. C. Grimsdale, K. Müllen and R. T. Phillips, Phys. Rev. B: Condens. Matter Mater. Phys., 2004, 70, 165207 CrossRef.
- C. Bacchiocchi and C. Zannoni, Chem. Phys. Lett., 1997, 268, 541 CrossRef CAS.
- C. Bacchiocchi and C. Zannoni, Phys. Rev. E: Stat. Phys., Plasmas, Fluids, Relat. Interdiscip. Top., 1998, 58, 3237 CrossRef CAS.
- J. Gierschner, Y.-S. Huang, B. Van Averbeke, J. Cornil, R. H. Friend and D. Beljonne, J. Chem. Phys., 2009, 130, 44105 CrossRef.
- C. Zannoni, Mol. Phys., 1979, 38, 1813 CrossRef CAS.
- H. Wiesenhofer, E. Zojer, E. J. W. List, U. Scherf, J. L. Brédas and D. Beljonne, Adv. Funct. Mater., 2006, 18, 310 CAS.
Footnotes |
| † Electronic supplementary information (ESI) available. See DOI: 10.1039/c0sc00467g |
| ‡ Present address: School of Chemistry and Biochemistry, Center for Organic Photonics and Electronics, 901 Atlantic Dr NW, Georgia Institute of Technology, Atlanta, GA 30332-0400, USA; E-mail: thodoris@gatech.edu |
| This journal is © The Royal Society of Chemistry 2011 |


