DOI:
10.1039/C1RA00355K
(Paper)
RSC Adv., 2011,
1, 715-724
Robust solid oxide cells for alternate power generation and carbon conversion
Received
25th June 2011
, Accepted 26th July 2011
First published on 1st September 2011
Abstract
Solid oxide cells (SOCs) are potentially useful for versatile energy conversion and storage applications. This work demonstrates the feasibility of SOCs that are operated in alternate power generation and carbon conversion modes. SOCs with lanthanum strontium vanadate (LSV) hydrogen electrodes have been proved to be competent candidates for such applications. SOCs with LSV-based hydrogen electrodes exhibit salient catalytic activity in hydrogen and various simulated feedstocks, e.g. syngas, biogas, town gas, and coal gas. LSV electrodes seem to perform better in the electrolyser mode than in the fuel cell mode. LSV electrodes are unlikely to be coked by the deposited carbon when exposed to carbon-forming gases. Most interestingly, LSV undergoes continuous activation during the course of operation, instead of being poisoned, when exposed to gases containing 50 ppm H2S. LSV-based reversible SOCs under alternating electrolyser and fuel cell operations have been demonstrated with negligible performance degradation over 500 h.
1. Introduction
International commitment on a sustainable society and low-carbon future demands green energy conversion and storage technologies.1 In an ideal scenario, primary energy sources are converted to secondary energy sources, mostly in electrical energy, with high energy conversion efficiency and a low carbon footprint. On the other hand, temporarily surplus electrical energies should be efficiently stored in various forms such as flywheels, dammed water, heat accumulators, batteries, and fuels. Currently available technologies, e.g. wind,2 nuclear,3 solar,4metal hydrides,5 and batteries,6 largely fail to meet at least one of the key targets such as cost, reliability, flexibility, efficiency, and large scale deployment. A technology that generally fulfils these requirements is a solid oxide cell (SOC). SOCs can be operated both in fuel cell and electrolyser modes. The fuel cell mode, i.e. solid oxide fuel cell (SOFC), has been extensively studied for three decades.7,8 The electrolyser mode, i.e. solid oxide electrolysis cell (SOEC), was explored in 1980s for hydrogen production from steam electrolysis.9 Those developments were not continued because of the low energy price in 1990s. Recently, SOECs have been revived by employing the as-developed SOFC technology,10,11 possibly due to the soaring energy cost and worldwide consensus on green and low-carbon economy. The advantages of SOCs are the high energy conversion and storage efficiency and the fuel flexibility. The electrical efficiencies of SOFCs ranging from 40% (simple and small systems) to 50% (hybrid systems) had been demonstrated, and the theoretical efficiency is projected up to 60%.12 The overall efficiencies of SOECs can reach 87–93% for megawatt scale SOEC stacks.13
In 2007, centralized power plants represented 43% of the CO2 emission.14 The most critical task towards a low-carbon economy is to reduce CO2 emission or the carbon density. Current carbon capture and sequestration (CCS) technologies, however, are highly energy-intensive and inefficient.15 Additionally, captured CO2 is mostly stored in inert absorbents, thus interrupting the carbon cycle.16 To overcome this problem, a “carbon-neutral” carbon capture and conversion method using SOCs is proposed and illustrated in Fig. 1. The SOC stacks are coupled to a centralized power station, which emits greenhouse gases such as CO2 and H2O, and renewable/nuclear power generation facilities. This demonstrates an energy mixed concept whereby the energy/power is generated from different possible sources. Most SOCs will operate in fuel cell mode, i.e. SOFCs, in the case of heavy electrical load demand. They are fed with hydrocarbon fuels such as natural gas, coal gas, town gas, and biogas. The waste thermal energy is recuperated and used to preheat the inlet fuels. The effluent gases are condensed (to remove water), compressed, and stored as feedstock reservoir for carbon conversion (Fig. 1). Alternatively, off-peak electricity from nuclear or renewable energy sources is used to co-electrolyze CO2 and H2O and convert them into H2/CO-rich gases. The H2/CO-rich fuels are essentially synthetic gas, which is the building block for manufacturing different types of hydrocarbon fuels (Fig. 1). The co-electrolysis of CO2 and H2O through SOEC produces O2 as the by-product, which can be channelled to the cathodes of SOFCs as oxidant. In comparison with air as the oxidant, O2 is supposed to improve the system efficiency significantly. The O2-rich air can also be channelled to the fossil fuel power plant to improve the combustion efficiency of the heat engines and boilers. The merit of this design is that the CO2 generated from power plants is not released into the atmosphere but is converted into chemical fuels. The integrated system tends to reduce CO2 emissions and favour a carbon-neutral economy. If incorporated into power grid, the SOCs may mitigate the power instability due to demand fluctuations and intermittent supply of power from renewable energy sources (e.g. wind, solar, and tidal).
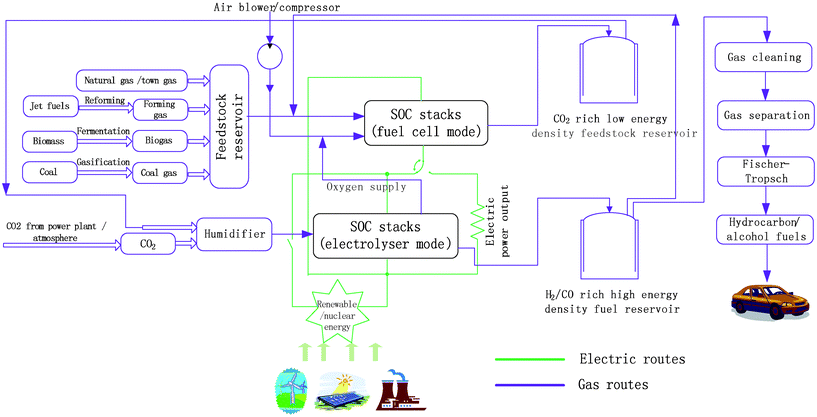 |
| | Fig. 1 Schematic illustration of a synergic power generation and carbon conversion route. | |
As indicated in Fig. 1, the hydrogen electrodes† of such kinds of SOCs must have considerable fuel flexibility, sulfur tolerance, and carbon resistance. SOFCs employing robust hydrogen electrodes can be fed with H2, CO, syngas, and gasified reformates from natural gas, coal, and heavier hydrocarbons. Direct hydrocarbon SOFCs have also been demonstrated.17 In contrast, the feedstock of SOECs can be a mixture of CO2 and H2O, added with certain amount of H2 to prevent the electrocatalysts from oxidation. The state-of-the-art Ni-cermet electrodes, nevertheless, are prone to carbon filament precipitation,18 dusting, and dry corrosion when exposed to hydrocarbon fuels. Ni-cermets are also known to be poisoned by ppm levels of H2S, though they can be regenerated when exposed to low concentration and temporarily high concentration of H2S.19,20Ni-cermet based SOECs are easily poisoned even by ppb levels of H2S in CO2 electrolysis21 and CO2–H2O co-electrolysis.22,23 In the literature, various mitigation approaches on Ni–cermet SOFC anodes had been proposed, including the addition of water24,25 and low melting point metals26 into the fuels, and decoration of NiO particles with ceria27–29 or niobia.30sulfide31–33 and oxide34–41 anodes had also been explored extensively. The sulfur tolerance of oxide SOEC negative electrodes, however, has hardly been reported. It is worth noting that many practical SOC feedstocks, e.g. natural gas, coal gas, syngas, town gas, biogas, and reformed military fuels, contain several to thousands ppm level of H2S.
Lanthanum strontium vanadate may be the candidate hydrogen electrode, which generally fulfils the stringent criteria. Historically, lanthanum strontium vanadate La1-xSrxVO3 (0 ≤ x ≤ 1) are of interest because of their metal–insulator transition,42 high electrical conductivity,42,43 and hence, are plausible candidates for high-Tc superconductors.44 Hui and Petric reported that “Strontium doped LaVO3 is stable under SOFC fuel outlet conditions..., however… is unlikely to be useful as anode materials” a decade ago.45 However, studies showed that La1-xSrxVO3 was active in electrochemical H2S oxidation.35,46,47,48SOFC with La0.7Sr0.3VO3 anode is among the best of all reported results, with excellent sulfur tolerance up to percentage level.46 Nevertheless, it seems that La0.7Sr0.3VO349 and La0.7Sr0.3VO3–YSZ composite anodes35 have poor catalytic activity for H2 and CH4 oxidation. The electrode performance was not improved by replacing the YSZ with Gadolinia-doped ceria (GDC) in La0.7Sr0.3VO3-based anodes.41 Recently, cerium strontium vanadate39,50 and molybdenum-doped strontium vanadate51 have also been extensively studied. Vanadate has been proved to be of excellent sulfur tolerance, but low catalytic activity to fuel oxidation undermines its candidature for SOFC anodes. Our recent work demonstrated that a careful sintering process and in situreduction route can improve the anode performance of La1-xSrxVO3 (x = 0.2, 0.3, 0.4, 0.5) by an order of magnitude.52 Thorough experimental and theoretical studies depicted the dynamic behaviour, double layer capacitance, three phase boundaries, and electrochemically active zones of highly active LSV/YSZ interfaces.53–55
La1-xSrxVO3electrodes under SOEC mode, and further SOCs with alternative operations between SOFC and SOEC, have hitherto not been reported. In this work, we demonstrate that SOCs with La1−xSrxVO3hydrogen electrodes exhibit salient catalytic activity, long-term stability, sulfur tolerance, and carbon resistance when exposed to various feedstocks out of the H2–H2O–CO–CO2–CH4–H2S system. The La1-xSrxVO3-based SOC has been proven to be robust for power generation and carbon conversion in the SOFC and SOEC, respectively.
2. Experimental
2.1 Powder synthesis
40 at% strontium-doped lanthanum vanadate (La0.6Sr0.4VO3–δ, hereafter simplified as LSV) powders were synthesized via a citric route with La(NO3)3·6H2O (Fluka, 99.0%), Sr(NO3)2 (Fluka, 99.0%), NH4VO3 (Sigma-Aldrich, 99.5%), and C6H8O7·H2O (Fluka, 99.5%) as starting materials. The molar ratio of total metal ions over citric acid was 2![[thin space (1/6-em)]](https://www.rsc.org/images/entities/char_2009.gif) :
:![[thin space (1/6-em)]](https://www.rsc.org/images/entities/char_2009.gif) 3. Stoichiometric amounts of the raw materials were dissolved in deionised water. The solution was heated at 70 °C and under magnetic stirring. A dark blue gel was obtained after dissipating excess water. It was dehydrated overnight at 100 °C and then grounded in an agate mortar. The precursor was baked at 600 °C for 2 h. The LSV powers were further baked at 600 °C for 2 h and at 800 °C for 6 h. 8 mol% yttria-stabilized zirconia (YSZ, Tosoh Japan) was used as-received.
Right amounts of LSV and YSZ powders were roll-milled overnight in isopropanol with YSZ balls. The slurry was subsequently dried at 80 °C in ambient air. The obtained LSV–YSZ mixture was added with ink vehicles (Fuel Cell Materials, the USA) and ground in the agate mortar to form the electrode paste. Green electrodes were prepared by screen-printing the ink onto 1 mm-thick YSZ electrolyte substrates. The geometric area of electrodes was 0.46 cm2. The catalytic layer, LSV (50 wt%) –YSZ, were sintered at 1215 °C for 2 h. The gas diffusion layer, LSV (70 wt%) –YSZ, was screen-printed onto the catalytic layer and sintered at 1205 °C for another 2 h. The Pt paste was also applied on the opposite side of YSZ substrate to represent the counter and the reference electrodes. All the Pt layers were sintered at 900 °C for 30 min.
3. Stoichiometric amounts of the raw materials were dissolved in deionised water. The solution was heated at 70 °C and under magnetic stirring. A dark blue gel was obtained after dissipating excess water. It was dehydrated overnight at 100 °C and then grounded in an agate mortar. The precursor was baked at 600 °C for 2 h. The LSV powers were further baked at 600 °C for 2 h and at 800 °C for 6 h. 8 mol% yttria-stabilized zirconia (YSZ, Tosoh Japan) was used as-received.
Right amounts of LSV and YSZ powders were roll-milled overnight in isopropanol with YSZ balls. The slurry was subsequently dried at 80 °C in ambient air. The obtained LSV–YSZ mixture was added with ink vehicles (Fuel Cell Materials, the USA) and ground in the agate mortar to form the electrode paste. Green electrodes were prepared by screen-printing the ink onto 1 mm-thick YSZ electrolyte substrates. The geometric area of electrodes was 0.46 cm2. The catalytic layer, LSV (50 wt%) –YSZ, were sintered at 1215 °C for 2 h. The gas diffusion layer, LSV (70 wt%) –YSZ, was screen-printed onto the catalytic layer and sintered at 1205 °C for another 2 h. The Pt paste was also applied on the opposite side of YSZ substrate to represent the counter and the reference electrodes. All the Pt layers were sintered at 900 °C for 30 min.
2.3 Half cell testing
The half cell configuration is given in Fig. 2. Both the counter and reference electrodes were exposed to the ambient air. After purging with N2, the test rig was heated up in H2 with a ramping rate of 2 °C/min. The operating temperature was 900 °C. At the hydrogen electrode side, the H2S-free feedstock was modulated from the corresponding pure gases via Brooks® 4-channel mass flow controller (MFC). H2S was introduced to the feedstock by using a certified gas blend of H2S and H2 (1000 ppm H2S balanced with H2). To obtain a H2O-containing feedstock, the gas blend was channelled through a humidifier with a temperature control of ± 0.1 °C. The total flow rate of feedstock was maintained at 100 sccm. Impedance responses were recorded via a 1255B frequency response analyzer coupled to a 1470E electrochemical interface (Solartron Analytical). The frequency range was 100![[thin space (1/6-em)]](https://www.rsc.org/images/entities/char_2009.gif) 000–0.05 Hz. The sampling rate was 10 points/decade of frequency. Long-term stability tests were performed viachronopotentiometry, i.e. monitoring the electric potentials under given current densities. The sampling rate of chronopotentiometry was 0.2 points/s.
000–0.05 Hz. The sampling rate was 10 points/decade of frequency. Long-term stability tests were performed viachronopotentiometry, i.e. monitoring the electric potentials under given current densities. The sampling rate of chronopotentiometry was 0.2 points/s.
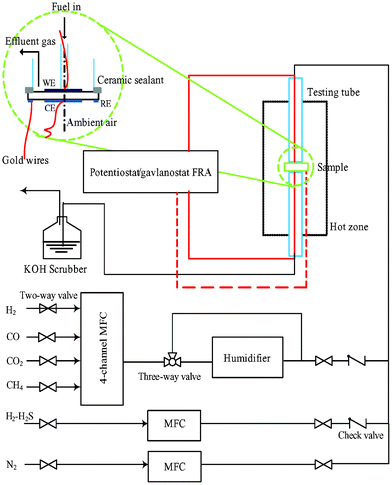 |
| | Fig. 2 Schematic diagram of the flow channel, test rig, and half cell configuration. | |
2.4 Characterization and calculation
The X-ray diffraction pattern was recorded on a Shimadzu 6000 with Cu Kα radiation. The step size was 0.02°. The scan rate was 2°/min. Low vacuum scanning electron microscopy (SEM, JEOL JSM–6360) and field-emission SEM (FESEM, JEOL 7600F) was used for low and high magnification surface morphology observations, respectively. Qualitative element detection in the electrodes was carried out via the energy-dispersive X-ray spectroscopy (EDX, Oxford Instruments X-Max), which were coupled to the JEOL JSM–6360. The chemical states of sulfur were characterized by X-ray photoelectron spectroscopy (XPS, Kratos XSAM-800) with Mg Kα radiation. The binding energy of C1s of adventitious carbon at 282.2 eV was taken as an internal standard. Thermochemical calculations were implemented viaHSC Chemistry 5 (Outokumpu Research Oy, Finland). The vanadium–oxygen–sulfur tertiary predominance diagrams were generated on the basis of minimum Gibbs energy.
3. Results and discussion
3.1 Structure
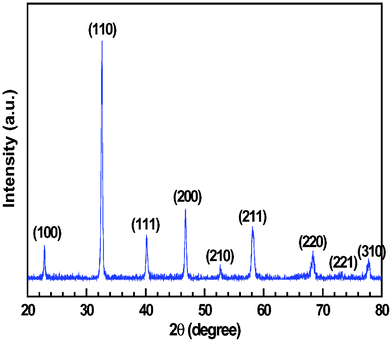
As-synthesized La1-xSrxVO3 is known to be a mixture of LaVO4 and Sr2V2O7. La1-xSrxVO3 is of perovskite structure but always coexists with ineradicable impurity phases even after prolonged exposure to reducing atmosphere.52 The impurity phases were eliminated in the reduced La1-xSrxVO3 that was prepared via a citric route instead of solid state reactions.54Fig. 3 shows the XRD pattern of single phase LSV powders that were reduced in pure H2 at 900 °C for 5 h. This result is consistent with our previous work on La0.8Sr0.2VO3.54 The XRD pattern can be indexed as a cubic structure, with a = 3.8815(6) Å, V = 58.48 Å3, and space group Pm-3m. As stated in ref. 51, however, it could be orthorhombic because the differences among the three lattice parameters are negligibly small. It is thus better to classify LSV as pseudo-cubic perovskite structure.
3.2
Electrode behaviour in clean feedstocks
Impedance spectroscopy shows good electrode performance of the reversible SOCs. The polarization resistances (Rp) of the LSV electrode in H2 are 0.54, 0.43, 0.44 Ω cm2 under the potential biases (Ebias) of −100, 0, and 100 mV, respectively (Fig. 4a). The high Rp under Ebias = −100 mV is due to the severe starvation of H2O. With the H2O content of the feedstock increased to 9 vol%, Rp are 0.11, 0.22, 0.44, 0.56 Ω cm2 under Ebias of −300, −100, 0, 100 mV, respectively (Fig. 4b). These results indicate that LSV seems to be of higher catalytic activity in electrolyser than in fuel cell. Under the open circuit voltage (OCV) condition, the La0.75Sr0.25Cr0.5Mn0.5O3 (LSCM) and La4Sr8Ti11Mn0.5Ga0.5O37.5SOFC anode showed Rp of 0.4756 and 0.2057 Ω cm2 in 97H2–3H2O at 900 °C, respectively. LSV is thought to be comparable to these more well-established SOFC oxide anode materials. In contrast, only a few half-cell results of oxide SOEC negative electrodes were reported. Based on rough comparisons with the single cell results of LSCM58,59 and symmetric cell results of Sr2Fe1.5Mo0.5O6-δ,60LSV could be regarded as one of the best oxides for SOEC negative electrodes.
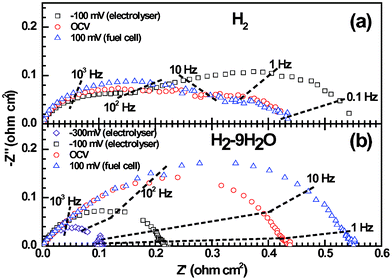 |
| | Fig. 4 Impedance responses of the LSV electrodes in pure H2 (a) and 91H2–9H2O (b), under either positive (fuel cell) or negative (electrolysis) potential biases. The electrolyte contribution has been subtracted from the overall impedance. | |
Fig. 5 shows the chronopotentiometry curves of the LSV electrode in various simulated feedstocks (Table 1), where the half cell is polarized under alternating current densities of ± 0.2 A cm−2. The fresh SOFC electrode shows the overpotential (η) of 89 mV in H2 and a degradation rate (κ) of 0.023%/h. η of the LSV electrode is −67 mV when exposed to 91H2–9H2O and operated as electrolyser. It is worth noting that the η of SOEC is 22 mV smaller than that of SOFC, even with only 9% of H2O. This is consistent with the impedance spectroscopy results that LSV is more active in the electrolyser than in fuel cell. The electrode potential oscillates for 2–5 h and then levels off when significant amounts of CO2 are incorporated into the feedstock, i.e. 36H2–9H2O–55CO2 and 73H2–9H2O–18CO2. This phenomenon might be due to the surface reconstruction of LSV under these oxidising environments. A typical composition of desulfurized CH4-rich biogas, 10H2–35CO2–55CH4 (Table 1), is then introduced to test the carbon resistance of LSV. κ is as high as 1.7%/h for the SOFC operated under this carbon-forming feedstock. It implies that the reaction sites have possibly been blocked by the carbon deposition due to CH4 pyrolysis. After 16 h exposure in 10H2–35CO2–55CH4, the choked electrode is then electrolysed in 80H2–20CO2 for 8 h with the purpose of surface reduction and carbon removal via dry reforming. The regenerated electrode exhibits a slight performance improvement when the feedstock is shifted to 55H2–15CO2–30CO, a typical composition of desulfurized coal gas, though the degradation rate is significant in both electrolyser and fuel cell modes. These preliminary results show that LSV is active and robust towards H2, clean biogas, and coal gas in reversible SOCs.
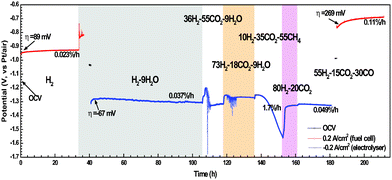 |
| | Fig. 5 Long-term chronopotentiometry of the LSV electrodes exposed to H2S-free feedstocks, under open circuit voltage, 0.2 A cm−2 (fuel cell mode), and −0.2 A cm−2 (electrolyser mode). | |
Table 1 Composition, open circuit potential, tendency of carbon formation of gases that were utilized in chronological order. The operating temperature is 900 °C. The carbon formation is predicted by assuming the thermodynamic equilibrium and minimising the Gibbs energy of the gas mixture
| Feedstock (100 sccm in total) |
OCV (V, vs.Pt/air) /Place occurred |
Carbon formation |
Remarks |
| H2 |
H2O
|
CO
|
CO2 |
CH4 |
H2S |
| 100 |
— |
— |
— |
— |
— |
−1.145 (Fig. 5); |
— |
— |
| −1.112 (Fig. 6); |
| −1.120 (Fig. 8) |
| 91 |
9 |
— |
— |
— |
— |
−1.037 (Fig. 5) |
— |
— |
| 36 |
9 |
— |
55 |
— |
— |
Fig. 5
|
No |
Humidified H2-rich biogas |
| 73 |
9 |
— |
18 |
— |
— |
Fig. 5
|
No |
Humidified H2-rich biogas (with low CO2) |
| 10 |
— |
— |
35 |
55 |
— |
Fig. 5
|
Yes |
CH4-rich biogas |
| 80 |
— |
— |
20 |
— |
— |
Fig. 5
|
No |
H2-rich biogas (with low CO2) |
| 55 |
— |
30 |
15 |
— |
— |
−0.988 V (Fig. 5) |
No |
Coal gas by hydrogasification |
| 100 |
— |
— |
— |
— |
50 ppm |
−1.128 V (Fig. 8) |
— |
— |
| −1.121 V (Fig. 8) |
| 70 |
— |
30 |
— |
— |
— |
Fig. 8
|
Yes |
Syngas/desulfurized town gas |
| 70 |
— |
30 |
— |
— |
50 ppm |
−1.121 V (Fig. 8) |
Yes |
Town gas |
| 65 |
— |
30 |
5 |
— |
50 ppm |
−1.003 V (Fig. 8) |
No |
Coal gas |
| 75 |
— |
— |
25 |
— |
50 ppm |
Fig. 8
|
No |
H2-rich biogas (with low CO2) |
| 60 |
— |
— |
20 |
20 |
50 ppm |
−0.943 (Fig. 8) |
Yes |
Mixture of H2-rich biogas and CH4-rich biogas |
| 97 |
3 |
— |
— |
— |
50 ppm |
−1.060 (Fig. 8) |
— |
— |
3.3
Electrode behaviour in carbon-free and H2S-tainted feedstocks
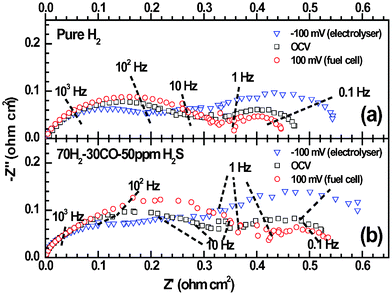
50 ppm H2S was added to H2 in order to evaluate the sulfur tolerance of LSV. Fig. 6 shows the potential responses of LSV electrodes subjected to fuel cell polarization in clean and H2S-tainted H2. η suddenly jumps from 91 mV to 102 mV when the H2fuel is tainted by 50 ppm H2S. This fast electrode degradation is most probably related to the H2S adsorption onto LSV that blocks the reaction sites in a simultaneous way. The degradation lasts 3 h and results in the η change of 1 mV, after what the adsorption/desorption equilibrium of H2S is supposed to be established. The LSV electrode undergoes a performance improvement of 0.012%/h (i.e. κ = −0.012%/h), rather than degradation, in the following 112 h. η finally reaches 97 mV after the 130-h fuel cell operation, which is only 6 mV higher than that in pure H2. The salient long-term stability is also evident in the microstructural analysis. As shown in Fig. 7a and 7b, the electrode microstructure has been little changed after 130 h fuel cell operation. It is of great interest to note that LSV is catalytically active in H2–50 ppm H2S and has being continuously improved at least up to a few hundred hours. To further demonstrate the suitability of LSV towards practical gases, the LSV electrode is subjected to a consecutive testing on simulated town gas, biogas, and coal gas with 50 ppm H2S (Table 1). The LSV electrode exhibits non-negligible performance degradation, κ = 0.090%/h, under the fuel cell polarization in 70H2–30CO (Fig. 8a), a simulated syngas. Interestingly, the LSV electrode enjoys performance improvement, κ = −0.003%/h, merely by the addition of 50 ppm H2S into the feedstock. After the 52 h fuel cell operation, Rp in this syngas is only 0.07 Ω cm2 larger than that of the fresh electrode in H2 (Fig. 9). A coal gas composition is simulated by replacing 5% of H2 with CO2 in the previous feedstock, i.e. 65H2–30CO–5CO2–50 ppm H2S. The η of the LSV electrode exposed to this coal gas is −68 mV. It decreases to −61 mV after the electrolysis for 10 h (Fig. 8a). After the standby exposure to H2–50 ppm H2S for 3 h, the LSV electrode is subjected to fuel cell polarization in H2–50 ppm H2S. The η in H2–50 ppm H2S is almost unchanged as compared to the fresh LSV electrode exposed to H2 (cf.Fig. 8a and 8b). 75H2–25CO2–50 ppm H2S, a typical H2–rich biogas with low CO2 concentration, is then introduced. The LSV electrode exhibits slight activation with κ of −0.087%/h in H2–50 ppm H2S and −0.069%/h in 75H2–25CO2–50 ppm H2S (Fig. 8b). These promising results indicate that LSV, as a SOChydrogen electrode, performs satisfactorily in practical gases where carbon deposition hardly occurs.
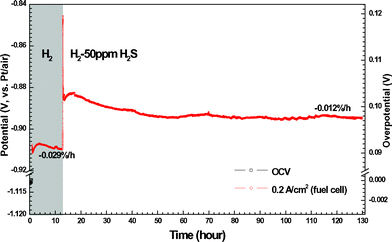 |
| | Fig. 6 Long-term chronopotentiometry of the LSV electrodes under 0.2 A cm−2 (fuel cell mode), with response to the gas shift from pure H2 to H2-50 ppm H2S. | |
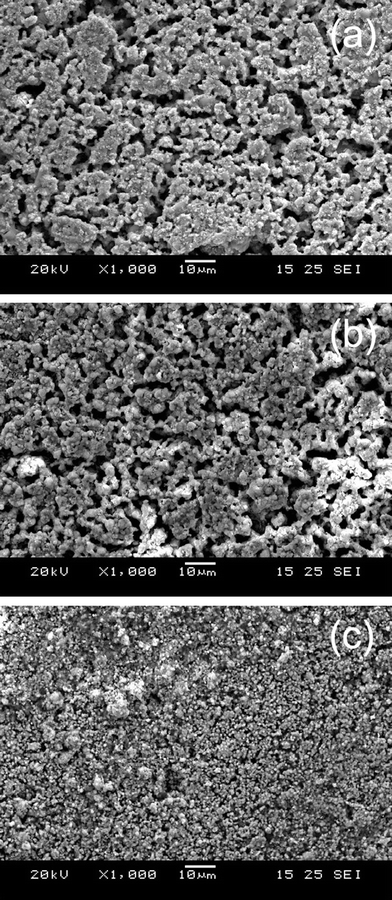 |
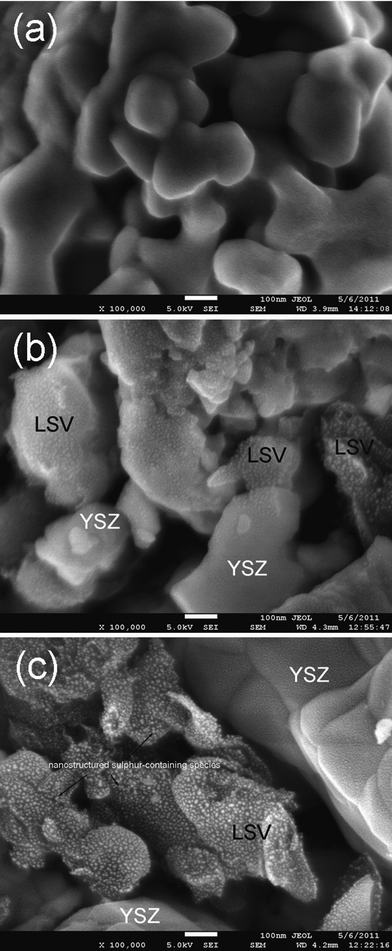
| | Fig. 7 Typical low-magnification SEM images of LSV electrodes: freshly reduced (a), operated in fuel cell mode and in H2–50 ppm H2S for 127 h (b), and operated under alternating SOFC/SOEC operations in various H2S-tainted and carbon-forming feedstocks for 500 h (c). | |
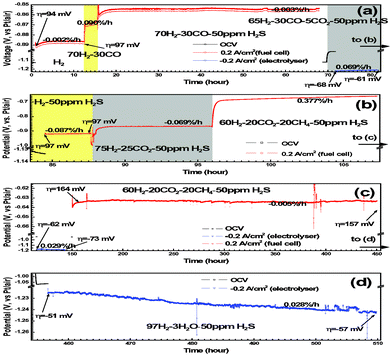 |
| | Fig. 8 Long-term chronopotentiometry of the LSV electrodes exposed to H2S-tainted feedstocks. The whole figure is divided into (a) to (d) merely for the clear illustration purpose. | |
 |
| | Fig. 9
Impedance spectra of the LSV electrode as shown in Fig. 8a: (a) the freshly prepared electrode in pure H2 and (b) the electrode after 70-hour fuel cell polarization and in the 70H2–30CO–50 ppm H2S atmosphere. | |
3.4
Electrode behaviour in carbon-forming and H2S-tainted feedstocks
Once the feedstock is shifted to 60H2–20CO2–20CH4–50 ppm H2S, a simulated gas blend of H2-rich and CH4-rich biogases that is prone to carbon formation, the electrode potential is suddenly increased from −0.868 V to −0.692 V. This is mainly due to the OCV reduction after the gas shifting (see OCVs in Table 1). Nevertheless, a large k of 0.377%/h has been observed during the 12 h fuel cell polarization (Fig. 8b). Two degradation mechanisms might exist: (i) carbon coking of the electrochemical reaction sites and (ii) surface oxidation of LSV. To eliminate the ambiguity the LSV electrode is subsequently subjected to electrolysis for 30 h. It is believed that the carbon removal via dry reforming of CH4 is somewhat suppressed because CO2 is reduced to CO during the electrolysis. The CH4 pyrolysis thus dominates and the carbon deposition is more remarkable in electrolyser mode than in fuel cell mode. If the degradation is controlled by the carbon coking mechanism, the electrode degradation after 30 h electrolysis should be more serious than that before the electrolysis.
In contrast to this prediction, the electrode potential has been hardly changed. As shown in Fig. 8b and 8c, the electrode potential is −0.664 V and −0.639 V for the LSV electrode before and after 30 h electrolysis, respectively. More interestingly, continuous electrode activation with k = −0.05%/h has been observed in the 300 h fuel cell operation (Fig. 8c). These results obviously rule out the carbon coking mechanism. The most probably mechanism is that the “oxidized” LSV surface has been reduced and reconstructed during the 30 h electrolysis, which is prior to the 300 h fuel cell operation. η is −51 mV and κ is only 0.028%/h in the following electrolysis operation in 97H2–3H2O–50 ppm H2S (Fig. 8d). It is worth highlighting that this LSV electrode, even after the alternating SOFC/SOEC operations for 500 h, shows better performance than those LSV electrodes exposed to H2–9H2O (Fig. 5) and 65H2–30CO–5CO2–50 ppm H2S (Fig. 8a)
Improved microstructure could be a plausible reason for the continuous electrode activation. It is, however, difficult to explain why both electrodes are activated but their microstructures are distinctly different for the two LSV electrodes that are addressed in Fig. 6 and 8. Note that the “fine” microstructure of the LSV electrode exposed to carbon-forming gases, as confirmed by the EDX measurements, is ascribed to the effect of deposited carbon (Fig. 7c). The exact mechanism of the electrode activation is currently unknown. These promising results, nevertheless, demonstrate that LSV performs satisfactorily at least up to a few hundred hours even with the presence of carbon deposition and sulfur.
3.5
Sulfur in LSV electrodes
While LSV is of excellent carbon resistance, it is still unclear why it is activated, instead of poisoned, by the H2S-containing feedstocks. SEM observations showed negligible contributions of H2S on modifying the electrode microstructure (cf.Fig. 7a and 7b). This is conceivable because the H2S concentration is only 50 ppm and most sulfur-containing species, e.g. S, CS2, are volatile at 900 °C. One of the possible mechanisms is the formation of metal sulfides when the LSV electrode is exposed to H2S-contaning feedstocks. These sulfides might be catalytically active for fuel cell and electrolysis reactions. Fig. 10 shows high-resolution surface morphology images of the three LSV electrodes that are (i) freshly prepared, (ii) exposed to H2–50 ppm H2S as corresponding to Fig. 6, and (iii) exposed to various feedstocks as corresponding to Fig. 8, respectively. No fine structures are observed in the freshly prepared electrode (Fig. 10a). Modest amounts of nanoparticles are observed in the LSV electrode with 120 h exposure to H2S (Fig. 10b). A large quantity of relatively uniform-sized nanoparticles, with diameters of 5.5 ± 0.9 nm (Fig. 11), exist on the electrode surfaces that have been exposed to 50 ppm H2S for 510 h (Fig. 10c).
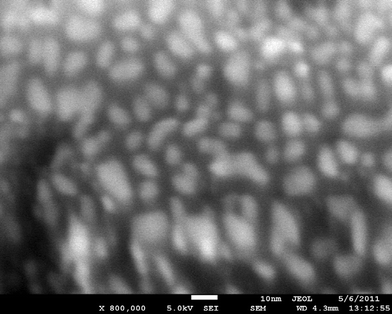 |
| | Fig. 11 High magnification surface morphology images of LSV surfaces, as shown in Fig. 10c. For the deposited particles the mean size is 5.5 nm and the standard deviation is 0.9 nm. | |
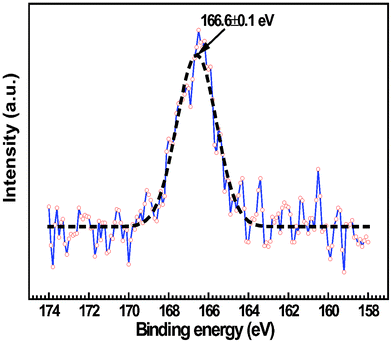
The nanoparticles could be either precipitated electrocatalysts after prolonged annealing or certain metal sulfides resulting from the reaction with H2S. It is tentatively assumed that LSV is the matrix of these nanoparticles, as vanadium-based oxides have good affinity to sulfur while YSZ is essentially inert towards H2S. This assumption is substantiated by relevant thermochemical calculations. Fig. 12a shows the V–O–S predominance diagram at 900 °C. V2S3 is found to be the most stable phase under the SOC operating conditions. The concentration of these nanoparticles in LSV electrodes, however, is still below the detection limit of EDX and XRD. In contrast, Fig. 13 shows very weak S2p photoelectron lines of the LSV electrode that was exposed to H2–50 ppm H2S for 120 h (Fig. 6). The background is so strong that the doublet peaks of the S2p spectrum cannot be resolved. The binding energy (BE) of S2p spectral line of the unknown sulfur-containing species is as high as 166.6 ± 0.1 eV. This BE value is higher than the reported values on V2S3 and other possible sulfides for 3 to 4 eV, as listed in Table 2. Surprisingly, it is very close to the S2p3/2 spectral lines of several alkali and transition metal sulfites and sulfates (Table 2). It is quite possible that the metal sulfides have decomposed during the cooling down of the half-cells. Alternatively, they are thermodynamically unstable in air and at room temperatures. As shown in the V–O–S predominance diagram at 25 °C (Fig. 12b), it is clearly evident that VOSO4 is the only dominant phase at 25 °C and in wide range of oxygen partial pressures. Thus, the high BE S2p lines observed in this study is quite possibly the S2p spectrum of VOSO4, which results from the oxidation of V2S3 at ambient conditions.
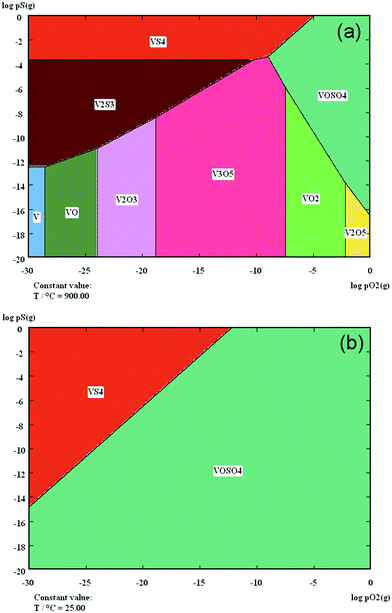 |
| | Fig. 12 The V–O–S predominance diagrams at 900 °C (a) and at 25 °C (b). | |
 |
| | Fig. 13
XPS spectra of S2p for the LSV electrode exposed to H2–50 ppm H2S for 120 h. | |
| Formula |
Binding energy (eV) |
Reference |
|
S2p
|
S2p1/2 |
S2p3/2 |
| Unknown |
166.6 ± 0.1 |
— |
— |
This work |
| VS1.08 |
— |
163.0 ± 0.2 |
162.0 ± 0.2 |
61
|
| VS |
— |
— |
162.3 ± 0.2 |
62
|
| SrS |
— |
— |
160.8 ± 0.2 |
| VS |
162.9 |
— |
— |
63
|
|
V3S4 |
162.2 |
— |
— |
|
V2S3 |
163.0 |
— |
— |
|
V5S8 |
162.8 |
— |
— |
| VS |
161.6 |
— |
— |
64
|
|
V2S3 |
161.9 |
— |
— |
65
|
| SrS |
— |
— |
160.2 |
66
|
| S |
— |
— |
164.8 |
67
|
|
NaSO3 |
— |
— |
166.4 |
68
|
| — |
— |
166.5 |
69
|
| — |
— |
166.6 |
70
|
| 167.0 |
— |
— |
71
|
| — |
— |
167.2 |
72
|
|
CaSO3 |
166.9 |
— |
— |
71
|
|
K2SO3 |
— |
— |
167.5 |
72
|
|
Na2SO4 |
— |
— |
167.5 |
73
|
|
CoSO4 |
— |
— |
168.00 |
70
|
|
NiSO4 |
— |
— |
168.05 |
70
|
In literature, various vanadium-based sulfides had been reported with high electrical conductivity74 and catalytic activity towards H2S oxidation.75 The in situ generated nanoparticles on LSV surfaces, as observed in this study, may lead to enlarged reaction areas and enhanced reaction kinetics, e.g.adsorption/desorption, dissociation, and spillover of intermediate surface species. To some extent, the nanoparticle decoration on the LSV surface is very similar to the impregnation of nano-sized ionic conductors into the electrodes.76 The ultimate goal of impregnation is to decorate the electrocatalyst surfaces with catalytically active nanoparticles. One of the fatal shortcomings of impregnated nanoparticles is their thermal instability. In contrast, the in situ precipitated metal sulfide nanoparticles on LSV surfaces seem to be very stable for more than 500 h. These nanoparticles are generated continuously by the reactions between LSV and H2S during the course of high temperature SOC operations. This is distinctive to the impregnated nanoparticles, which are largely eliminated at elevated temperatures because of the particle sintering. This “in situnanoparticles” approach represents a novel route in tailoring nanostructured electrodes in high temperature energy and conversion devices.
4. Conclusions
The feasibility of reversible SOCs for alternate power generation and carbon conversion had been demonstrated. SOCs with LSV-based hydrogen electrodes survived and showed promising catalytic activity in various simulated gases, e.g. H2, syngas, biogas, town gas, and coal gas. The LSV was a pseudo-cubic perovskite structure. The LSV electrodes exhibited better performance for SOCs operated in the electrolyser mode than in the fuel cell mode. The polarization resistances of LSV electrodes, operated in various atmospheres, polarization modes, and potential biases, were in the range 0.1 to 0.5 Ω cm2. Steady state polarization results showed that the overpotential of LSV electrodes was mostly not higher than 100 mV, under the alternating current density of ±0.2 A cm−2. The LSV electrodes were not choked by deposited carbon when exposed to carbon-forming gases. Most interestingly, LSV electrodes underwent continuous activation, rather than being poisoned, when exposed to various gases containing 50 ppm H2S. LSV-based reversible SOCs, operated under fuel cell and electrolyser modes for more than 500 h, had demonstrated negligible performance degradation in carbon-forming and H2S-containing gases. Nanostructured fine structures were observed in the LSV electrodes after prolonged exposure to 50 ppm H2S. XPS results and thermochemical calculations showed that, quite probably, these nanoparticles were V2S3 but they were oxidized to VOSO4 during the cooling down of the LSV electrodes.
References
- International Energy Agency, Energy Technology Perspectives 2010-Scenarios&Strategies to 2050, 2010 Search PubMed.
- J. Li, Renewable Sustainable Energy Rev., 2010, 14, 1154–1171 CrossRef.
- N. Z. Muradov and T. N. Veziroglu, Int. J. Hydrogen Energy, 2008, 33, 6804–6839 CrossRef CAS.
- M. Pagliaro, A. G. Konstandopoulos, R. Ciriminna and G. Palmisano, Energy Environ. Sci., 2010, 3, 279–287 CAS.
- K.-F. Aguey-Zinsou and J.-R. Ares-Fernandez, Energy Environ. Sci., 2010, 3, 526–543 CAS.
- J. Baker, Energy Policy, 2008, 36, 4368–4373 CrossRef.
- N. Q. Minh, J. Am. Ceram. Soc., 1993, 76, 563–588 CrossRef CAS.
- A. J. Jacobson, Chem. Mater., 2010, 22, 660–674 CrossRef CAS.
- W. Doenitz, R. Schmidberger, E. Steinheil and R. Streicher, Int. J. Hydrogen Energy, 1980, 5, 55–63 CrossRef CAS.
- A. Hauch, S. D. Ebbesen, S. H. Jensen and M. Mogensen, J. Electrochem. Soc., 2008, 155, B1184–B1193 CrossRef CAS.
- D. M. Bierschenk, J. R. Wilson and S. A. Barnett, Energy Environ. Sci., 2011, 4, 944–951 CAS.
- US Department of Energy, Fuel Cell Handbook, 7th edn, Morgantown, 2004. Search PubMed.
- Q. Fu, C. Mabilat, M. Zahid, A. Brisse and L. Gautier, Energy Environ. Sci., 2010, 3, 1382–1397 CAS.
- International Energy Agency, How the Energy Sector can Deliver on a Climate Agreement in Copenhagen, 2009 Search PubMed.
- B. W. Terwel, F. Harinck, N. Ellemers and D. D. L. Daamen, Int. J. Greenhouse Gas Control, 2011, 5, 181–188 CrossRef.
- G. Ferey, C. Serre, T. Devic, G. Maurin, H. Jobic, P. L. Llewellyn, G. De Weireld, A. Vimont, M. Daturi and J. S. Chang, Chem. Soc. Rev., 2011, 40, 550–562 RSC.
- S. McIntosh and R. J. Gorte, Chem. Rev., 2004, 104, 4845–4865 CrossRef CAS.
- M. L. Toebes, J. H. Bitter, A. J. van Dillen and K. P. de Jong, Catal. Today, 2002, 76, 33–42 CrossRef CAS.
- Y. Matsuzaki and I. Yasuda, Solid State Ionics, 2000, 132, 261–269 CrossRef CAS.
- S. W. Zha, Z. Cheng and M. L. Liu, J. Electrochem. Soc., 2007, 154, B201–B206 CrossRef CAS.
- S. D. Ebbesen and M. Mogensen, J. Power Sources, 2009, 193, 349–358 CrossRef CAS.
- S. D. Ebbesen and M. Mogensen, Electrochem. Solid-State Lett., 2010, 13, D106–D108 CrossRef.
- S. D. Ebbesen, C. Graves, A. Hauch, S. H. Jensen and M. Mogensen, J. Electrochem. Soc., 2010, 157, B1419–B1429 CrossRef CAS.
- N. Lakshminarayanan and U. S. Ozkan, Appl. Catal., A, 2011, 393, 138–145 CrossRef CAS.
- L. Yang, Z. Cheng, M. L. Liu and L. Wilson, Energy Environ. Sci., 2010, 3, 1804–1809 CAS.
- O. A. Marina, C. A. Coyle, M. H. Engelhard and L. R. Pederson, J. Electrochem. Soc., 2011, 158, B424–B429 CrossRef CAS.
- H. Kurokawa, T. Z. Sholklapper, C. P. Jacobson, L. C. De Jonghe and S. J. Visco, Electrochem. Solid-State Lett., 2007, 10, B135–B138 CrossRef CAS.
- J. W. Yun, S. P. Yoon, J. Han, S. Park, H. S. Kim and S. W. Nam, J. Electrochem. Soc., 2010, 157, B1825–B1830 CrossRef CAS.
- R. Lohsoontorn, D. J. L. Brett and N. P. Brandon, J. Power Sources, 2008, 183, 232–239 CrossRef.
- S. H. Choi, J. H. Wang, Z. Cheng and M. Liu, J. Electrochem. Soc., 2008, 155, B449–B454 CrossRef CAS.
- N. U. Pujare, K. W. Semkow and A. F. Sammells, J. Electrochem. Soc., 1987, 134, 2639–2640 CrossRef CAS.
- C. Yates and J. Winnick, J. Electrochem. Soc., 1999, 146, 2841–2844 CrossRef CAS.
- M. Liu, G. L. Wei, J. L. Luo, A. R. Sanger and K. T. Chuang, J. Electrochem. Soc., 2003, 150, A1025–A1029 CrossRef CAS.
- R. Mukundan, E. L. Brosha and F. H. Garzon, Electrochem. Solid-State Lett., 2004, 7, A5–A7 CrossRef CAS.
- L. Aguilar, S. W. Zha, Z. Cheng, J. Winnick and M. L. Liu, J. Power Sources, 2004, 135, 17–24 CrossRef CAS.
- S. W. Zha, Z. Cheng and M. L. Liu, Electrochem. Solid-State Lett., 2005, 8, A406–A408 CrossRef CAS.
- Z. R. Xu, J. L. Luo, K. T. Chuang and A. R. Sanger, J. Phys. Chem. C, 2007, 111, 16679–16685 CAS.
- X. C. Lu and J. H. Zhu, J. Electrochem. Soc., 2008, 155, B1053–B1057 CrossRef CAS.
- N. Danilovic, J. L. Luo, K. T. Chuang and A. R. Sanger, J. Power Sources, 2009, 192, 247–257 CrossRef CAS.
- S. W. Zha, P. Tsang, Z. Cheng and M. L. Liu, J. Solid State Chem., 2005, 178, 1844–1850 CrossRef CAS.
- M. Cooper, K. Channa, R. De Silva and D. J. Bayless, J. Electrochem. Soc., 2010, 157, B1713–B1718 CrossRef CAS.
- M. Sayer, R. Chen, R. Fletcher and A. Mansingh, J. Phys. C: Solid State Phys., 1975, 8, 2059–2071 CrossRef CAS.
- J. B. Webb and M. Sayer, J. Phys. C: Solid State Phys., 1976, 9, 4151–4164 CrossRef CAS.
- A. V. Mahajan, D. C. Johnston, D. R. Torgeson and F. Borsa, Phys. Rev. B: Condens. Matter, 1992, 46, 10973–10985 CrossRef CAS.
- S. Q. Hui and A. Petric, Solid State Ionics, 2001, 143, 275–283 CrossRef CAS.
- L. Aguilar, S. W. Zha, S. W. Li, J. Winnick and M. Liu, Electrochem. Solid-State Lett., 2004, 7, A324–A326 CrossRef CAS.
- Z. Cheng, S. W. Zha, L. Aguilar and M. L. Liu, Solid State Ionics, 2005, 176, 1921–1928 CrossRef CAS.
- Z. Cheng, S. W. Zha, L. Aguilar, D. Wang, J. Winnick and M. L. Liu, Electrochem. Solid-State Lett., 2006, 9, A31–A33 CrossRef CAS.
- C. Peng, J. L. Luo, A. R. Sanger and K. T. Chuang, Chem. Mater., 2010, 22, 1032–1037 CrossRef CAS.
- C. T. G. Petit, R. Lan, P. I. Cowin, J. T. S. Irvine and S. W. Tao, J. Mater. Chem., 2011, 21, 525–531 RSC.
- A. Aguadero, C. de la Calle, D. Perez-Coll and J. A. Alonso, Fuel Cells, 2011, 11, 44–50 CrossRef CAS.
- X. M. Ge and S. H. Chan, J. Electrochem. Soc., 2009, 156, B386–B391 CrossRef CAS.
- X. M. Ge, C. F. Fu and S. H. Chan, Electrochem. Commun., 2011, 13, 792–795 CrossRef CAS.
- X. M. Ge, C. F. Fu and S. H. Chan, Phys. Chem. Chem. Phys., 2011, 13, 15134 RSC.
- X. M. Ge, C. F. Fu and S. H. Chan, Electrochim. Acta, 2011, 56, 5947–5953 CrossRef CAS.
- S. W. Tao and J. T. S. Irvine, Nat. Mater., 2003, 2, 320–323 CrossRef CAS.
- J. C. Ruiz-Morales, J. Canales-Vazquez, C. Savaniu, D. Marrero-Lopez, W. Z. Zhou and J. T. S. Irvine, Nature, 2006, 439, 568–571 CrossRef CAS.
- X. Yang and J. T. S. Irvine, J. Mater. Chem., 2008, 18, 2349–2354 RSC.
- C. Jin, C. H. Yang, F. Zhao, D. Cui and F. L. Chen, Int. J. Hydrogen Energy, 2011, 36, 3340–3346 CrossRef CAS.
- Q. A. Liu, C. H. Yang, X. H. Dong and F. L. Chen, Int. J. Hydrogen Energy, 2010, 35, 10039–10044 CrossRef CAS.
- H. F. Franzen and G. A. Sawatzky, J. Solid State Chem., 1975, 15, 229–232 CrossRef CAS.
- H. F. Franzen, M. X. Umaña, J. R. McCreary and R. J. Thorn, J. Solid State Chem., 1976, 18, 363–368 CrossRef CAS.
- W. Bensch and R. Schlogl, J. Solid State Chem., 1993, 107, 43–57 CrossRef CAS.
- J. Gopalakrishnan, T. Murugesan, M. S. Hegde and C. N. R. Rao, J. Phys. C: Solid State Phys., 1979, 12, 5255 CrossRef CAS.
- D. Lichtman, J. H. Craig, V. Sailer and M. Drinkwine, Appl. Surf. Sci., 1981, 7, 325–331 CrossRef CAS.
- R. P. Vasquez, J. Electron Spectrosc. Relat. Phenom., 1991, 56, 217–240 CrossRef CAS.
- J. M. Thomas, R. H. Williams, M. Barber and I. Adams, J. Chem. Soc., Faraday Trans. 2, 1972, 68, 755–764 RSC.
- K. M. Abraham and S. M. Chaudhri, J. Electrochem. Soc., 1986, 133, 1307–1311 CrossRef CAS.
- C. D. Wagner and J. A. Taylor, J. Electron Spectrosc. Relat. Phenom., 1982, 28, 211–217 CrossRef CAS.
- X. R. Yu, F. Liu, Z. Y. Wang and Y. Chen, J. Electron Spectrosc. Relat. Phenom., 1990, 50, 159–166 CrossRef CAS.
- R. V. Siriwardane and J. M. Cook, J. Colloid Interface Sci., 1986, 114, 525–535 CrossRef CAS.
- N. H. Turner, J. S. Murday and D. E. Ramaker, Anal. Chem., 1980, 52, 84–92 CrossRef CAS.
- W. E. Swartz, K. J. Wynne and D. M. Hercules, Anal. Chem., 1971, 43, 1884–1887 CrossRef.
- N. Kijima, S. Ikeda, I. Shimono, T. Matsumoto, S. Tsuji, K.-i. Kumagai and S. Nagata, J. Solid State Chem., 1996, 126, 189–194 CrossRef CAS.
- K. T. Li, M. Y. Huang and W. D. Cheng, Ind. Eng. Chem. Res., 1996, 35, 621–626 CrossRef CAS.
- S. P. Jiang, Mater. Sci. Eng., A, 2006, 418, 199–210 CrossRef.
Footnote |
| † When hydrogen electrode is referred in SOCs, it is the anode for SOFCs and the negative electrode for SOECs. |
|
| This journal is © The Royal Society of Chemistry 2011 |
Click here to see how this site uses Cookies. View our privacy policy here. 
![[thin space (1/6-em)]](https://www.rsc.org/images/entities/char_2009.gif) :
:![[thin space (1/6-em)]](https://www.rsc.org/images/entities/char_2009.gif) 3. Stoichiometric amounts of the raw materials were dissolved in deionised water. The solution was heated at 70 °C and under magnetic stirring. A dark blue gel was obtained after dissipating excess water. It was dehydrated overnight at 100 °C and then grounded in an agate mortar. The precursor was baked at 600 °C for 2 h. The LSV powers were further baked at 600 °C for 2 h and at 800 °C for 6 h. 8 mol% yttria-stabilized zirconia (YSZ, Tosoh Japan) was used as-received.
3. Stoichiometric amounts of the raw materials were dissolved in deionised water. The solution was heated at 70 °C and under magnetic stirring. A dark blue gel was obtained after dissipating excess water. It was dehydrated overnight at 100 °C and then grounded in an agate mortar. The precursor was baked at 600 °C for 2 h. The LSV powers were further baked at 600 °C for 2 h and at 800 °C for 6 h. 8 mol% yttria-stabilized zirconia (YSZ, Tosoh Japan) was used as-received.
![[thin space (1/6-em)]](https://www.rsc.org/images/entities/char_2009.gif) 000–0.05 Hz. The sampling rate was 10 points/decade of frequency. Long-term stability tests were performed viachronopotentiometry, i.e. monitoring the electric potentials under given current densities. The sampling rate of chronopotentiometry was 0.2 points/s.
000–0.05 Hz. The sampling rate was 10 points/decade of frequency. Long-term stability tests were performed viachronopotentiometry, i.e. monitoring the electric potentials under given current densities. The sampling rate of chronopotentiometry was 0.2 points/s.

