Large-scale synthesis of coordination polymer microdendrites and their application as a sensing platform for fluorescent DNA detection†
Hailong
Li
ab,
Junfeng
Zhai
a and
Xuping
Sun
*a
aState Key Lab of Electroanalytical Chemistry, Changchun Institute of Applied Chemistry, Chinese Academy of Sciences, Changchun, 130022, Jilin, China. E-mail: sunxp@ciac.jl.cn; Fax: (+86) 431-85262065; Tel: (+86) 431-85262065
bGraduate School of the Chinese Academy of Sciences, Beijing, 100039, China
First published on 2nd September 2011
Abstract
In this paper, we report on the large-scale, rapid synthesis of coordination polymer microdendrites (CPMDs) assembled from Pd(II) and p-phenylenediamine for the first time. We further explored the use of the CPMDs as an effective fluorescent sensing platform for DNA detection. This sensing system exhibits a low detection limit of 13 nM and a high selectivity down to single-base mismatch. The detection is accomplished in two steps: (1) CPMDs adsorb the dye-labeled single-stranded DNA probe and quenches the fluorescence; (2) in the presence of the target, a hybridization event occurs, which produces a double-stranded DNA that detaches from the CPMD surface, leading to the recovery of the dye fluorescence.
Introduction
Detection of specific DNA sequences is crucial to molecular diagnostics for pathogen detection and biomedical research. The past years have witnessed the growing importance of developing specific methods for DNA detection, which has various applications in gene expression profiling, clinical disease diagnostics and treatment, fast detection of biological warfare agents, and forensic applications etc.1 The humanitarian and economic costs of infectious diseases can be greatly reduced by accurate diagnosis, which enables prompt treatment. It is especially important to develop simple, fast, cost-effective, and sensitive methods for this purpose. Detecting genetic mutations at the molecular level permits reliable disease diagnostics in clinical practice, even before any symptom of a disease appears. Until now, numerous optical and electrochemical DNA sequencing approaches based on the hybridization between a target and its complementary probe have been successfully established.2–4 The introduction of a simple fluorescence labeling method of nucleic acids has opened the door, enables further research and development of nucleic acid hybridization probes.4 Indeed, many efforts have recently been devoted to develop homogeneous fluorescence assays for DNA sequence detection, based on FRET (fluorescence resonance energy transfer) or quenching mechanisms.5 Because nanostructures can quench dyes of different emission frequencies, the nanostructure-based system has the advantage of eliminating the selection issue of fluorophore-quencher pairs.5,6 Until now, many different structures have been used in this assay, including gold nanoparticles, single-walled carbon nanotubes (SWCNTs), graphene oxide, multi-walled carbon nanotubes, carbon nanoparticles, carbon nanospheres, nano-C60, mesoporous carbon microparticles, poly(p-phenylenediamine) nanobelts, Ag@poly(m-phenylenediamine) core-shell nanoparticles, poly(m-phenylenediamine) nanorods, supramolecular microparticles, porphyrin nanoparticlesetc.5–7 In principal, structures suitable as an ideal platform for this assay should satisfy the following two requirements: (1) they have strong binding with single-stranded DNA (ssDNA) but weak even no binding with double-stranded DNA (dsDNA); (2) they do not fluoresce or only have weak fluorescence and can quench dye fluorescence very effectively at the same time.Coordination polymers (CPs) are a new class of organic–inorganic hybrid materials, in which metal ions are linked together by organic bridging ligands. CPs have been developed extremely rapidly due to their versatile properties provoked by combining the merits of two sources and may find applications in many fields.8 Only until recently, however, have CPs been used for DNA detection by us where coordination polymer colloids (CPCs) and coordination polymer nanobelts (CPNBs)9 were used as a quencher, but these systems have drawbacks, which limit their practical use. For the CPC-based system, a period of several hours is required to prepare CPCs. The CPNB-based system suffers from that the gradual reduction of Ag(I) by 4,4′-bipyridine with elapsed time leads to Ag nanoparticle-decorated nanobelts. In this paper, for the first time, we report on the large-scale, rapid synthesis of coordination polymer microdenrites (CPMDs) assembled from Pd(II) and p-phenylenediamine, carried out by directly mixing aqueous H2PdCl4 and p-phenylenediamine solutions at room temperature. These CPMDs have high surface-to-volume ratio and thus may be expected to have better performance as a fluorescent sensing platform for DNA detection compared to our previous CP structures.9 With this in mind, we further explore the use of these CPMDs as a fluorescence sensing platform for DNA detection. It is found that this sensing system has a detection limit as low as 13 nM and a high selectivity down to single-base mismatches. Such CPMDs are found to be superior to CPCs and CPNBs in kinetics of probe adsorption and its hybridization with its target. The present method can also discriminate single-base mismatches in the target sequence embedded in longer DNA strands.
Experimental
All oligonucleotides used here were purchased from Shanghai Sangon Biotechnology Co. Ltd. (Shanghai, China). DNA concentration was determined by measuring the absorbance at 260 nm. All the other chemicals were purchased from Aladin Ltd. (Shanghai, China) and used as received without further purification. The water used throughout all experiments was purified through a Millipore system.Oligonucleotide sequences used are listed below (mismatches are underlined):
(1) PHIV (FAM dye-labeled ssDNA):
5′-FAM-AGT CAG TGT GGA AAA TCT CTA GC-3′
(2) T1 (complementary target to PHIV):
5′-GCT AGA GAT TTT CCA CAC TGA CT-3′
(3) T2 (single-base mismatched target to PHIV):
5′-GCT AGA GAT T![[G with combining low line]](https://www.rsc.org/images/entities/char_0047_0332.gif) T CCA CAC TGA CT-3′
T CCA CAC TGA CT-3′
(4) T3 (two-base mismatched target to PHIV):
5′-GCT AGA GAT TT ![[A with combining low line]](https://www.rsc.org/images/entities/char_0041_0332.gif) CA CAC TGA CT-3′
CA CAC TGA CT-3′
(5) T4 (three-base mismatched target to PHIV):
5′-GCT TA GAT TT CA CAC TGA CT-3′
(6) TL1 (The middle part of a long strand as a target complementary to PHIV):
5′-TTT TTT TTT TTT TTT TTT TTT TGC TAG AGA TTT TCC ACA CTG ACT TTT TTT TTT TTT TTT TTT TTT T-3′
(7) TL2 (The middle part of a long strand as a single-base mismatched target to PHIV):
5′-TTT TTT TTT TTT TTT TTT TTT TGC TAG AGA TT TCC ACA CTG ACT TTT TTT TTT TTT TTT TTT TTT T-3′
CPMDs were prepared by adding 184 μL of 0.25 M p-phenylenediamine aqueous solution into 40 mL of 2.325 mM H2PdCl4 (23.3 mg) aqueous solution at room temperature under stirring. After the mixing of these two solutions, a large amount of yellow precipitates occurred immediately. The resulting precipitates were washed twice with waterviacentrifugation and were weighted to be about 18 mg after air drying. The yield is calculated to be 77%. The precipitates were then re-dispersed in 4 mL of water to give a dispersion with a concentration of 4.5 mg mL−1 for further characterization and use.
For characterization by scanning electron microscopy (SEM), 20 μL of the suspension was placed on an indium tin oxide (ITO) glass slide and air-dried at room temperature. SEM measurements were made on a XL30 ESEM FEG scanning electron microscope at an accelerating voltage of 20 kV. Transmission electron microscopy (TEM) measurements were made on a HITACHI H-8100 EM (Hitachi, Tokyo, Japan) with an accelerating voltage of 100 kV. The sample for TEM measurements was prepared by placing a dilution of the colloidal solution on a carbon-coated copper grid and drying at room temperature. Fluorescent emission spectra were recorded on a RF-5301PC spectrofluorometer (Shimadzu, Japan). Zeta potential measurements were performed on a Nano-ZS Zetasizer ZEN3600 (Malvern Instruments Ltd., U.K.). An energy-dispersive X-ray spectroscopic detecting unit was used to collect the energy-dispersed spectrum (EDS) for elemental analysis.
The desired DNA concentration was achieved by diluting the concentrated DNA stock solutions with 20 mM Tris-HCl buffer containing 100 mM NaCl, 5 mM KCl, and 5 mM MgCl2 (pH: 7.4). The volume of each sample for fluorescence measurement is 300 μL. All the experiments were carried out at room temperature (about 25 °C) if not specified.
Results and discussion
Mixing the aqueous H2PdCl4 and p-phenylenediamine solutions resulted in the immediate formation of a large amount of yellow precipitate. Fig. 1A shows the SEM image of the resultant precipitates, demonstrating that they consist of a large amount of dendritic microparticles with diameter ranging from 1 to 1.5 μm. Fig. 1B shows the corresponding TEM image (inset: a local view of one single particle), further revealing the dendritic nature of the microparticles. The chemical composition of these microdendrites was determined by energy-dispersive spectrum (EDS), as shown in Fig. S1A, ESI†. The peaks of C, N, Pd, and Cl elements are observed (other peaks originate from the ITO substrate used for EDS analysis, as shown in Fig. S1B, ESI†), indicating that these microdendrites are the coordination products formed from p-phenylenediamine and H2PdCl4.8f | ||
| Fig. 1 (A) SEM image and (B) TEM image of the precipitates formed. Inset: a local view of one single microparticle. | ||
The feasibility of using CPMDs as a novel effective fluorescent sensing platform for nucleic acid detection was evaluated by using an oligonucleotide sequence associated with human immunodeficiency virus (HIV) as a model system. Fig. 2 is the fluorescence emission spectra of PHIV, the FAM-labeled probe, under different conditions. In the absence of CPMDs, the fluorescence spectrum of PHIV exhibits strong fluorescence emission due to the presence of the fluorescein-based dye (curve a). However, the presence of CPMDs results in about 37% quenching of the fluorescence emission (curve c), indicating that the CPMDs can adsorb ssDNA and quench the fluorescent dye. Upon incubation of the PHIV–CPMD complex with complementary target T1 over 30 min, fluorescence shows significant enhancement, leading to about 89% fluorescence recovery (curve d). It should be noted that the fluorescence of the free PHIV was, however, scarcely influenced by the addition of T1 in the absence of CPMDs (curve b). Fig. 2 inset illustrates the fluorescence intensity changes (F/F0−1) of PHIV–CPMD complex upon addition of different concentrations of T1, where F0 and F are FAM fluorescence intensities at 518 nm in the absence and presence of T1, respectively. In the DNA concentration range of 5–300 nM, a dramatic increase of FAM fluorescence intensity was observed, indicating that the CPMD–DNA assembly approach is effective in probing biomolecular interactions. A detection limit as low as 13 nM was achieved (three times the standard deviation of a blank sample).
 | ||
| Fig. 2 Fluorescence emission spectra of PHIV (50 nM) under different conditions: (a) PHIV; (b) PHIV + 300 nM T1; (c) PHIV + CPMDs; (d) PHIV + CPMDs + 300 nM T1. Inset: fluorescence intensity changes (F/F0−1) of PHIV–CPMD complex plotted against the logarithm of the concentration of T1 (nM), where F0 and F are the fluorescence intensity without and with the presence of T1, respectively. The volume of CPMDs used in each sample is 2 μL. Excitation was at 480 nm, and the emission was monitored at 518 nm. All measurements were done in Tris-HCl buffer in the presence of 5 mM Mg2+(pH: 7.4). | ||
We also studied the influence of the amount of CPMDs used on the fluorescence quenching and the subsequent fluorescence recovery of seven samples with the use of different amount of CPMDs. It is found that the quenching efficiency increases but the recovery efficiency decreases with the volume of CPMDs increasing from 0 to 6 μL (Fig. 3). Such phenomenon is not a surprise based on the following considerations: involvement of more CPMDs leads to more efficient adsorption of ssDNA on them and thus maximizes the fluorescence quenching of dyes. However, such condition results in the adsorption of some targets onto the vacancy of CPMD surface, suppressing their hybridization with probe ssDNA and generating decreased fluorescence recovery efficiency. Based on above experimental results, an optimal volume of 2 μL was chosen in our present study for all measurements unless specified.
![Fluorescence intensity histograms of PHIV + CPMDs and PHIV + CPMDs + T1 with the use of 0, 1, 2, 3, 4, 5, and 6 μL of CPMDs, respectively ([PHIV]=50 nM; [T1]=300 nM). Excitation was at 480 nm, and the emission was monitored at 518 nm. All measurements were done in Tris-HCl buffer in the presence of 5 mM Mg2+ (pH: 7.4).](/image/article/2011/RA/c1ra00359c/c1ra00359c-f3.gif) | ||
| Fig. 3 Fluorescence intensity histograms of PHIV + CPMDs and PHIV + CPMDs + T1 with the use of 0, 1, 2, 3, 4, 5, and 6 μL of CPMDs, respectively ([PHIV]=50 nM; [T1]=300 nM). Excitation was at 480 nm, and the emission was monitored at 518 nm. All measurements were done in Tris-HCl buffer in the presence of 5 mM Mg2+ (pH: 7.4). | ||
CPMD is a π-rich structure and thus there should be strong π–π stacking interactions between ssDNA bases and CPMD.10 The zeta potential of the microdendrites was measured to be about 2.9 mV in Tris-HCl buffer, indicating that CPMD has a low positive surface charge density. So, the electrostatic attractive interactions between CPMD and negatively charged backbone of ssDNA also contribute to the adsorption of ssDNA on CPMD. However, the slight electrostatic attractive interaction only makes a little contribution to the adsorption of ssDNA on CPMD in the presence of a large amount of salt in the buffer.7o In contrast, CPMD should have weak or no binding with dsDNA due to the absence of unpaired DNA bases and the rigid conformation of dsDNA. Scheme 1 presents a schematic to illustrate the fluorescence-enhanced nucleic acid detection using CPMD as a sensing platform. The DNA detection is accomplished by the following two steps: (1) The adsorption of fluorescent FAM-labeled ssDNA onto CPMDvia π–π stacking leads to fluorescence quenching due to their close proximity. The absorption spectrum of CPMDs dispersed in Tris-HCl buffer (pH 7.4) exhibits a weak broad absorption peak at about 385 nm (as shown in Fig. S2, ESI†), indicating that there is no spectral overlap and thus no FRET occurs between CPMD and the fluorescent dye FAM. We can attribute the observed fluorescence quenching in our present study to photoinduced electron transfer (PET) from nitrogen atom in CPMD to the excited fluorophore due to their close proximity.7p,11 When the fluorophore is excited, an electron from the highest occupied molecular orbital (HOMO) is promoted to the lowest unoccupied molecular orbital (LUMO), leaving an electronic vacancy in the fluorophore HOMO. The resultant electronic vacancy is filled by transfer of an electron from the higher energy HOMO of the nitrogen atom in CPMD, which serves as a donor. This electron transfer leads to substantial fluorescence quenching. (2) Upon the presence of a target sequence, the specific hybridization between the dye-labeled DNA and its target leads to fluorescence recovery. This hybridization will disturb the interaction between the dye-labeled ssDNA and CPMD, producing a dsDNA, which detaches from CPMD.
 | ||
| Scheme 1 A scheme (not to scale) to illustrate the fluorescence-enhanced nucleic acid detection using CPMD as a sensing platform. | ||
The kinetic behaviors of PHIV and CPMDs, as well as of the PHIV–CPMD complex with T1 was subsequently investigated by collecting the time-dependent fluorescence emission spectra, as shown in Fig. 4 (error bars were obtained by repeating the same measurement three times). Plot a in Fig. 4 shows the fluorescence quenching of PHIV in the presence of CPMDs as a function of the incubation time. In the absence of the target, the curve exhibits a rapid reduction in the first 2 min and reaches equilibrium within the following 5 min, indicating that ssDNA adsorption on CPMD is much faster than on CPC and CPNB.9 Plot b in Fig. 4 shows the fluorescence recovery of PHIV–CPMD by T1 as a function of incubation time. In the presence of the target T1, the curve shows a fast increase in the first 1 min, followed by a slow fluorescence enhancement over a period of 10 min. The best fluorescence response was achieved after about 15 min incubation. It suggests that the kinetics of the hybridization of the probe adsorbed on CPMD to its target and the subsequent release of the dsDNA thus formed from CPMD are faster than on CPC and CPNB.9
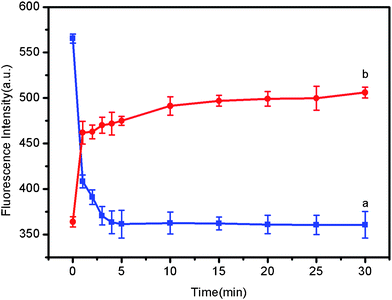 | ||
| Fig. 4 (a) Fluorescence quenching of PHIV (50 nM) by CPMDs and (b) fluorescence recovery of PHIV–CPMD by T1 (300 nM) as a function of incubation time. The volume of CPMDs used in each sample is 2 μL. Excitation was at 480 nm, and the emission was monitored at 518 nm. All measurements were done in Tris-HCl buffer in the presence of 5 mM Mg2+ (pH: 7.4). | ||
In further experiments, the discrimination ability of the present sensing platform toward complementary and mismatched target sequences was evaluated. Fig. 5 shows the fluorescence responses of the PHIV–CPMD complex toward complementary target T1, single-base mismatched target T2, and two-base mismatched target T3. It is observed that the F/F0 value (F0 and F are the fluorescence intensity without and with the presence of the target, respectively) obtained upon addition of 300 nM T2 and T3 is about 93% and 73% of the value obtained upon addition of 300 nM T1 into the PHIV–CPMD complex. Only a very small fluorescence change was observed for the PHIV–CPMD upon addition of 300 nM T3, indicating that the fluorescence enhancement in our present system is indeed due to the base pairing between the probe and its target, other than competitive binding. Compared to the complementary target, the mismatched target should have lower hybridization ability toward the ssDNA probe. As a result, a decreased hybridization and thus fluorescence recovery efficiency is observed. All the above observations indicate that the present sensing system can well discriminate complementary and mismatched DNA sequences with good reproducibility.
 | ||
| Fig. 5 Fluorescence emission spectra of PHIV (50 nM) under different conditions: (a) PHIV–CPMD complex; (b) PHIV–CPMD complex + 300 nM T1; (c) PHIV–CPMD complex + 300 nM T2; (d) PHIV–CPMD complex + 300 nM T3. Inset: fluorescence intensity histograms with error bars. Excitation was at 480 nm, and the emission was monitored at 518 nm. The volume of CPMDs used in each sample is 2 μL. All measurements were done in Tris-HCl buffer in the presence of 5 mM Mg2+ (pH: 7.4). | ||
This discrimination ability of this sensing platform was also evaluated by detecting specific sequences on much longer DNA targets. For this purpose, two long DNA strands were chosen as targets: TL1, the middle part of which is complementary sequence to PHIV; TL2, the middle part of which is single-base mismatched sequence to PHIV. Fig. 6 shows the fluorescence responses of PHIV toward TL1 and TL2 in the presence of CPMDs at room temperature. The addition of 300 nM TL1 to PHIV–CPMD complex leads to about 75% fluorescence recovery, which is much lower than 89% observed when 300 nM T1 was used as the target. It can be attributed to that PHIV–TL1 is a complex with a duplex segment in the middle and two single strands on both ends and thus there are unpaired DNA bases for binding to CPMD. The F/F0 value obtained upon addition of 300 nM TL2 is about 95% of the value obtained upon addition of 300 nM TL1 into the PHIV–CPMD complex, indicating that this sensing platform is still capable of distinguishing complementary and single-base mismatched target sequences in a long DNA strand with a short oligonucleotide probe.
 | ||
| Fig. 6 Fluorescence emission spectra of PHIV (50 nM) in the presence of CPMDs under different conditions: (a) PHIV–CPMD complex; (b) PHIV–CPMD complex + 300 nM TL1; (c) PHIV–CPMD complex + 300 nM TL2. Inset: fluorescence intensity histograms with error bars. Excitation was at 480 nm, and the emission was monitored at 518 nm. The volume of CPMDs used in each sample is 2 μL. All measurements were done in Tris-HCl buffer in the presence of 5 mM Mg2+ (pH: 7.4). | ||
Conclusions
In summary, CPMDs assembled from Pd(II) and p-phenylenediamine can be rapidly prepared on a large scale by directly mixing aqueous H2PdCl4 and p-phenylenediamine solutions at room temperature. Such microdendrites have been proven to be an effective fluorescent sensing platform for DNA detection with a detection limit as low as 13 nM and a high selectivity down to a single-base mismatch. Our present observations are significant for the following two reasons: (1) it provides us a facile method for the rapid and large-scale synthesis of CPMDs for DNA detection; (2) Such CPMDs are promising as a universal and effective sensing platform for a fluorescence-enhanced detection sensitive and selective to the target molecule studied.Acknowledgements
This work was supported by National Basic Research Program of China (No. 2011CB935800).References
- D. Gresham, D. M. Ruderfer, S. C. Pratt, J. Schacherer, M. J. Dunham, D. Botstein and L. Kruglyak, Science, 2006, 311, 1932 CrossRef CAS.
- R. Brayner, Nano Today, 2008, 3, 48 CrossRef.
- A. Sassolas, B. D. Leca-Bouvier and L. J. Blum, Chem. Rev., 2008, 108, 109 CrossRef CAS.
- Fluorescent energy transfer nucleic acid probes: methods and protocols, ed. V. V.Didenko, New Jersey: Human Press, Totowa, 2006.
- P. C. Ray, G. K. Darbha, A. Ray, J. Walker and W. Hardy, Plasmonics, 2007, 2, 173 CrossRef CAS.
- R. Yang, Z. Tang, J. Yan, H. Kang, Y. Kim, Z. Zhu and W. Tan, Anal. Chem., 2008, 80, 7408 CrossRef CAS.
- (a) B. Dubertret, M. Calame and A. J. Libchaber, Nat. Biotechnol., 2001, 19, 365 CrossRef CAS; (b) D. J. Maxwell, J. R. Taylor and S. Nie, J. Am. Chem. Soc., 2002, 124, 9606 CrossRef CAS; (c) H. Li and L. J. Rothberg, Anal. Chem., 2004, 76, 5414 CrossRef CAS; (d) S. Song, Z. Liang, J. Zhang, L. Wang, G. Li and C. Fan, Angew. Chem., Int. Ed., 2009, 48, 8670 CrossRef CAS; (e) D. Li, S. Song and C. Fan, Acc. Chem. Res., 2010, 43, 631 CrossRef CAS; (f) R. Yang, J. Jin, Y. Chen, N. Shao, H. Kang, Z. Xiao, Z. Tang, Y. Wu, Z. Zhu and W. Tan, J. Am. Chem. Soc., 2008, 130, 8351 CrossRef CAS; (g) C. Lu, H. Yang, C. Zhu, X. Chen and G. Chen, Angew. Chem., Int. Ed., 2009, 48, 4785 CrossRef CAS; (h) S. He, B. Song, D. Li, C. Zhu, W. Qi, W. Wen, L. Wang, S. Song, H. Fang and C. Fan, Adv. Funct. Mater., 2010, 20, 453 CrossRef CAS; (i) H. Li, J. Tian, L. Wang, Y. Zhang and X. Sun, J. Mater. Chem., 2011, 21, 824 RSC; (j) H. Li, Y. Zhang, L. Wang, J. Tian and X. Sun, Chem. Commun., 2011, 47, 961 RSC; (k) H. Li, Y. Zhang, T. Wu, S. Liu, L. Wang and X. Sun, J. Mater. Chem., 2011, 21, 4663 RSC; (l) H. Li, Y. Zhang, Y. Luo and X. Sun, Small, 2011, 7, 1562 CrossRef CAS; (m) S. Liu, H. Li, L. Wang, J. Tian and X. Sun, J. Mater. Chem., 2011, 21, 339 RSC; (n) L. Wang, Y. Zhang, J. Tian, H. Li and X. Sun, Nucleic Acids Res., 2010, 39, e37 CrossRef; (o) Y. Zhang, L. Wang, J. Tian, H. Li, Y. Luo and X. Sun, Langmuir, 2011, 27, 2170 CrossRef CAS; (p) Y. Zhang, H. Li, Y. Luo, X. Shi, J. Tian and X. Sun, PLoS ONE, 2011, 6, e20569 CAS; (q) H. Li, J. Zhai and X. Sun, PLoS ONE, 2011, 6, e18958 CAS; (r) J. Zhai, H. Li and X. Sun, RSC Adv., 2011, 1, 36 RSC.
- (a) S. L. James, Chem. Soc. Rev., 2003, 32, 276 RSC; (b) M. Eddaoudi, D. B. Moler, H. Li, B. Chen, T. M. Reineke, M. O'Keeffe and O. M. Yaghi, Acc. Chem. Res., 2001, 34, 319 CrossRef CAS; (c) A. Mederos, S. Domínguez, R. Hernández-Molina, J. Sanchiz and F. Brito, Coord. Chem. Rev., 1999, 193–195, 857 CrossRef CAS; (d) A. Mederos, S. Domínguez, R. Hernández-Molina, J. Sanchiz and F. Brito, Coord. Chem. Rev., 1999, 193–195, 913 CrossRef CAS; (e) A. M. Spokoyny, D. Kim, A. Sumrein and C. A. Mirkin, Chem. Soc. Rev., 2009, 38, 1218 RSC; (f) X. Sun, S. Dong and E. Wang, J. Am. Chem. Soc., 2005, 127, 13102 CrossRef CAS.
- (a) H. Li and X. Sun, Chem. Commun., 2011, 47, 2625 RSC; (b) Y. Luo, F. Liao, W. Lu, G. Chang G and X. Sun, Nanotechnology, 2011, 22, 195502 CrossRef; (c) H. Li, L. Wang, Y. Zhang, J. Tian and X. Sun, Macromol. Rapid Commun., 2011, 32, 899 CrossRef CAS.
- N. Varghese, U. Mogera, A. Govindaraj, A. Das, P. K. Maiti, A. K. Sood and C. N. R. Rao, ChemPhysChem, 2009, 10, 206 CrossRef CAS.
- V. Bernard , Molecular fluorescence: Principles and applications, Wiley-VCH, 2001.
Footnote |
| † Electronic Supplementary Information (ESI) available. See DOI: 10.1039/ c1ra00359c |
| This journal is © The Royal Society of Chemistry 2011 |