Graphene–V2O5·nH2O xerogel composite cathodes for lithium ion batteries†
Guodong
Du
a,
Kuok Hau
Seng
a,
Zaiping
Guo
*ab,
Jun
Liu
*c,
Wenxian
Li
a,
Dianzeng
Jia
*d,
Chris
Cook
b,
Zongwen
Liu
e and
Huakun
Liu
a
aInstitute for Superconducting & Electronic Materials, University of Wollongong, Wollongong, NSW 2522, Australia. E-mail: zguo@uow.edu.au; Fax: +61 2 4221 5731; Tel: +61 2 4221 5225
bFaculty of Engineering, University of Wollongong, Wollongong, NSW 2522, Australia
cDepartment of Materials Science and Engineering, Central South University, Hunan, 410083, P.R. China. E-mail: liujun4982004@yahoo.com.cn
dInstitute of Applied Chemistry, Xinjiang University, Urumqi, 830046, P.R. China. E-mail: jdz@xju.edu.cn
eAustralian Centre for Microscopy and Microanalysis, The University of Sydney, Sydney, NSW 2006, Australia
First published on 25th August 2011
Abstract
A layer structured V2O5·nH2O xerogel was synthesized via a simple green hydrothermal technique by dissolving commercial V2O5 powder in de-ionized water and hydrogen peroxide. Graphene–V2O5·nH2O xerogel composites were then prepared by mixing and filtration of as-prepared V2O5·nH2O xerogel and graphene in the desired ratio. The method is a cost effective and energy saving way to prepare nanostructured composites. Structure and morphology were investigated by X-ray diffraction, thermogravimetric analysis, field emission scanning electron microscopy, and transmission electron microscopy. Heat treatment at different temperatures could yield V2O5·nH2O xerogels with different amounts of crystal water, and the presence of graphene in the composites enhanced the thermal stability of V2O5·nH2O, in which the phase transformation moved towards higher temperature compared with the sample without graphene. The pristine V2O5·nH2O xerogel consisted of thin layers of ribbons with widths around 100 nm. In the composites, the V2O5·nH2O ribbons were located on the surface of the graphene sheets. Increasing the graphene content in the composites resulted in better cycling stability when the composites were tested as cathodes in different voltage ranges for lithium ion batteries. The initial and the 50th discharge capacities of the composite cathode with 17.8% graphene are 299 and 174 mAh g−1, respectively, when cycled between 1.5 and 4.0 V. The capacities decreased to 227 and 156 mAh g−1, respectively, when cycled between 2.0 and 4.0 V. The initial and the 50th discharge capacities of the composite with 39.6% graphene are 212 and 190 mAh g−1 in the voltage range of 1.5–4.0 V, and the capacities are 143 and 163 mAh g−1 when cycled between 2.0 and 4.0 V, respectively. The outstanding electrochemical performance could be attributed to the graphene induced unique structure and morphology.
Introduction
Energy is one of the most urgent problems that human society has had to face since we entered the 21st century. The shortage of fossil fuels and the increasing price of petroleum require the usage of clean renewable energy at a much higher level than that presently in force. Moreover, not only does the burning of fossil fuels cause environmental problems, such as pollution and global warming, but the dependence on foreign oil also creates national vulnerabilities and endangers social stability.1 Although the safety and radioactivity of nuclear power has triggered mounting fears worldwide recently, nuclear is a clean and efficient energy source, along with the renewables, solar, wind, wave energy, etc. However, such renewable energy sources require storage systems, and the most versatile way to store energy is as chemical energy. The lithium ion battery, as one of the most promising chemical energy storage devices, serves as the energy source for many electronic devices and has gained great success as a portable power source in the past two decades. It is also going to be used in electric vehicles (EV) and hybrid electric vehicles (HEV), which will help to alleviate environmental pollution.2–4As one of the cathode candidates for lithium ion batteries, the layer/quasi-layer structured vanadium oxides have been investigated for a long time as a host for Li+ intercalation.5–18 Among all the vanadium oxides phases, the amorphous, hydrated form of vanadium pentoxide (V2O5·nH2O) has a higher intercalation capacity than the crystalline form. The insertion of 2Li/V2O5 corresponds to a stoichiometric energy density of 730 Wh kg−1.19 It was reported that V2O5 xerogels can react with 4 Li per mole of V2O5, and insertion of up to 5.8 Li was reported for aerogels, corresponding to capacities of 560 and 650 mAh g−1, which are much higher than those of LiFePO4 and LiMn2O4 cathodes.20,21 V2O5·nH2O xerogels can be also easily deposited as thin films to prepare miniature cell electrodes.22,23 However, the reactivity of xerogel varies with synthesis conditions, and the electrochemical performance of V2O5 is limited by its moderate electrical conductivity and low Li+ diffusion coefficient, while the cyclability of V2O5 is limited by vanadium dissolution.19 Therefore, carbon has been introduced as a composite component to enhance the electrochemical performance,24–28i.e., the carbon increases electrical conductivity and prevents the vanadium dissolution, while the nanostructure shortens the Li+ diffusion length.
Recently, graphene has attracted a great deal of research attention in a wide range of applications. It was also widely investigated as an anode for lithium batteries or as an important component in composites for electrode materials.29–33 It could be an ideal carbon source to prepare V2O5 composites. Moreover, the V2O5·nH2O xerogel ribbons always show two-dimensional (2D) thin layer morphology similar to that of graphene, and therefore, by combining V2O5·nH2O and graphene, a unique composite is expected from the stacking of the two components. To the best of our knowledge, there has not been any previous publication on this unique composite material. In this work, composites with different ratios of V2O5·nH2O and graphene were prepared. The composites were tested as cathode materials for lithium ion batteries. The amount of graphene in the composites played an important role in their structure, morphology, and the electrochemical properties.
Experimental
Material preparation
The V2O5·nH2O gel was prepared by the hydrothermal method, similar to the procedure reported by T. Zhai et al.,34 but a lower temperature was used in our experiments. In a typical synthesis, 0.364 g of V2O5 powder was added to 30 mL de-ionised water and mixed under vigorous magnetic stirring, and then 5 mL 30% H2O2 was added to the solution, which was left to stir for another 30 min. Finally, 12 mL of the transparent orange solution was transferred to a Teflon-lined autoclave and kept at 190 °C for 2 days.Graphene oxide was prepared using a modified Hummers' method as described elsewhere.35 The powders were dispersed in de-ionised water to form a 1 mg mL−1 solution by probe sonication. A weighted amount of NaBH4 (9.46 g) was added to 500 mL of the graphene oxide solution and was left to stir at room temperature for 24 h. The color of the solution changed from dark brown to black. The reduced solution was then centrifuged and washed several times with de-ionised water, and re-dispersed in 500 mL de-ionised water to form a 0.77 mg mL−1 reduced graphene suspension.
The graphene–V2O5·nH2O composites were prepared by mixing the hydrothermally treated V2O5·nH2O solution and the graphene suspension in the desired ratio by a short stirring and filtration using an anodic aluminum oxide membrane with 0.2 μm pore size (Whatman). The samples were then dried at different temperatures.
Material characterization
The structure and morphology of the as-prepared samples were characterized by X-ray diffraction (XRD; MMA GBC, Cu Kα radiation), field emission scanning electron microscopy (FESEM; JEOL-7500, 2 keV), transmission electron microscopy (TEM; JEOL-2010, 200 keV), thermogravimetric analysis (TGA;TA 2000 Thermoanalyzer), and Raman spectroscopy (Jobin Yvon HR800).The electrochemical tests were carried out viaCR2032 coin type cells. The working electrodes were prepared by mixing the as-prepared graphene–V2O5 composites, carbon black (Super P, MMM, Belgium), and poly(vinyl difluoride) (PVDF) at a weight ratio of 8![[thin space (1/6-em)]](https://www.rsc.org/images/entities/char_2009.gif) :1:1 except for the bare V2O5·nH2O sample where there was a ratio of 7:2:1. The resultant slurry was pasted on Al foil and dried in a vacuum oven at 80 °C for 8 h. Coin cells were assembled in an argon-filled glove box (Mbraun, Unilab, Germany) by stacking a porous polypropylene separator containing liquid electrolyte between the composite electrode and a lithium foil counter electrode. The electrolyte consisted of a solution of 1 M LiPF6 in ethylene carbonate (EC)/dimethyl carbonate (DMC) (1:1, by volume). Cyclic voltammograms were collected on a VMP-3 electrochemical workstation at a scan rate of 0.1 mV s−1. The discharge and charge measurements were conducted on a Land CT2001A battery tester.
:1:1 except for the bare V2O5·nH2O sample where there was a ratio of 7:2:1. The resultant slurry was pasted on Al foil and dried in a vacuum oven at 80 °C for 8 h. Coin cells were assembled in an argon-filled glove box (Mbraun, Unilab, Germany) by stacking a porous polypropylene separator containing liquid electrolyte between the composite electrode and a lithium foil counter electrode. The electrolyte consisted of a solution of 1 M LiPF6 in ethylene carbonate (EC)/dimethyl carbonate (DMC) (1:1, by volume). Cyclic voltammograms were collected on a VMP-3 electrochemical workstation at a scan rate of 0.1 mV s−1. The discharge and charge measurements were conducted on a Land CT2001A battery tester.
Results and discussion
Three composites with nominal graphene weights of 10% (composite 1), 20% (composite 2), and 30% (composite 3) were prepared. The samples were dried at 50 °C under vacuum and the X-ray diffraction patterns are displayed in Fig. 1. The XRD pattern of the as-prepared V2O5·nH2O xerogel only shows a set of 00l reflection peaks, which are consistent with layer structured hydrated V2O5 (JCPDS No. 40-1296), revealing that the vanadium oxide is oriented in the ab-plane when filtered to form a paper-like membrane. The three graphene–V2O5·nH2O composites show almost the same patterns, however, lower V2O5 peak intensities can be observed when the amount of graphene increases in the composites. The (001) reflection of the graphene–V2O5·nH2O composites shifts to a higher 2θ value comparing to that of bare V2O5·nH2O xerogel, indicating a smaller interlayer d spacing of the V2O5 layers in the composites, as is listed in Table 1. | ||
| Fig. 1 X-ray diffraction patterns of (a) as-prepared V2O5·nH2O xerogel and (b) graphene–V2O5·nH2O composites dried at 50 °C under vacuum. | ||
| d = nλ/2sinθ | Samples dried at 50 °C | Samples dried at 200 °C | ||
|---|---|---|---|---|
| 2θ | d (Å) | 2θ | d (Å) | |
| Composite 1 | 8.25 | 10.736 | 8.25 | 10.736 |
| Composite 2 | 8.3 | 10.672 | 8.35 | 10.608 |
| Composite 3 | 8.35 | 10.608 | 10.05 | 8.828 |
| V2O5·nH2O | 6.2 | 14.265 | 6.85 | 12.917 |
Fig. 2 shows the thermogravimetric analysis (TGA) curves for the V2O5·nH2O xerogel and the graphene–V2O5·nH2O composites. The weight change profile of V2O5·nH2O xerogel is characterized by a steep loss before 80 °C, followed by a gradual weight loss until 210 °C, corresponding to the loss of weakly bound water, producing a xerogel with the composition of V2O5·0.7H2O. After that, a steep weight loss can be observed on further heating to 280 °C, producing V2O5·0.1H2O by removing more bound water. Heating to above 350 °C removes the tightly bound chemical water and induces conversion to orthorhombic vanadium pentoxide. Although the TGA curve of our V2O5·nH2O xerogel shows similarities to previously reported V2O5·nH2O xerogels,36,37 which were prepared via different procedures, the profile for the loss of the weakly and chemically bound water from V2O5·nH2O is slightly different. For the graphene–V2O5·nH2O composites, the profiles only exhibit gradual weight loss before 350 or 400 °C, followed by a steep loss up to 500 or 550 °C, which is due to the graphene burn-off in the composites.
 | ||
| Fig. 2 TGA curves: (a) bare V2O5·nH2O and (b) graphene–V2O5·nH2O composites. | ||
For lithium ion battery tests, the samples may suffer poor electrochemical performance due to the crystal water in V2O5·nH2O, and therefore higher temperature heat treatments were applied to further remove the crystal water according to the TGA profiles. All the samples were dried at 200 °C under ambient atmosphere for 20 h. The XRD patterns of the samples dried at 200 °C are shown in Fig. 3. The 200 °C treated V2O5·nH2O xerogel shows all the layered hydrated V2O5 00l reflections, revealing that the layer structure is still maintained. However, two additional peaks appear at approximately 21° and 43°, corresponding to the (001) and (002) reflections of orthorhombic crystalline V2O5 (JCPDS No. 41-1426), indicating phase transformation due to crystal water loss. The XRD patterns of the graphene–V2O5·nH2O composites show only layered hydrated V2O5 00l reflections, except for composite 3, which shows a broad peak between 20° to 30°, corresponding to graphene (which may be due to the higher amount of graphene in composite 3 compared to the other two composites). The absence of the orthorhombic V2O5 peaks suggests that phase transformation does not occur at this temperature in composite samples, revealing the enhancement of thermal stability for layer structured V2O5·nH2O when it is affixed to graphene sheets.
 | ||
| Fig. 3 X-ray diffraction patterns of samples dried at 200 °C: (a) V2O5·nH2O xerogel and (b) graphene–V2O5·nH2O composites. | ||
Compared to the XRD patterns of samples dried at 50 °C, the peak positions of the composites obviously shift to higher angles with an increasing graphene ratio. The structure of V2O5·nH2O xerogel was investigated via the atomic pair distribution function technique,38 proving that it is a stack of slabs which are bilayers of single V2O5 layers. These consist of square pyramidal VO2 units and water molecules are located in the space between the slabs, so the interlayer spacing is relevant to the amount of crystal water. The interlayer spacing, d, of the samples was calculated from the angle of the (001) reflection peak in the XRD patterns and listed in Table 1. The smallest interlayer spacing for composite 3 reveals the least amount of crystal water, and the much broadened peaks indicate much smaller crystallinity from the Scherrer equation calculation. Note that the XRD pattern for the composite 2, when dried at 300 °C for 2 h, shows almost the same pattern as when dried at 200 °C, except that the peak intensities increase, which means that the crystals are larger (ESI Fig. S1†).
FESEM images of the as-prepared graphene, the V2O5·nH2O xerogel, and the three composites dried at 50 °C are shown in Fig. 4. The as-prepared graphene sheets form a flower-like morphology and are crumpled to a curly and wavy shape. The V2O5·nH2O xerogel sample shows a smooth surface when filtered to form a paper-like film, while the three composites also show similar morphology to the graphene sheets. The high resolution image of composite 1 in Fig. 4(d) clearly exhibits V2O5·nH2O ribbons with widths of about 100 nm located on the surface of the graphene. The FESEM images of the composites dried at 200 °C were also investigated and show a similar morphology, but the V2O5·nH2O xerogel image shows small cracks because of the crystal water loss (ESI Fig. S2†).
 | ||
| Fig. 4 FESEM images of samples dried at 50 °C under vacuum: (a) graphene, (b) V2O5·nH2O xerogel, (c) composite 1, (d) high resolution image of composite 1, (e) composite 2 and (f) composite 3. | ||
TEM images of the as-prepared V2O5·nH2O are shown in Fig. 5(a) and (b). The lower magnification image indicates that the V2O5·nH2O sample exhibits graphene-like thin layer ribbon morphology, with a width of about 100 nm. In the high resolution image, poorly developed fringes can be observed in some areas, indicating that the structural state varies between good crystallinity and completely amorphous. The TEM images together with the XRD patterns explain well the long-range ordered and local structurally disordered nature of V2O5·nH2O. An image of composite 2 dried at 50 °C is shown in Fig. 5(c). It can be clearly seen that the V2O5·nH2O ribbons are located on the surface of the graphene sheets. The energy dispersive X-ray spectroscopy (EDS) spectrum confirms the presence of carbon and vanadium. The Raman spectra for the carbon D and G bands of the pure graphene, composite 2 treated at 50 °C, and the three composites heat-treated at 200 °C are shown in Fig. 6. All of the samples show the same D band position at about 1340 cm−1 and the G band at about 1607 cm−1, while the intensity ratio Id/Ig shows a similar value of about 1.26.
 | ||
| Fig. 5 Typical TEM images of the as-prepared V2O5·nH2O (a, b), and a graphene–V2O5·nH2O composite (c); the inset to (c) shows the corresponding EDS spectrum. | ||
 | ||
| Fig. 6 Raman spectra of the pure graphene, composite 2 dried at 50 °C, and the three composites dried at 200 °C. | ||
Fig. 7 compares the cyclic voltammograms of the V2O5·nH2O xerogel sample and the three graphene–V2O5·nH2O composites, which were dried at 200 °C and cycled between 1.5 and 4 V vs.Li+/Li at a scan rate of 0.1 mV s−1. The V2O5·nH2O xerogel sample shows no obvious reaction peaks in the cyclic voltammogram, especially after the first discharge. Composite 1 shows similar curves to the bare V2O5·nH2O sample. This is probably due to the large amount of crystal water in the sample, which could cause the decomposition of LiPF6 in the electrolyte. In addition, the lithium may also react with the interlayer water to form Li2O,39 which could prevent reversible extraction and block the intercalation pathway. The redox peaks of composite 2 are located at about 3.76, 2.79, and 2.41 V for the cathodic process and at about 2.8, 3.17, and 2.82 V for the anodic process. The voltage difference between the redox peaks of composite 2 increases with cycling, indicating that the polarization increases with cycling. Meanwhile, the peak intensity decreases with cycling. As for composite 3, the cathodic peaks at about 3.72, 2.72, and 2.38 V and the anodic peaks at about 2.82, 3.2, and 3.85 V are slightly different from those of composite 2, and the reversibility is much better. The lower potential difference between anodic and cathodic peaks and the higher cyclability is due to the higher amount of graphene in the composite, which significantly improves the conductivity of the electrodes. Noticeably, the peak intensity increases for the first 5 cycles, revealing that there is an activation process for lithium intercalation/de-intercalation.
 | ||
| Fig. 7 Cyclic voltammograms of (a) V2O5·nH2O xerogel, (b) composite 1, (c) composite 2, and (d) composite 3 at a scan rate of 0.1 mV s−1. | ||
In order to fully understand the electrochemical behavior of the graphene–V2O5·nH2O composite cathodes, the electrodes were charged/discharged in different voltage windows. Typical galvanostatic charge–discharge curves of the composite electrodes in different voltage ranges are displayed in Fig. 8(a). The voltage decreases gradually with capacity, and there is a slope located at around 2.5 V in the discharge process, corresponding to the peak at about 2.41 V in Fig. 7(c). This discharge profile is different from the galvanostatic charge–discharge curves of strongly crystalline V2O5, in which moderate flat plateaus are always exhibited. Comparing the galvanostatic curves for the 1st cycle (Fig. 8(a)) and the 10th cycle (ESI Fig. S3†), no irreversible phase change can be observed when cycling down to 1.5 V vs.Li+/Li in such V2O5·nH2O xerogel samples. All the discharge curves show a similar profile, and the capacity is higher when the electrode is discharged to lower voltage, with a capacity of 141 mAh g−1, 227 mAh g−1, and 299 mAh g−1 in the voltage ranges of 2.5–4 V, 2–4 V, and 1.5–4 V, respectively. Fig. 8(b) compares the cycling performance of composite 2 in different voltage ranges. In the wide voltage range of 1.5–4 V, the discharge capacity drops significantly for the first 20 cycles and then remains stable, with a capacity of about 180 mAh g−1 up to 50 cycles. When cycled between 2–4 V, the discharge capacity shows a moderate decrease, with a capacity of 156 mAh g−1 for the 50th cycle. On further narrowing of the voltage range to 2.5–4 V, the composite cathode shows the best capacity retention, with a capacity of 122 mAh g−1 for the 50th cycle, which is 86% of the capacity of the first cycle. Fig. 8(c) and (d) compares the cyclability of the V2O5·nH2O xerogel and the three composites up to 50 cycles in the voltage range of 1.5–4 V and 2–4 V, respectively, at a current density of 30 mA g−1, based on the weight of the whole sample. The V2O5·nH2O xerogel sample shows almost no capacity, and composite 1 shows very low reversible capacity. However, composite 1 shows a high discharge capacity of 178 mAh g−1 and 156 mAh g−1 for the first cycle in both voltage ranges, respectively. The cycling performances are consistent with the cyclic voltammogram curves in Fig. 7(a) and (b). It is believed that these results are related to the higher amount of crystal water in both samples. Composites 2 and 3, in the wide reversible composition range for lithium intercalation, exhibit the ability to sustain repeated deep cycling, especially composite 3, which shows high capacity retention even in the voltage range of 1.5–4 V, exhibiting a high discharge capacity of 239 mAh g−1 and maintaining 190 mAh g−1 for the 50th cycle. When composite 3 is cycled in both voltage ranges, there is an activation process with a slight increase in the discharge capacity for the first few cycles. In the voltage range of 2–4 V, it delivers a very stable cycling performance with discharge capacity of about 160 mAh g−1 for all cycles. Note that graphene is not electrochemically active in such high voltage ranges and that the capacities were calculated based only on the weight of V2O5 in the electrodes. (From the TGA analysis results, the content of graphene in the three composites dried at 200 °C is 7.2 wt%, 17.8 wt% and 39.6 wt%, respectively.) The lower initial capacities for composite 3 may be due to the smaller interlayer spacing, so that the host material showed a lower acceptance level of Li+, which induced lower discharge capacity.
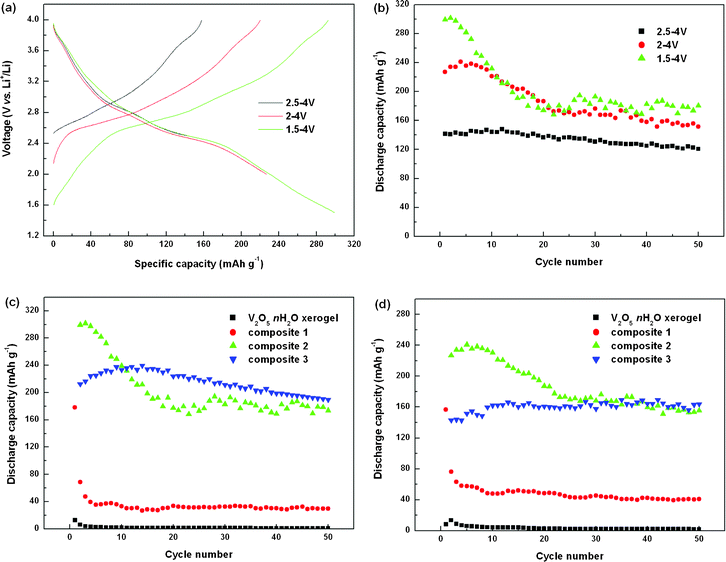 | ||
| Fig. 8 Electrochemical performance: (a) galvanostatic curves of composite 2 for the first cycle in different voltage ranges, (b) cycling performance of composite 2 when cycled in different voltage ranges, (c) cycling performance of samples in the voltage range of 1.5–4 V and (d) cycling performance of samples in the voltage range of 2–4 V. | ||
The improved electrochemical performance of the graphene–V2O5·nH2O composites could be attributed to the presence of graphene, the effects of which may have arisen from the following three aspects. (1) Structure stability. Most investigations have reported the electrochemical behavior of V2O5·nH2O xerogel in contact with LiClO4–propylene electrolyte, but the residual water might still limit the rechargeability.19LiPF6 has poorer hydrolytic stability compared to LiClO4, so the normal commercial electrolyte with LiPF6 as solute might also be one of the reasons for the poor cyclability when the crystal water level is high. The V2O5·nH2O in composites could keep the layered structure with a smaller amount of crystal water, thus reducing the side effects. The thermal stability was also enhanced, which was attributed to the presence of graphene. (2) Conductivity. The presence of graphene sheets could enhance the conductivity, resulting in smaller polarization, which was clearly indicated in the cyclic voltammograms. (3) Buffering of strain. In the wide voltage range for Li+ intercalation, V2O5·nH2O shows one phase reaction where Li+ enters the interlayer. When the guest species intercalate into or are extracted from the xerogel, this distance expands or contracts correspondingly,6 so the active material suffers mechanical strain after intercalation of guest ions. In the composites, thin layers of V2O5·nH2O were affixed to the graphene sheets, and the graphene sheets could effectively buffer the strain from the volume changes during guest ion intercalation/de-intercalation.
Conclusions
In summary, graphene–V2O5·nH2O composites with different amounts of graphene were prepared by mixing and filtration of hydrothermally treated V2O5·nH2O xerogel and graphene. The graphene content in the composites played an important role in structure, morphology, and electrochemical performance. The composite with 39.6% graphene exhibited outstanding performance for lithium ion batteries, providing a high discharge capacity and stable cycling stability up to 50 cycles. Moreover, the easy formation of thin film or paper makes the composites described in this paper attractive for potential application in miniature cells or flexible devices.Acknowledgements
Financial support provided by the Australian Research Council (ARC) through a Linkage Project (LP0991012) is gratefully acknowledged. The authors would also like to thank Dr Tania Silver at the University of Wollongong for the critical reading of the manuscript.References
- J. B. Goodenough and Y. Kim, Chem. Mater., 2010, 22, 587 CrossRef CAS.
- B. Kang and G. Ceder, Nature, 2009, 458, 190 CrossRef CAS.
- H. K. Song, K. T. Lee, M. G. Kim, L. F. Nazar and J. Cho, Adv. Funct. Mater., 2010, 20, 3818 CrossRef CAS.
- F. Y. Cheng, J. Liang, Z. L. Tao and J. Chen, Adv. Mater., 2011, 23, 1695 CrossRef CAS.
- M. S. Whittingham, Chem. Rev., 2004, 104, 4271 CrossRef CAS.
- Y. Wang and G. Z. Cao, Chem. Mater., 2006, 18, 2787 CrossRef CAS.
- Y. Wang and G. Z. Cao, Adv. Mater., 2008, 20, 2251 CrossRef CAS.
- N. A. Chernova, M. Poppolo, A. C. Dillon and M. S. Whittingham, J. Mater. Chem., 2009, 19, 2526 RSC.
- A. L. Tipton, S. Passerini, B. B. Owens and W. H. Smyrl, J. Electrochem. Soc., 1996, 143, 3473 CrossRef CAS.
- A. M. Cao, J. S. Hu, H. P. Liang and L. J. Wan, Angew. Chem., Int. Ed., 2005, 44, 4391 CrossRef CAS.
- S. L. Chou, J. Z. Wang, J. Z. Sun, D. Wexler, M. Forsyth, H. K. Liu, D. R. MacFarlane and S. X. Dou, Chem. Mater., 2008, 20, 7044 CrossRef CAS.
- Y. S. Hu, X. Liu, J. O. Muller, R. Schlogl, J. Maier and D. S. Su, Angew. Chem., Int. Ed., 2009, 48, 210 CrossRef CAS.
- C. Z. Wu and Y. Xie, Energy Environ. Sci., 2010, 3, 1191 CAS.
- A. Q. Pan, J. G. Zhang, Z. M. Nie, G. Z. Cao, B. W. Arey, G. S. Li, S. Q. Liang and J. Liu, J. Mater. Chem., 2010, 20, 9193 RSC.
- L. Q. Mai, L. Xu, C. H. Han, X. Xu, Y. Z. Luo, S. Y. Zhao and Y. L. Zhao, Nano Lett., 2010, 10, 4750 CrossRef CAS.
- D. M. Yu, C. G. Chen, S. H. Xie, Y. Y. Liu, K. Park, X. Y. Zhou, Q. F. Zhang, J. Y. Li and G. Z. Cao, Energy Environ. Sci., 2011, 4, 858 CAS.
- H. Gwon, H. S. Kim, K. U. Lee, D. H. Seo, Y. C. Park, Y. S. Lee, B. T. Ahn and K. Kang, Energy Environ. Sci., 2011, 4, 1277 CAS.
- K. H. Seng, J. Liu, Z. P. Guo, Z. X. Chen, D. Z. Jia and H. K. Liu, Electrochem. Commun., 2011, 13, 383 CrossRef CAS.
- K. West, B. Zachau-Christiansen, T. Jacobsen and S. Skaarup, Electrochim. Acta, 1993, 38, 1215 CrossRef CAS.
- D. B. Le, S. Passerini, J. Guo, J. Ressler, B. B. Owens and W. H. Smyrl, J. Electrochem. Soc., 1996, 143, 2099 CrossRef CAS.
- S. Passerini, D. B. Le, W. H. Smyrl, M. Berrettoni, R. Tossici, R. Marassi and M. Giorgetti, Solid State Ionics, 1997, 104, 195 CrossRef CAS.
- J. Livage, Chem. Mater., 1991, 3, 578 CrossRef CAS.
- C. Devan and D. Teeters, J. Power Sources, 2003, 119–121, 310 Search PubMed.
- J. S. Sakamoto and B. Dunn, J. Electrochem. Soc., 2002, 149, A26 CrossRef CAS.
- S. Suzuki, M. Hibino and M. Miyayama, J. Power Sources, 2003, 124, 513 CrossRef CAS.
- H. Yamada, K. Tagawa, M. Komatsu, I. Moriguchi and T. Kudo, J. Phys. Chem. C, 2007, 111, 8397 CAS.
- M. Koltypin, W. Pol, A. Gedanken and D. Aurbach, J. Electrochem. Soc., 2007, 154, A605 CrossRef CAS.
- A. Q. Pan, D. W. Liu, X. Y. Zhou, B. B. Carcia, S. Q. Liang, J. Liu and G. Z. Cao, J. Power Sources, 2010, 195, 3893 CrossRef CAS.
- G. X. Wang, X. P. Shen, J. Yao and J. Park, Carbon, 2009, 47, 2049 CrossRef CAS.
- S. M. Paek, E. Yoo and I. Honma, Nano Lett., 2009, 9, 72 CrossRef CAS.
- D. H. Wang, D. W. Choi, J. Li, Z. G. Yang, Z. M. Nie, R. Kou, D. H. Hu, C. M. Wang, L. V. Saraf, J. G. Zhang, I. A. Aksay and J. Liu, ACS Nano, 2009, 3, 907 CrossRef CAS.
- S. B. Yang, X. L. Feng, S. Ivanovici and K. Mullen, Angew. Chem., Int. Ed., 2010, 49, 8408 CrossRef CAS.
- X. F. Zhou, F. Wang, Y. M. Zhu and Z. P. Liu, J. Mater. Chem., 2011, 21, 3353 RSC.
- T. Zhai, H. Liu, H. Li, X. Fang, M. Liao, L. Li, H. Zhou, Y. Koide, Y. Bando and D. Golberg, Adv. Mater., 2010, 22, 2547 CrossRef CAS.
- K. H. Seng, Z. P. Guo, Z. X. Chen and H. K. Liu, Adv. Sci. Lett., 2011, 4, 18 CrossRef CAS.
- G. P. Holland, F. Huguenin, R. M. Torresi and D. A. Buttry, J. Electrochem. Soc., 2003, 150, A721 CrossRef CAS.
- Y. Wang, H. Shang, T. Chou and G. Z. Cao, J. Phys. Chem. B, 2005, 109, 11361 CrossRef CAS.
- V. Petkov, P. N. Trikalitis, E. S. Bozin, S. J. L. Billinge, T. Vogt and M. G. Kanatzidis, J. Am. Chem. Soc., 2002, 124, 10157 CrossRef CAS.
- E. C. Almeida, M. Abbate and J. M. Rosolen, Solid State Ionics, 2001, 140, 241 CrossRef CAS.
Footnote |
| † Electronic supplementary information (ESI) available: XRD, FESEM images and galvanostatic charge/discharge curves. See DOI: 10.1039/c1ra00258a |
| This journal is © The Royal Society of Chemistry 2011 |