Combining SERRS and electrochemistry to characterize sensors based on biomembrane mimetic models formed by phospholipids
Priscila
Alessio
ab,
Pedro H. B.
Aoki
a,
J. A.
De Saja Saez
c,
M. L.
Rodríguez-Méndez
b and
Carlos J. L.
Constantino
*ac
aFaculdade de Ciências e Tecnologia, UNESP Univ Estadual Paulista, Presidente Prudente, SP, 19060-900, Brazil. E-mail: case@fct.unesp.br
bE. T. S. Ingenieros Industriales, University of Valladolid, 47011, Valladolid, Spain
cFaculty of Science, University of Valladolid, 47011, Valladolid, Spain
First published on 29th July 2011
Abstract
The surface-enhanced resonance Raman scattering (SERRS) technique and an electronic tongue system based on cyclic voltammetry were coupled combining structural information and sensitivity. Layer-by-Layer (LbL) films containing the phospholipids cardiolipin (CLP) and dipalmitoyl phosphatidyl glycerol (DPPG) were deposited onto ITO to obtain functional electrodes forming an array of sensing units. The phospholipids were applied here as biological membrane mimetic systems, taking advantage of their affinity with pharmaceutical drugs. The electronic tongue was used in the detection of methylene blue (MB) at micromolar concentrations. SERRS spectra were also collected directly from the sensing units (in situSERRS), which was possible due to the adsorption of Ag nanoparticles (AgNPs) within the phospholipid LbL films. This approach also induced an enhancement of the voltammetric signal of the sensing units, especially in the case of CLP. Complementary, the LbL films were morphologically characterized using micro-Raman and scanning electron microscopy-field emission gun (SEM-FEG).
Introduction
Methylene blue (MB) is a synthetic organic dye widely applied in chemical and biological systems, with a great therapeutic importance in pharmacology. For instance, it is used as photosensitizer in photodynamic antimicrobial chemotherapy, exhibiting physicochemical features associated with both self-aggregation and biomembrane modification upon binding.1–4 Historically, MB was the first synthetic compound used therapeutically as antiseptic. In the specific case of Malaria disease, it has been used in treatments for the last 100 years. However, the mechanism of the antimalarial activity of MB is not fully understood yet. It has the highest activity and selectivity compared to other thiazine dyes used against different isolate species of P. falciparum (the protozoan parasite that causes malaria).2 In addition, the combination of chloroquine, which is a drug used in the treatment or prevention of malaria, and MB against malaria presented a synergistic effect and might become an effective and inexpensive drug for the treatment of chloroquine-resistant malaria.2 More recent studies have shown that MB seems to delay the progression of Alzheimer’s disease as well.3MB is a cationic and heterocyclic aromatic molecule that belongs to the phenothiazinic compounds. It is a non-metallic molecule with redox activity and high affinity for nucleic acids. It shows blue color in the oxidized state and it is colorless in the reduced state, called leuco methylene blue (LMB). These two forms of the dye coexist as a redox pair in equilibrium.3 Taking advantage of the great affinity with biological systems, MB has been used as mediator/indicator in biosensors and genosensors. For instance, in electrochemical sensors, it is an interesting molecule because it binds strongly to DNA,5,6 changing its electrochemical response. This approach has been used in different works.7–11 However, despite all the benefits previously described, it is also reported that MB can act as an inhibitor of monoamine oxidase, which can cause serotonin toxicity following its administration, affecting the central nervous system.12 For instance, it was determined that an intravenous dose of only 0.75 mg/Kg of MB produces a peak plasma concentration of 500 ng/mL (1.6 μM), which shows that the concentration in the central nervous system reaches a level that inhibits monoamine oxidase. Therefore, not only the effects of MB on human beings but also the MB detection itself are necessary.
Several works have reported the application of metallic nanoparticles regarding their biocompatibility and toxicity.13,14 Besides, the use of metallic nanoparticles in characterization and analytical methods such as surface plasmon resonance (SPR), Raman and light scattering is well known.15–20 However, the use of metallic nanoparticles to enhance the electrochemical signal, consequently improving sensitivity and detection limits, was reported recently.21–23 Vargo et al.24 mentioned several advantageous characteristics of the metallic nanoparticles as targets to interact with biomolecules, mainly redox proteins. Basically, the main points are related to large surface-to-volume ratios, which lead to higher number of biological adsorbates; the preservation of the biomolecule structure and electroactivity of redox species upon adsorption onto the metallic nanoparticles; the electron transfer reactions might be improved and/or altered affecting the electrochemistry; as well as quite an easy manipulation. Nanoparticles used as labels have also played a role in the development of amplified electrochemical signal for proteins and nucleic acids. The strategy of incorporating metallic nanoparticles for signal amplification in DNA biosensors was reported by Ting et al.25 In their work, it was synthesized doxorubicin-conjugated Ag nanoparticles as labels in the electrochemical detection of DNA using the thiolated DNA probe modified Au electrode. The ultrasensitive DNA biosensor operated in a simple and effective way, achieving a detection limit of 1 pM.
It is known that the MB in the presence of Ag nanoparticles presents an intense surface-enhanced Raman scattering (SERS) and surface-enhanced resonance Raman scattering (SERRS) signals. Besides, the assignment of the bands and characteristic spectra of specific vibrations in the form of monomers or aggregates are known.1,18 Therefore, exploiting the good interaction of MB with biological molecules, and coupling the nanoparticles to promote SERS and SERRS signals, additional information can be extracted. In the work of Cho et al.26 an aptamer-based SERRS sensor for thrombin detection was reported. Changes in the MB SERRS signal were observed with the incorporation of thrombin in the system. In previous works we have reported the use of SERRS to detect and differentiate MB monomer and aggregates in sensing units based on impedance spectroscopy.19,20,27–29 In Aoki et al.20 specifically, in situ MB SERRS spectra were recorded directly from the sensing units (Pt interdigitated electrodes coated with LbL films) applied in the impedance spectroscopy measurements. Here we have extended this approach to cyclic voltammetry to obtain electrochemical and structural information. Two phospholipids (dipalmitoyl phosphatidyl glycerol (DPPG) and cardiolipin (CLP)) were used, which are structured as vesicles and immobilized onto ITO using the LbL technique, with and without Ag nanoparticles (AgNPs), composing sensing units. This sensing array was applied to MB detection combining cyclic voltammetry and SERRS spectra, which were collected directly from the sensing units after their immersion into the MB aqueous solution (in situSERRS).
Materials and methods
Reagents
The anionic phospholipids DPPG (1,2-dipalmitoyl-sn-3-glycero-(phosphor-rac-(1-glycerol)), purity >99%) and CLP (1,3-di(3-sn-Fosfatidil)-sn-glicerol, purity >99%) were purchased from Avanti Polar Lipids Inc. The molecular weights of DPPG and CLP are 745 and 1422 g/mol, respectively. Phenothiazine methylene blue (MB, MW = 319 g/mol), poly(allylamine hydrochloride) (PAH, MW = 56 × 103 g/mol), sodium citrate (C6H5Na3O7.2H2O, MW = 294.1 g/mol) and silver nitrate (AgNO3, MW = 169.88 g/mol) were acquired from Sigma-Aldrich Co. Ultrapure water (18.2 MΩ.cm and pH 5.6) acquired from a Milli-Q system, model Simplicity, was used to prepare both the LbL films and the MB solutions. Fig. 1a shows the molecular structure of DPPG, CLP, MB and PAH repeating unit and Fig. 1b shows a schematic configuration of the setup applied in the experiments of cyclic voltammetry and in situSERRS. | ||
| Fig. 1 (a) Molecular structures of DPPG, CLP, MB and PAH (mer unit); (b) cartoon of a LbL film architecture (bilayer containing PAH/CLP + AgNPs). The cyclic voltammetry was carried out by immersing 10-bilayer LbL films (sensing units) into MB aqueous solutions and the in situSERRS spectra were collected directly from the sensing units after the cyclic voltammetric experiments. | ||
Solutions and LbL films
The solutions and LbL films were prepared as described in references.19,20,28 In general, the solutions were prepared without any special procedure: the powder was simply added to ultrapure water and the solutions were gently stirred. Ag colloid was obtained by citrate reduction of AgNO3 following the method proposed by Lee and Meisel.16 The LbL films were fabricated by immersing the substrate into the distinct solutions according to the following sequence: PAH solution (3 min) → ultrapure water gently stirred to remove excess of adsorbed PAH (1 min) → CLP or DPPG with or without AgNPs (3 min) → ultrapure water to remove excess of adsorbed CLP or DPPG (1 min). Thus the first bilayer was formed and the multilayered LbL films were grown repeating the “four-step sequence” until reaching 10 bilayers.Characterization techniques
Cyclic voltammetry was conducted using an EG&GPARC263A potentiostat/galvanostat (M270 Software) with a conventional three-electrode cell. The reference electrode was an Ag|AgCl/KCl saturated electrode and the counter electrode was a Pt plate. Initially, LbL films were immersed into 0.1 M KCl aqueous solution and the cyclic voltammograms were recorded with a scan rate at 0.05 V/s in the potential range of −1.0 to 1.3 V. Besides, the LbL films were immersed in MB aqueous solution (pH 5.6) and the cyclic voltammograms were registered from −0.7 to 0.0 V starting at −0.05 V with a scan rate of 0.05 V/s for concentrations at 1.0, 6.0, 20.0, 60.0 and 100.0 μM. Raman analysis and optical microscopy were obtained using a micro-Raman Renishaw spectrograph model in-Via equipped with a Leica microscope, whose 50x objective lens allows collecting spectra with ca.1 μm spatial resolution, CCD detector, laser at 633 nm and 1800 grooves/mm grating with additional notch filter leading to a spectral resolution of ca. 4 cm−1, and a computer-controlled three-axis-encoded (XYZ) motorized stage to take Raman images with a minimum step of 0.1 μm. The Raman spectra (RRS and SERRS for MB) were collected directly from the ITO-modified electrodes (sensing units) applied in the voltammetric experiments before and after immersion in the MB solutions.Results and discussion
LbL film growth and morphology
The growth kinetic of the PAH/DPPG, PAH/DPPG + AgNPs and PAH/CLP, PAH/CLP + AgNPs LbL films was performed using UV-Vis absorption spectroscopy.19,20,28 A linear increase in the absorbance with the number of deposited bilayers was observed. In the case of AgNPs the absorption band with a maximum at 420 nm was monitored, for DPPG the band at 200 nm and for CLP the band at 230 nm. A linear trend means that similar concentrations of materials were adsorbed onto the substrate per bilayer deposited, leading to a controlled growth of the LbL films’ thickness at a nanometer scale. In addition, a direct comparison of the absorbance for both PAH/CLP and PAH/DPPG LbL films reveals that both have a similar amount of adsorbed material.20,28 The same was observed following the band at ca. 420 nm assigned to AgNPs (PAH/DPPG + AgNPs: absorbance of 0.12 for 10 bilayers; PAH/CLP + AgNPs: absorbance of 0.10 for 10 bilayers).20,28,29The morphology of the 10-bilayer PAH/CLP + AgNPs LbL film was also characterized through SEM images20 and the result was similar to that shown here in Fig. 2 for the 10-bilayer PAH/DPPG + AgNPs in terms of AgNPs size, shape and aggregation. It can be seen that the 10-bilayer PAH/DPPG + AgNPs LbL film presents a fairly homogeneous surface with AgNPs (isolated or aggregated) dispersed along the film. Besides, optical microscopy and atomic force microscopy showed, respectively, that CLP forms giant vesicles (micrometer in diameter) in the PAH/CLP LbL film30 while DPPG forms multilamellar vesicles (nanometers in diameter) in the PAH/DPPG LbL films.29
 | ||
| Fig. 2 SEM image for the LbL film containing 10 bilayers of PAH/DPPG + AgNPs. The inset shows isolated AgNPs in detail. | ||
Electrochemical characterization and sensing application
The electrochemical and electrocatalytic properties of the LbL films were studied by cyclic voltammetry towards MB. However, due to the presence of AgNPs within the LbL films, the measurements were initially carried out using 0.1 M KCl aqueous solution (without MB). Fig. 3 shows the voltammograms from −1.0 to 1.3 V and scan rate of 0.05 V/s for bare-ITO and ITO containing 10-bilayer LbL films of PAH/CLP, PAH/CLP + AgNPs, PAH/DPPG and PAH/DPPG + AgNPs. Considering that neither phospholipid present a redox process in this range, the only change caused by the presence of the LbL films is a modification in the limits of oxidation and reduction of water due to the electrocatalytic effect of the film. This result was expected since in our previous work28 this behavior was observed for LbL and Langmuir–Blodgett films composed by PAH and DPPG.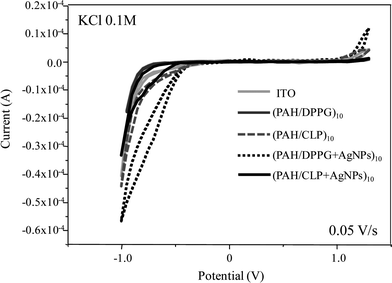 | ||
| Fig. 3 Cyclic voltammetry for 10-bilayer LbL films onto ITO and bare-ITO in KCl aqueous solution (0.1 M) and scan rate at 0.05 V/s. | ||
Considering the investigation of the electrochemical catalytic effect of the LbL films in the presence of MB in aqueous solution, it is worth mentioning that the MB reduction mechanism is given by two successive one-electron transfers (electron-transfer, chemical-reaction, electron-transfer (ECE) mechanism).1 Basically, the MB+ is reduced, generating both the radical cation (HMB˙+) and the leucomethylene blue (LMB), with a rapid proton transfer interposed between them. ITO-modified electrodes were immersed into aqueous solutions of MB at 1.0, 6.0, 20.0, 60.0 and 100.0 μM containing 0.1 M KCl. The cyclic voltammograms were obtained from −0.7 to 0.0 V and at a scan rate of 0.05 V/s. Fig. 4 shows the voltammograms for LbL films deposited onto ITO containing 10 bilayers of PAH/CLP, PAH/CLP + AgNPs, PAH/DPPG and PAH/DPPG + AgNPs for all MB concentrations. A reversible redox pair associated with the quasi reversible oxidation of MB is seen in this potential range. This result, instead of two waves (two redox pairs) as expected from ECE mechanism, is in accordance with the literature.1 The latter reports voltammograms with only one cathodic wave and one anodic wave obtained for different working electrodes, being the reason assigned to the fast electron transfer processes occurring at the interface (aqueous solution/substrate). Besides, as expected, for all LbL films the intensity of both anodic and cathodic peaks increase with the concentration of MB. In general, the DPPG and CLP electrochemical responses for the different MB concentrations are different probably due to different phospholipid structure/packing (CLP: giant vesicles; DPPG: multilamellar vesicles) and/or different interaction with MB due to the presence of double bonds in CLP aliphatic chain. The latter was observed in ref. 29 when comparing LbL films grown from CLP or DPPG aqueous solutions containing MB (PAH/CLP + MB or PAH/DPPG + MB). The E1/2 also increases slightly with the concentration. This effect appears as a consequence of the redox peak displacements to lower potentials. This displacement can be associated with the easier MB reduction and oxidation due to the higher amount of MB molecules. These changes observed when increasing the concentration are due to the adsorption of MB on the phospholipid film that is coating the electrode surface, which produces a positive cooperative effect. In fact, MB adsorption at electrode surfaces by reduction has been reported.1 In our case, the micro-Raman data presented in the next section revealed MB adsorbed at the surfaces of LbL films. Basically, four pieces of information could be extracted using the micro-Raman technique after the sensing experiments: (i) for the LbL films without AgNPs (PAH/CLP and PAH/DPPG), the conventional Raman spectra could be recorded only for regions containing domains of MB (micrometer size – see Fig. 7); (ii) for regions without micrometer domains of MB, the Raman signal from MB was not detectable (see Fig. 7). However, for the LbL films containing AgNPs (PAH/CLP + AgNPs and PAH/DPPG + AgNPs), the SERRS spectra from MB could be detected from regions with and without MB micrometer domains (see Fig. 8); (iii) the latter also revealed that the MB is adsorbed all over the film surface within micrometer spatial resolution. (iv) The MB in the micrometer domains is structurally arranged forming mainly molecular aggregates and in the regions without micrometer domains the MB is mainly in the form of monomers (isolated molecules). The E1/2 values for the PAH/CLP + AgNPs sensor are: 0.117 V (1.0 μM); 0.145 V (6.0 μM); 0.135 V (20.0 μM); 0.169 V (60.0 μM); 0.207 V (100.0 μM). The E1/2 values are slightly higher for the other sensing units than for PAH/CLP + AgNPs. These results suggest that the MB has stronger interactions with CLP, which is in full agreement with the observed by FTIR,30 being even enhanced by the presence of AgNPs.
 | ||
| Fig. 4 Cyclic voltammetry for 10-bilayer LbL films onto ITO at different MB concentrations (from 1 μM up to 100 μM) in KCl aqueous solution (0.1 M) and scan rate at 0.05 V/s. | ||
Several works report the interactions between MB and biological molecules using techniques such as Langmuir films,27cyclic voltammetry and Raman spectroscopy1,18 or the use of MB to detect biological molecules.8,9,22,31 In the specific case of CLP and DPPG interacting with MB, an extensive discussion was reported in ref. 29 for both Langmuir and LbL films. The study, which compares the displacement of the surface pressure vs. molecular area isotherms in Langmuir films containing CLP and MB co-spread or DPPG and MB co-spread, showed that CLP is about 5 times more sensitive. The FTIR study for the LbL films revealed that for both CLP and DPPG the main interaction with MB is established through electrostatic forces between the polar head groups of the anionic phospholipids and the positive site of the MB molecule. However, in the case of CLP, the FTIR data revealed significant spectral changes in the range of the aliphatic chain vibrational modes due to the presence of MB. For instance, bands assigned to symmetric and antisymmetric CH2 stretchings of CLP aliphatic chains were shifted in the presence of MB, besides vanishing or appearance of certain bands also related to the vibrational modes of the CLP aliphatic chains. These significant changes were observed for small amounts of adsorbed MB, indicating relevant interactions between CLP aliphatic chains and MB. The latter was not observed in the case of DPPG. In addition, the interaction of CLP and DPPG with MB was explored in sensing experiments using impedance spectroscopy with both phospholipids exhibiting high sensitivity to detect MB; however with CLP presenting a slightly better performance.20
The anodic current peak recorded for each sensing unit against MB concentration is plotted in Fig. 5. The detection limit was calculated using IUPAC (3σ criteria)32 and the values are given in Table 1. The values around 10−6 and 10−7 M found here for the detection limit towards MB are compatible with the values reported in the available literature using electrochemistry analyses. For instance, Wen et al. reported a detection limit of 7.65 × 10⁻⁷ M33 and 6.79 × 10⁻⁷ M34 using a potentiometric sensor based on methylene blue–silicotungstate ion association embedded in a polyvinyl chloride (PVC) matrix.
 | ||
| Fig. 5 Anodic current peak vs. MB molar concentration for all sensing units. | ||
| Sensing unit (10-bilayer LbL films) | Detection limit (M) |
|---|---|
| PAH/DPPG | 1.31 × 10⁻⁶ |
| PAH/DPPG + AgNPs | 1.17 × 10⁻⁶ |
| PAH/CLP | 1.73 × 10⁻⁶ |
| PAH/CLP + AgNPs | 4.57 × 10⁻⁷ |
A direct comparison of the electrochemical behavior among the LbL films is established in Fig. 6, which shows the cyclic voltammograms for all sensing units at 6.0 and 100.0 μM of MB, 0.1 M KCl and recorded from −0.7 to 0.0 V with scan rate of 0.05 V/s. It is observed that the LbL film with CLP presents a lower MB detection limit than the LbL films with DPPG, which is consistent with the better CLP–MB interaction. Furthermore, the presence of AgNPs provides a synergistic effect leading to an enhancement of the signal for both CLP and DPPG. In the case of CLP + AgNPs, the detection limit of MB is ca. 4 times lower than the other sensing units. Other authors have also reported enhancement effects in voltammetric detections using metallic nanoparticles. For instance, Komathi et al.22 reported a modified electrode based on multi-walled carbon nanotubes, silica and Au nanoparticles (AuNPs). Their results showed an enhancement of 50% in detection of dopamine comparing the same electrode with and without AuNPs. Du et al.31 developed an electrochemical biosensor for the detection of DNA hybridization and found the sensitivity for detection of target DNA to be enhanced 7 times using CdS and AuNPs layers. Besides, Chen et al.35 reported an amplification of about 10 times using AgNPs. However, it is worth mentioning that in the last two cases, the great amplifications are found for electrochemical immunoassay, unlike the electrochemical sensor presented here, which has no enzyme or antibody specificity. Regarding the synergistic effect, in general it is assigned to a better electron transfer provided by the metallic nanoparticles. However, this is a topic of research that requires deeper investigation. In our case, for instance, the amount of AgNPs adsorbed by both CLP and DPPG LbL films is quite similar; however, the enhanced found for CLP is much higher (ca. 4 times). This result shows that the signal amplification effect in voltammetry might depend not only on the presence of metallic nanoparticles but also on the molecular structure (DPPG: one polar head and saturated alquilic chain; CLP: two polar heads and unsaturated alquilic chains) that constitute the sensor and their arrangement (DPPG: nanometric vesicles; CLP: micrometric vesicles) in the film.
 | ||
| Fig. 6 Cyclic voltammetry for all sensing units (10-bilayer LbL films onto ITO) at (a) 6.0 μM and (b) 100.0 μM of MB in KCl aqueous solution (0.1 M) and scan rate at 0.05 V/s. | ||
RRS and SERRS applied to LbL films
The sensing units used in the cyclic voltammetry were investigated using micro-Raman technique, which combines morphological and chemical information at the micrometer scale by coupling an optical microscope to a Raman spectrograph. Fig. 7a shows an optical image of the surface of the 10-bilayer PAH/CLP LbL film onto ITO, which presents some domains at micrometer scale. The Raman spectra given in Fig. 7c were obtained point-by-point for a line of 85 μm with step of 1 μm forming a line mapping, which is shown in Fig. 7b superimposed to the optical image. These Raman spectra revealed that the domains are formed by MB. It is significant in Fig. 7b that the MB spectra are obtained only for the MB domains, i.e., the regions of the LbL film without these MB domains do not present detectable Raman signal. The same result was found for PAH/DPPG LbL films. In ref. 27 similar results were found for MB adsorbed onto sensing units composed by LbL films of phospholipids deposited onto interdigitated electrodes used in impedance measurements, whose morphological changes were found to be related to the great sensitivity presented by that electronic tongue device. | ||
| Fig. 7 (a) Optical image superimposed by a line Raman mapping, which presents the spatial distribution of the intensity of the MB band at 1622 cm−1 for the LbL film onto ITO containing 10 bilayers of PAH/CLP (sensing unit) after cyclic voltammetry in MB; (b) 3D line Raman mapping shown in (a); (c) Raman spectra collected in the mapped line shown in (a). | ||
The possibility of recording the MB Raman spectra shown in Fig. 7c only for MB domains represents a limitation for the data analysis. Therefore, the addition of AgNPs to the LbL films was tested to allow recording MB SERRS spectra from any region of the film, especially those without MB domains. The incorporation of AgNPs in the LbL film matrix allows the incoming laser excites the called localized surface plasmons (LSP) of the AgNPs, which is a necessary condition to achieve the surface-enhanced phenomenon.36 Besides, since the MB absorbs the 633 nm laser line used here,20 the resonance Raman scattering (RRS) takes place. Therefore, combining both SERS and RRS, the Raman spectra collected from MB is called SERRS (surface-enhanced resonance Raman scattering). Fig. 8a presents an optical image for 10-bilayer PAH/CLP + AgNPs LbL film onto ITO (sensing unit) for a region that does not present the micrometer MB domain at the surface of the LbL film. Superimposed to the optical image a 2D area Raman mapping is shown. In the latter the Raman spectra were collected point-by-point for an area of 60 μm × 60 μm with a step of 2 μm. The area mapping was built plotting the intensity of the band at 1625 cm−1 where brighter spots refer to more intense Raman bands. The band at 1625 cm−1 is attributed to a superposition of CC stretching + CH bending in plane (ring) and CN stretching + CC stretching accordingly to theoretical calculation.30 The corresponding area mapping in 3D is given in Fig. 8b. The SERRS spectra of MB were found along all the mapped area at the micrometer scale. The same trend was found for PAH/DPPG + AgNPs LbL films. The variation in the spectra intensities might be related to the spatial distribution of the AgNPs shown by SEM images for CLP20 or in Fig. 2 for DPPG. Fig. 8c shows several MB SERRS spectra collected for the area mapping given in Fig. 8a.
 | ||
| Fig. 8 (a) Optical image superimposed by an area Raman mapping, which presents the spatial distribution of the intensity of the MB band at 1625 cm−1 recorded for the LbL film onto ITO containing 10 bilayers of PAH/CLP + AgNPs (sensing unit) after cyclic voltammetry in MB; (b) 3D area Raman mapping shown in (a); (c) SERRS spectra collected in the mapped area shown in (a). | ||
By comparing the spectra obtained in Fig. 7c and 8c, it can be seen that the patterns of the relative intensities in the region between 400 and 500 cm−1 are different to each other. These changes are related to monomeric and aggregated forms of MB, whose discrimination is mainly based on the relative intensity of the band at ca. 480 cm−1.18 The latter grows for the monomers when compared to the bands at ca. 450 and 500 cm−1. Therefore, the region with domains (optical image) contains mainly MB aggregates while the region without domains is mainly formed by MB monomers.
Conclusions
Cyclic voltammetry and surface-enhanced resonance Raman scattering (SERRS) techniques were successfully applied in the characterization of an electronic tongue composed by layer-by-layer (LbL) films of phospholipids deposited onto ITO-modified electrodes. The combination of both techniques allows obtaining electrochemical and structural information regarding the detection of methylene blue (MB). The dispersion of Ag nanoparticles (AgNPs) within the phospholipid LbL films made possible to achieve the SERRS effect and to enhance the voltammetric signal as well. For instance, in the case of cardiolipin, the enhancement was ca. 4 times with the detection limit reaching 4.57 × 10⁻⁷ M, which is around one order of magnitude lower when compared to cardiolipin LbL film without AgNPs. In the case of SERRS, it was possible to detect MB adsorbed even in homogeneous regions (microscopically) of the LbL films while using conventional Raman scattering, only MB forming micrometer domains at the LbL film surface could be detected. Besides, the homogeneous regions of the LbL films are dominated by MB structured as monomer while the micrometer domains contain mainly aggregated MB. These results open promising perspectives in the application of electronic tongue systems based on biological membrane mimetic systems and cyclic voltammetry not only to detect/quantify MB as a pharmaceutical drug but also to use it as electrochemical indicator in gene sensors.Acknowledgements
FAPESP, CNPq and CAPES (process 118/06) from Brazil, and CICYT AGL2009-12660/ALI and Fundación Carolina from Spain are acknowledged for financial support.References
- S. H. D. Nicolai, P. R. P. Rodrigues, S. M. L. Agostinho and J. C. Rubim, J. Electroanal. Chem., 2002, 527, 103–111 CrossRef CAS.
- J. Rengelshausen, J. Burhenne, M. Frohlich, Y. Tayrouz, S. K. Singh, K. D. Riedel, O. Muller, T. Hoppe-Tichy, W. E. Haefeli, G. Mikus and I. Walter-Sack, Eur. J. Clin. Pharmacol., 2004, 60, 709–715 CrossRef CAS.
- M. Oz, D. E. Lorke and G. A. Petroianu, Biochem. Pharmacol., 2009, 78, 927–932 CrossRef CAS.
- M. Wainwright, H. Mohr and W. H. Walker, J. Photochem. Photobiol., B, 2007, 86, 45–58 CrossRef CAS.
- D. Ozkan, A. Erdem, P. Kara, K. Kerman, J. Justin Gooding, P. E. Nielsen and M. Ozsoz, Electrochem. Commun., 2002, 4, 796–802 CrossRef CAS.
- K. Kerman, D. Ozkan, P. Kara, B. Meric, J. J. Gooding and M. Ozsoz, Anal. Chim. Acta, 2002, 462, 39–47 CrossRef CAS.
- R. Meunier-Prest, A. Bouyon, E. Rampazzi, S. Raveau, P. Andreoletti and M. Cherkaoui-Malki, Biosens. Bioelectron., 2010, 25, 2598–2602 CrossRef CAS.
- H. Nasef, V. Beni and C. K. O'Sullivan, Anal. Bioanal. Chem., 2010, 396, 1423–1432 CrossRef CAS.
- M. K. Patel, P. R. Solanki, A. Kumar, S. Khare, S. Gupta and B. D. Malhotra, Biosens. Bioelectron., 2010, 25, 2586–2591 CrossRef CAS.
- S. Siddiquee, N. A. Yusof, A. B. Salleh, F. A. Bakar and L. Y. Heng, Bioelectrochemistry, 2010, 79, 31–36 CrossRef CAS.
- B. Meric, K. Kerman, D. Ozkan, P. Kara, S. Erensoy, U. S. Akarca, M. Mascini and M. Ozsoz, Talanta, 2002, 56, 837–846 CrossRef CAS.
- P. K. Gillman, Journal of Psychopharmacology, 2010, 25, 429–436 CrossRef.
- M. Auffan, J. Rose, M. R. Wiesner and J.-Y. Bottero, Environ. Pollut., 2009, 157, 1127–1133 CrossRef CAS.
- M. Ahamed, M. S. AlSalhi and M. K. J. Siddiqui, Clin. Chim. Acta, 2010, 411, 1841–1848 CrossRef CAS.
- C. Cao and S. J. Sim, Biosens. Bioelectron., 2007, 22, 1874–1880 CrossRef CAS.
- P. C. Lee and D. Meisel, J. Phys. Chem., 1982, 86, 3391–3395 CrossRef CAS.
- J. Li, M. Xue, H. Wang, L. Cheng, L. Gao, Z. Lu and M. Chan, Analyst, 2003, 128, 917–923 RSC.
- S. H. A. Nicolai and J. C. Rubim, Langmuir, 2003, 19, 4291–4294 CrossRef CAS.
- P. H. B. Aoki, P. Alessio, J. A. De Saja and C. J. L. Constantino, J. Raman Spectrosc., 2010, 41, 40–48 CrossRef CAS.
- P. H. B. Aoki, P. Alessio, A. Riul, J. A. D. Saez and C. J. L. Constantino, Anal. Chem., 2010, 82, 3537–3546 CrossRef CAS.
- Z. P. Chen, Z. F. Peng, Y. Luo, B. Qu, J. H. Jiang, X. B. Zhang, G. L. Shen and R. Q. Yu, Biosens. Bioelectron., 2007, 23, 485–491 CrossRef CAS.
- S. Komathi, A. I. Gopalan and K. P. Lee, Analyst, 2010, 135, 397–404 RSC.
- T. R. Soreta, J. Strutwolf and C. K. O'Sullivan, ChemPhysChem, 2008, 9, 920–927 CrossRef CAS.
- M. L. Vargo, C. P. Gulka, J. K. Gerig, C. M. Manieri, J. D. Dattelbaum, C. B. Marks, N. T. Lawrence, M. L. Trawick and M. C. Leopold, Langmuir, 2010, 26, 560–569 CrossRef CAS.
- B. P. Ting, J. Zhang, Z. Q. Gao and J. Y. Ying, Biosens. Bioelectron., 2009, 25, 282–287 CrossRef CAS.
- H. Cho, B. R. Baker, S. Wachsmann-Hogiu, C. V. Pagba, T. A. Laurence, S. M. Lane, L. P. Lee and J. B. H. Tok, Nano Lett., 2008, 8, 4386–4390 CrossRef CAS.
- P. H. B. Aoki, W. Caetano, D. Volpati, A. Riul and C. J. L. Constantino, J. Nanosci. Nanotechnol., 2008, 8, 4341–4348 CrossRef CAS.
- P. H. B. Aoki, P. Alessio, M. L. Rodriguez-Mendez, J. A. D. Saez and C. J. L. Constantino, Langmuir, 2009, 25, 13062–13070 CrossRef CAS.
- P. H. B. Aoki, D. Volpati, A. Riul, W. Caetano and C. J. L. Constantino, Langmuir, 2009, 25, 2331–2338 CrossRef CAS.
- P. H. B. Aoki, D. Volpati, W. Caetano and C. J. L. Constantino, Vib. Spectrosc., 2010, 54, 93–102 CrossRef CAS.
- P. Du, H. X. Li, Z. H. Mei and S. F. Liu, Bioelectrochemistry, 2009, 75, 37–43 CrossRef CAS.
- C. b. A. D. M. a. A. Wilkinson, IUPAC. Compendium of Chemical Terminology, Blackwell Scientific Publications, Oxford 1997 Search PubMed.
- M. L. Wen, Y. B. Zhao, X. Chen and C. Yi Wang, J. Pharm. Biomed. Anal., 1999, 18, 957–961 CrossRef CAS.
- M. L. Wen, Y. B. Zhao, X. Chen and C. Y. Wang, Indian J. Chem., Sect. A: Inorg., Bio-inorg., Phys., Theor. Anal. Chem., 1999, 38, 812–814 Search PubMed.
- Z.-P. Chen, Z.-F. Peng, Y. Luo, B. Qu, J.-H. Jiang, X.-B. Zhang, G.-L. Shen and R.-Q. Yu, Biosens. Bioelectron., 2007, 23, 485–491 CrossRef CAS.
- R. F. Aroca, Surface-Enhanced Vibrational Spectroscopy, John Wiley & Sons Ltd, Ontario, 2006 Search PubMed.
| This journal is © The Royal Society of Chemistry 2011 |