Synthesis of FeS2 and Co-doped FeS2 films with the aid of supercritical carbon dioxide and their photoelectrochemical properties†
Jiqing
Jiao
,
Liuping
Chen
*,
Daibin
Kuang
,
Wei
Gao
,
Huajie
Feng
and
Jian
Xia
School of Chemistry and Chemical Engineering, Sun Yat-Sen University, Guangzhou, 510275, P. R. China. E-mail: cesclp@mail.sysu.edu.cn; Fax: +86-020-84112245; Tel: +86-020-84115559
First published on 2nd August 2011
Abstract
The prepared FeS2 and Co-doped FeS2 films revealed better properties in photocurrent response and photocatalysis of water photolysis under simulated sunlight. The films were synthesized on iron substrates with the aid of supercritical carbon dioxide. The experimental results demonstrated that the supercritical carbon dioxide could play an important role in evolution of phases and morphologies during the reaction process. Moreover, the prepared films were characterized by XRD, SEM, TEM and EDS. The UV-vis absorption spectroscopy indicated that the absorption edge has obvious blue shift compared with bulk FeS2. Interestingly, characteristics of photoelectric response and water photolysis were shown by photoelectrochemical experiments under sunlight. Therefore, the prepared films would have an advantage in water photolysis utilizing sunlight.
1 Introduction
As a renewable and clean energy source, solar energy is one of the most promising future energy resources. Sunlight can be transformed into electrical energy by photovoltaic cells and stored as chemical energy in a storage battery or in the form of hydrogen by the electrolysis of water.1 Especially, water oxidation driven by sunlight has received great attention because of its potential as a technology for the production of green fuel.2 Following the discovery of light-induced water-splitting with a TiO2 semiconductor photoanode under ultraviolet irradiation in 1972,3 there has been considerable interest in the photoelectrolysis of water with photoelectrochemical cells. This process results in oxygen evolution at the semiconductor photoanode and hydrogen evolution at the cathode.4 Up to now, a number of semiconductor materials have been focused on utilization of solar energy. Especially, TiO2 is a traditional material for the photoanode, which has become a benchmark material for understanding the photo-oxidation process in the water splitting reaction.3–15 However, the wide band gap of TiO2 (3 eV) is out of the visible light region and only a small fraction of the solar spectra can be utilized, which makes the final photoenergy conversion factor less than 1%.16 From the viewpoint of solar energy utilization, the development of photoelectric materials to split water efficiently under visible light is indispensable. Thus, new classes of semiconductor materials, such as Fe2O3 (Eg = 2.1 eV), WO3 (Eg = 2.5 eV) and FeS2, are continuously being tested in order to use the less energetic but more abundant visible light.1,16–19FeS2 has two crystal phases: pyrite and marcasite. Marcasite (Eg = 0.34 eV) is a metastable phase, which isn't applied to the process of photoelectric translation due to its small energy band gap. However, pyrite, as a cubic,20 has a suitable energy band gap (Eg = 0.95 eV) for the solar spectra. It has excellent electron mobility and high light absorption coefficient (α > 105 cm−1 for λ ≤ 700 nm), and its optical absorption coefficient is two orders of magnitude higher than that of crystalline silicon.21 These characteristics make pyrite a potential candidate as an absorber material for thin-film solar cells, photovoltaic cells and water photooxidation.22–24 However, the structure of its interface and the presence of bulk defects (point defects, dislocations) provide pathways for recombination and transfer of electrons through interfacial barriers. So extrinsic and intrinsic properties of pyrite still remain to be improved.25 In order to obtain better photoelectric properties, there are two main approaches, one is to develop new methods for preparing pyrite with a pure phase. The select synthesis of uniform FeS2 octahedral and cubic crystallites could be prepared by a facile surfactant-assisted ethylene glycol-mediated solvothermal approach.26 More Recently, J. Puthussery et al.27 used a simple hot-injection and subsequent partial ligand exchange route to synthesize phase-pure, single-crystalline, and well-dispersed colloidal pyrite nanocrystals inks, which were then fabricated by sintering layers at 500–600 °C under a sulfur atmosphere to obtain polycrystalline pyrite thin films. The other approach is to synthesize transition metals doped pyrite. Several different dopants have already been reported, such as Co,28Ti,29Ni,30Cu31 or Zn.25 For these elements, both FeS2 and CoS2 crystallize in the pyrite structure and constitute a mixed crystal system of general composition Fe1−xCoxS2 for (0 < x < 1).32–34 Recently, some technologies have been developed to produce thin pyrite films, such as evaporated iron layer,35 ion beam magnetron sputtering,36spray pyrolysis,37electrodeposition38 and magnetron sputtering.39 For all those methods, not only is the reaction temperature very high, but also the prepared samples are largely dependent on the equipment. Moreover, many sulfides, such as Fe3S4, Fe7S8, FeS, would be easily produced during the reaction process. Thus, further efforts should be devoted to investigating green and simple synthesis routes to produce pyrite and Co-doped FeS2 films.
As a preferred green solvent to traditional organic solvents, supercritical carbon dioxide (scCO2) has been used in materials science and industrial processes owing to its low viscosity, high diffusivity, nontoxicity, nonflammability, low cost and recyclability, etc. In the system of scCO2 and water, CO2 dissolves in water to form carbonic acid, thereby decreasing the pH value to 2.8–3.0 during the reaction process;40–42 and water–CO2 (W/C) microemulsions have been formed with specially designed surfactants.42 These properties are attractive for studying the formation of nanoparticles using the system of water and scCO2 according to reports.40–43 Previously, our group has reported nanosized materials synthesized with the aid of scCO2, which showed a significant effect on the crystallization of products.40–42 Herein, FeS2 and Co-doped FeS2 films could be successfully grown on iron substrates through the reaction of iron foil and sulfur source with the mixed system. The detailed reaction conditions, such as the pressure of the system, temperature and time, were investigated, and the structure of the films obtained was characterized. Furthermore, the prepared FeS2 and Co-doped FeS2 films were utilized as photoanodes, which demonstrated excellent properties for water splitting and photoelectric response by sunlight. Interestingly, compared with conventional dye-sensitized photoelectrodes, the films without dye sensitizer had better photoelectric properties under simulated sunlight.
2 Experimental
2.1 Chemicals
Chemicals: All reagents were of analytical grade and used as received. The chemicals used in the syntheses were sodium tripolyphosphate (Na5P3O10, STPP), sodium thiosulfate pentahydrate (Na2S2O3·5H2O), sulfur (S), potassium hydroxide (KOH), cobaltous chloride (CoCl2·6H2O), ethylene glycol and methanol, all of which were purchased from the Shanghai Reagent Company (P.R. China). The CO2 (purity: 99.95%) and iron (Fe) foil (purity: 99.99%, thickness: 0.1 mm, 1.0 cm × 0.5 cm) were provided by the Guangzhou Gas Company and Alfa Aesar, respectively.2.2 Synthetic method
Preparation of the FeS2 and Co-doped FeS2 films: In a typical synthetic procedure, a certain amount of Na5P3O10 was completely dissolved in 12 mL mixture solution (Vethylene glycol![[thin space (1/6-em)]](https://www.rsc.org/images/entities/char_2009.gif) :
:![[thin space (1/6-em)]](https://www.rsc.org/images/entities/char_2009.gif) Vdeionized water = 1
Vdeionized water = 1![[thin space (1/6-em)]](https://www.rsc.org/images/entities/char_2009.gif) :
:![[thin space (1/6-em)]](https://www.rsc.org/images/entities/char_2009.gif) 9) with stirring; 2.7919 g Na2S2O3·5H2O was added to the solution after complete dissolution of Na5P3O10; 0.1800 g sulfur powder was then injected into the solution with stirring. When the Co-doped FeS2 film was prepared, 0.0134 g CoCl2·6H2O were added to the solution. The prepared mixture was transferred into the PTFE reactor with the top with a small hole, which allows CO2 to flow into the reactor, then a piece of Fe foil (1.0 cm × 0.50 cm) was placed in the solution. Finally, the PTFE reactor was putted into the stainless steel autoclave which was then sealed. The stainless steel container was filled up with CO2 with a compressor. First, the reactor was purged with a flow of CO2 to remove any entrapped air from the autoclave and then filled with liquid CO2 to a desired amount using a high-pressure compressor. After charging, the autoclave was slowly heated to the desired temperature (FeS2: 160 °C; Co-doped FeS2: 180 °C), the pressure of reaction system should be controlled under 11 MPa. The reaction was maintained for 24 h. At the end of reaction, the autoclave was cooled to room temperature, and then CO2 was slowly vented through a pressure valve. The Fe foil was taken out of solution, washed with deionized water followed by ethanol three times, and finally air-dried for characterization. The detailed experimental conditions for the synthesis of the samples are listed in Table 1.
9) with stirring; 2.7919 g Na2S2O3·5H2O was added to the solution after complete dissolution of Na5P3O10; 0.1800 g sulfur powder was then injected into the solution with stirring. When the Co-doped FeS2 film was prepared, 0.0134 g CoCl2·6H2O were added to the solution. The prepared mixture was transferred into the PTFE reactor with the top with a small hole, which allows CO2 to flow into the reactor, then a piece of Fe foil (1.0 cm × 0.50 cm) was placed in the solution. Finally, the PTFE reactor was putted into the stainless steel autoclave which was then sealed. The stainless steel container was filled up with CO2 with a compressor. First, the reactor was purged with a flow of CO2 to remove any entrapped air from the autoclave and then filled with liquid CO2 to a desired amount using a high-pressure compressor. After charging, the autoclave was slowly heated to the desired temperature (FeS2: 160 °C; Co-doped FeS2: 180 °C), the pressure of reaction system should be controlled under 11 MPa. The reaction was maintained for 24 h. At the end of reaction, the autoclave was cooled to room temperature, and then CO2 was slowly vented through a pressure valve. The Fe foil was taken out of solution, washed with deionized water followed by ethanol three times, and finally air-dried for characterization. The detailed experimental conditions for the synthesis of the samples are listed in Table 1.
| No. | m STPP | m CoCl2 | T | p | t | V egw | Phase |
|---|---|---|---|---|---|---|---|
| a m STPP and mCoCl2 in g, mCoCl2 = mCoCl2·6H2O; T in oC; p in MPa, p= 0 means No CO2 in the reaction system; t in hours; Vegw = Vethylene glycol:Vdeionized water; X = unknown phases. | |||||||
| S1 | 2.0693 | 0 | 160 | 11 | 24 | 1![[thin space (1/6-em)]](https://www.rsc.org/images/entities/char_2009.gif) : :![[thin space (1/6-em)]](https://www.rsc.org/images/entities/char_2009.gif) 9 9 |
FeS2 |
| S2 | 2.0693 | 0 | 160 | 6 | 24 | 1![[thin space (1/6-em)]](https://www.rsc.org/images/entities/char_2009.gif) : :![[thin space (1/6-em)]](https://www.rsc.org/images/entities/char_2009.gif) 9 9 |
FeS2 |
| S3 | 2.0693 | 0 | 160 | 0 | 24 | 1![[thin space (1/6-em)]](https://www.rsc.org/images/entities/char_2009.gif) : :![[thin space (1/6-em)]](https://www.rsc.org/images/entities/char_2009.gif) 9 9 |
FeS2 + Fe7S8 |
| S4 | 2.0693 | 0 | 160 | 11 | 24 | 0![[thin space (1/6-em)]](https://www.rsc.org/images/entities/char_2009.gif) : :![[thin space (1/6-em)]](https://www.rsc.org/images/entities/char_2009.gif) 10 10 |
FeS2 + X |
| S5 | 2.0693 | 0 | 160 | 11 | 24 | 1![[thin space (1/6-em)]](https://www.rsc.org/images/entities/char_2009.gif) : :![[thin space (1/6-em)]](https://www.rsc.org/images/entities/char_2009.gif) 4 4 |
FeS2 + X |
| S6 | 0 | 0 | 160 | 11 | 24 | 1![[thin space (1/6-em)]](https://www.rsc.org/images/entities/char_2009.gif) : :![[thin space (1/6-em)]](https://www.rsc.org/images/entities/char_2009.gif) 9 9 |
FeS2 + Fe7S8 |
| S7 | 1.0347 | 0 | 160 | 11 | 24 | 1![[thin space (1/6-em)]](https://www.rsc.org/images/entities/char_2009.gif) : :![[thin space (1/6-em)]](https://www.rsc.org/images/entities/char_2009.gif) 9 9 |
FeS2 + Fe7S8 |
| S8 | 2.0693 | 0 | 160 | 11 | 36 | 1![[thin space (1/6-em)]](https://www.rsc.org/images/entities/char_2009.gif) : :![[thin space (1/6-em)]](https://www.rsc.org/images/entities/char_2009.gif) 9 9 |
FeS2 + Fe7S8 |
| S9 | 2.0693 | 0 | 160 | 11 | 48 | 1![[thin space (1/6-em)]](https://www.rsc.org/images/entities/char_2009.gif) : :![[thin space (1/6-em)]](https://www.rsc.org/images/entities/char_2009.gif) 9 9 |
FeS2 + Fe7S8 + X |
| S10 | 2.0693 | 0 | 180 | 11 | 24 | 1![[thin space (1/6-em)]](https://www.rsc.org/images/entities/char_2009.gif) : :![[thin space (1/6-em)]](https://www.rsc.org/images/entities/char_2009.gif) 9 9 |
FeS2 + X |
| S11 | 2.0693 | 0.0107 | 160 | 11 | 24 | 1![[thin space (1/6-em)]](https://www.rsc.org/images/entities/char_2009.gif) : :![[thin space (1/6-em)]](https://www.rsc.org/images/entities/char_2009.gif) 9 9 |
FeS2 + Fe7S8 |
| S12 | 2.0693 | 0.0107 | 180 | 11 | 24 | 1![[thin space (1/6-em)]](https://www.rsc.org/images/entities/char_2009.gif) : :![[thin space (1/6-em)]](https://www.rsc.org/images/entities/char_2009.gif) 9 9 |
Co-doped FeS2 |
2.3 Characterization
The X-ray diffraction (XRD) pattern was recorded on a D8 (Bruker, Germany) X-ray diffractometer with graphite monochromator Cu Ka radiation (λ = 1.54178) operating at 40 kV and 40 mA. Scanning electron microscopy (SEM) and energy-dispersive X-ray spectroscopy (EDS) were carried out with thermal field emission environmental SEM–EDS–EBSD (Quanta 400F, Holand). The EDS and transmission electron microscopy (TEM) image, selected area electron diffraction (SAED) pattern and high-resolution transmission electron microscopy (HRTEM) image were performed on a JEM-2010HR field emission transmission electron microscope (JEOL, Japan). UV–vis absorption spectrum was measured on UV–vis–NIR Spectrophotometer UV-3150 (SHIMADZU, Japan). All the measurements were performed at room temperature.2.4 Photoelectrochemical characterization
Photocurrents were measured in a three-electrode configuration with 1 mol·L−1KOH (Containing 10% methanol, 25 C, pH = 13.6) as electrolyte, Ag/AgCl/ sat. KCl as reference, and a platinum wire as counter electrode, separated by glass frits. Contact to the Fe substrate of the FeS2 film was made with a Cu clip wire above the electrolyte. The current of photoelectrochemical and photoelectric response were measured by an electrochemical workstation (CHI750B) under simulated sunlight illumination. The potential of the photoelectrode is reported against the reversible hydrogen electrode (RHE):| ERHE = EAgCl + 0.059pH + E°AgCl with E°AgCl = 0.1976 V at 25 °C |
3 Results and discussion
3.1 Synthesis of the FeS2 and Co-doped FeS2 films in scCO2
The phases of the iron sulfide products were characterized by XRD. Fig. 1 (S1 and S2) shows the XRD patterns of films prepared in the presence of CO2 at 160 °C. All peaks match quite well with the Joint Committee on Powder Diffraction Standards (JCPDS) card 42-1340, and no additional peaks were found. The result confirmed the formation of pure FeS2 crystals. S2 was obtained under 6 MPa, the peaks of S2 indicated that the product was pyrite. But S1 showed a good crystallinity compared with S2. However, peaks of FeS2 and Fe7S8 (JCPDS: 25-0411) were found when the reaction was conducted at 160 °C in the absence of CO2 (Fig. 1 S3). When deionized water without ethylene glycol was used as the solvent, an unknown phase is observed in the product (S4); when the proportion of ethylene glycol was increased (Vethylene glycol:Vdeionized water = 1![[thin space (1/6-em)]](https://www.rsc.org/images/entities/char_2009.gif) :
:![[thin space (1/6-em)]](https://www.rsc.org/images/entities/char_2009.gif) 4), more peaks of unknown phase could be seen in Fig. 1 (S5). Indubitably, these results demonstrated that the CO2 and ethylene glycol showed a significant effect on the crystallization of pyrite.
4), more peaks of unknown phase could be seen in Fig. 1 (S5). Indubitably, these results demonstrated that the CO2 and ethylene glycol showed a significant effect on the crystallization of pyrite.
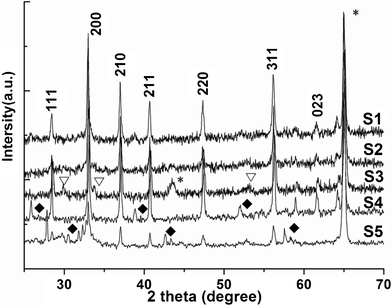 | ||
| Fig. 1 The XRD patterns of samples: (S1) Sample 1; (S2) Sample 2; (S3) Sample 3; (S4) Sample 4; (S5) Sample 5. *, ∇ and ✦ denote Fe, Fe7S8 and unknown phase, respectively. | ||
Furthermore, CO2 and ethylene glycol not only have an important effect on the phase formation, but also exert a key influence on the morphology of product. The diverse morphologies of Samples 1–5 can be obtained at different experimental conditions (Fig. 2). A low-magnification SEM image of the product obtained under 11 MPa is shown in Fig. 2a. The FeS2 film consists of a nanorod, a uniform nanorod with a length in the range 0.5–1 μm and less than 100 nm in diameter can be observed. Fig. 2b is an enlarged SEM image of the grain part of Fig. 2a, from which the number of ridges on the film can be clearly seen. The thickness of ridge top is less than 100 nm, much thinner than the bottom thickness. As seen from Fig. 2c, when the reaction pressure was reduced to 6 MPa, particles with different sizes and morphologies could be found. When the CO2 pressure decreased to 0 MPa, namely CO2 wasn't employed, irregular particles including large size grains and rods were prepared, which can be clearly observed in Fig. 2d. Similarly, when ethylene glycol wasn't added into the solvent, Sample 4 was made of polyhedron and small particles (Fig. 2e); when 2.4 mL ethylene glycol was injected into the solvent, irregular grains are obtained and the size was larger than 1 μm (Fig. 2f).
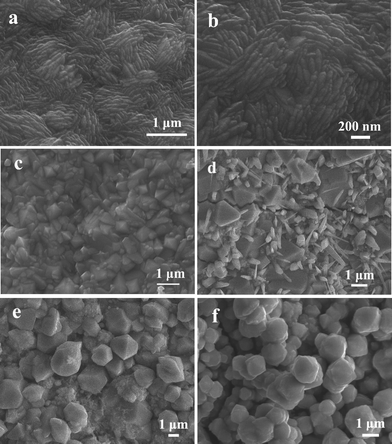 | ||
| Fig. 2 The SEM images of samples. (a) SEM images of Sample 1; (b) is enlarged picture of (a); (c) Sample 2; (d) Sample 3; (e) Sample 4; (f) Sample 5. | ||
The evident differences in the phase and morphology obtained suggest that the CO2 and ethylene glycol could play an important role in both the crystal phase and alignment of samples. This could be interpreted below: the release rates of H+ ions and Fe2+ ions from iron substrates were possibly affected by the pH value of the solution, since scCO2 dissolves into water to form carbonic acid. Furthermore, the pH value can be controlled by changing the pressure of CO2, namely, the release rates of both H+ ions and Fe2+ ions can be easily adjusted by varying the CO2 pressure, and therefore the morphology of FeS2 was controlled by regulating the pressure of the reaction system. A similar result was reported previously.40 As for ethylene glycol, on the one hand, it dissolved in water and changed the solubility of CO2 in the solution mixture, and then the pH value of the solution was adjusted; on the other hand, it could affect the solubility of S in the solution mixture. The formation of FeS2 is represented by the following equations:
 | (1) |
 | (2) |
 | (3) |
The results demonstrate that variations in reaction conditions including the additive, pressure, reaction temperature and doped reagent, result in dramatic differences in the form and crystal phases of the FeS2 and Co-doped FeS2 films (Table 1). In the current synthetic system, the STPP played also an important role in crystallization of FeS2. As shown in Fig. 3 S6, mixed phases including FeS2, Fe7S8, etc., were prepared without STPP; when 1.0347 g STPP was injected into the solution, the diffraction peaks of Fe7S8 were still found in the XRD pattern (Fig. 3 S7). When STPP was increased to 2.0693 g, pure pyrite FeS2 was successfully synthesized at last. The result indicates that the STPP may be a favourable factor for the formation of pyrite, which hasn't been reported previously in the literature. Furthermore, to investigate the evolution of morphology with time, synthetic experiments with different reaction times were conducted. When 36 h was adopted, one can see the peaks of Fe7S8 in the pattern (Fig. 3 S8); when the reaction time was increased to 48 h, the peaks of Fe7S8 and unknown phase can be found (Fig. 3 S9). Thus, 24 h was appropriate to prepare the rod-like nanostructured pyrite in this work. As an important experimental parameter, different reaction temperatures were adopted to synthesize the samples. Sample 10 was prepared at 180 °C. It is evident in S10 that the peaks at 2θ of 23.2, 37.8 and 56.3 can't be indexed to correspond to the sulfide from Fig. 3. Thus, unknown compounds were prepared in S10 besides pyrite.
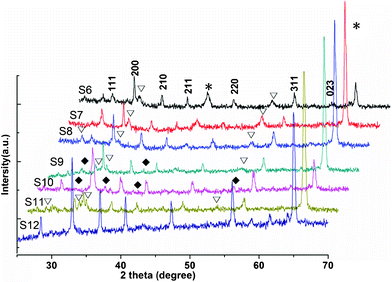 | ||
| Fig. 3 The XRD patterns of other samples: (S6) Sample 6; (S7) Sample 7; (S8) Sample 8; (S9) Sample 9; (S10) Sample 10; (S11) Sample 11; (S12) Sample 12. *, ∇ and ✦ denote Fe, Fe7S8 and unknown phase, respectively. | ||
It is well known that pure pyrite films show p-type conduction, and doping is necessary to obtain n-type conduction. The improvement of electronic properties directly relates to the distribution of dopant across the pyrite film.32 Therefore, experiments were designed to produce n-type conduction in pyrite through doping cobalt in scCO2 and water. When 0.0107 g CoCl2 was injected into the solution, Co-doped FeS2 film could be prepared at 160 °C. However, as shown in Fig. 3 S11, more peaks of Fe7S8 could be clearly observed besides peaks of FeS2. Surprisingly, only the doped pyrite film was obtained at 180 °C (Fig. 3 S12). This fact indicated that the doping procedure for pyrite by Co needs higher temperature in the same reaction medium. The element component of prepared Sample 12 was recorded by energy-dispersive X-ray spectroscopy (EDS). As seen in Fig. 4a, the EDS demonstrates that the product consists of three elements. The Fe peaks at about 0.7 and 6.4 keV, Co peak at about 0.7 keV and the S peak at 2.4 keV are observed. The Fe, Co and S atomic percentages are analyzed to be 30.39%, 1.49% and 68.12%, respectively. The EDS analysis of the compound reveals that the product is mainly composed of Fe, Co and S and its atomic ratio is about 0.985![[thin space (1/6-em)]](https://www.rsc.org/images/entities/char_2009.gif) :
:![[thin space (1/6-em)]](https://www.rsc.org/images/entities/char_2009.gif) 0.015
0.015![[thin space (1/6-em)]](https://www.rsc.org/images/entities/char_2009.gif) :
:![[thin space (1/6-em)]](https://www.rsc.org/images/entities/char_2009.gif) 2. Fig. 4b shows a low-magnification SEM image of the Co-doped FeS2 film (S12), indicating the close layer consists of lager particles, the top of which has plenty of subulate ridges. An enlarged SEM image shown in Fig. 4c suggests that the surface of the film scatters lots of ridges and its top of thickness is less than 100 nm. Compared with S1 prepared at 160 °C, the thickness of ridge (S12) is much larger. The above results indicate that the higher temperature is necessary for the Co doping into the pyrite crystal lattice. But their products have a similar morphology.
2. Fig. 4b shows a low-magnification SEM image of the Co-doped FeS2 film (S12), indicating the close layer consists of lager particles, the top of which has plenty of subulate ridges. An enlarged SEM image shown in Fig. 4c suggests that the surface of the film scatters lots of ridges and its top of thickness is less than 100 nm. Compared with S1 prepared at 160 °C, the thickness of ridge (S12) is much larger. The above results indicate that the higher temperature is necessary for the Co doping into the pyrite crystal lattice. But their products have a similar morphology.
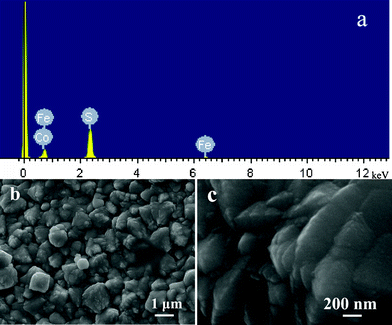 | ||
| Fig. 4 (a) The energy-dispersive X-ray spectrum for S12; (b) the SEM image of S12; and (c) is the enlarged picture of (b). | ||
The FeS2 and Co-doped FeS2 films were further investigated by TEM shown in Fig. 5 displaying a more detailed structure of the crystal. Fig. 5a confirms the taper morphology of FeS2, and lots of the particles assemble into the film. The thickness of the top is much thinner than that of the bottom. The result is in good agreement with structures obtained from SEM observation mentioned above in Fig. 2a and b. The top inset SAED pattern corresponding to the tip (1 region), the (111), (200) and (1![[1 with combining macron]](https://www.rsc.org/images/entities/char_0031_0304.gif)
![[1 with combining macron]](https://www.rsc.org/images/entities/char_0031_0304.gif) ) planes of FeS2 (JCPDS 42-1340) are determined from the sharp spots due to the [02
) planes of FeS2 (JCPDS 42-1340) are determined from the sharp spots due to the [02![[2 with combining macron]](https://www.rsc.org/images/entities/char_0032_0304.gif) ] zone, which demonstrates it has a single crystal structure. The corresponding HRTEM image shows the clear crystal lattice planes (Fig. 5b), which also have been obtained from [02
] zone, which demonstrates it has a single crystal structure. The corresponding HRTEM image shows the clear crystal lattice planes (Fig. 5b), which also have been obtained from [02![[2 with combining macron]](https://www.rsc.org/images/entities/char_0032_0304.gif) ]–projected. The fringe space is determined to be 0.31 nm, which is in accordance with the (111) lattice spacing of FeS2. The TEM image (Fig. 5c) clearly shows the size and morphology of Co-doped FeS2 particles. The EDS shows that the components of product are Fe, Co and S (Fig. 5 in the ESI†). As seen from the corresponding HRTEM image of the 2 region (Fig. 5d), the top of the inset corresponding to fast fourier transform (FFT), and the clear lattice fringes reveal a good crystallinity.
]–projected. The fringe space is determined to be 0.31 nm, which is in accordance with the (111) lattice spacing of FeS2. The TEM image (Fig. 5c) clearly shows the size and morphology of Co-doped FeS2 particles. The EDS shows that the components of product are Fe, Co and S (Fig. 5 in the ESI†). As seen from the corresponding HRTEM image of the 2 region (Fig. 5d), the top of the inset corresponding to fast fourier transform (FFT), and the clear lattice fringes reveal a good crystallinity.
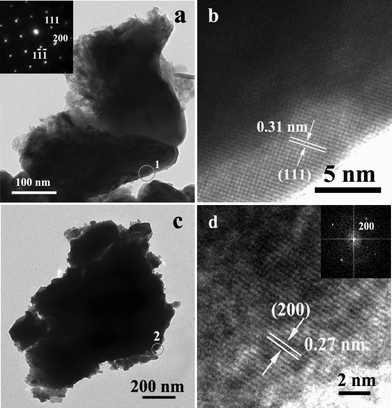 | ||
| Fig. 5 (a) TEM image of sample 1. The top inset is SAED pattern corresponding to 1 region; (b) HRTEM image corresponding to 1 region; (c) TEM image of sample 12; (d) HRTEM image corresponding to 2 region, the top inset is its FFT. | ||
3.2 The properties of photoelectric response and water photolysis
The optical property of FeS2 and Co-doped FeS2 films was determined by UV-vis absorption spectroscopy. As shown in Fig. 6, the larger absorption of S1 and S12 starts from around 600 nm and it reaches saturation at about 450 nm. As we know, when the size of the product grains is considerably larger, quantum-confinement effects seem inexistent. However, compared with the direct band gap 0.9 eV (λ = 1375 nm) of bulk FeS2,44 the current experimental results show that the absorption edge has an obvious blue shift, indicating the strong quantum confinement of FeS2 and Co-doped FeS2 films. It can be concluded that the reason would be that quantum-confinement effects possibly occur near the peak edge of the tips, which are thinner, since the optical properties of non-spherical nanocrystals are controlled by the lowest dimension of nanocrystals.42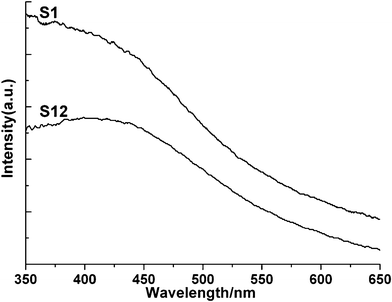 | ||
| Fig. 6 UV-vis absorption spectra of S1 and S12. | ||
To investigate the electron-transfer process, several sets of photoelectrochemical experiments were carried out to measure the photocurrent response of the films. Potentiostatic (current and time) experiments were conducted to check the photoresponse properties of the films. Fig. 7a shows the photocurrent and dark current transients obtained using the films as photoanodes. The experimental equipment ran for 100 s firstly, then the illuminating time was taken for 10 s each time. When the electrodes were illuminated by simulated sunlight, the increase in the current density for FeS2 film was 0.50 mA·cm−2, but it was about 1.0 mA·cm−2 for Co-doped FeS2 film; when the illumination was interrupted, the current density rapidly dropped to the original value of steady state. The current responded with the turn-on and turn-off of the light quickly. Compared with the photoelectric response of synthesized films, the photocurrent wasn't produced when the iron film was illuminated. Up to now, the photoelectric response of lots of materials have been reported in the literature, such as Ru(dcbpy)2(NCS)2 sensitized ZnO, polyoxophosphotungstate-TiO2/Ti under UV pulse illumination and Tl2O3 films in the 1 mol·L−1KOH containing 0.18 mol·L−1TlAc.45–47 Although the FeS2 and Co-doped FeS2 films weren't sensitized, their photoelectric response could be displayed under simulated sunlight. And these films could be suitable for application under sunlight.
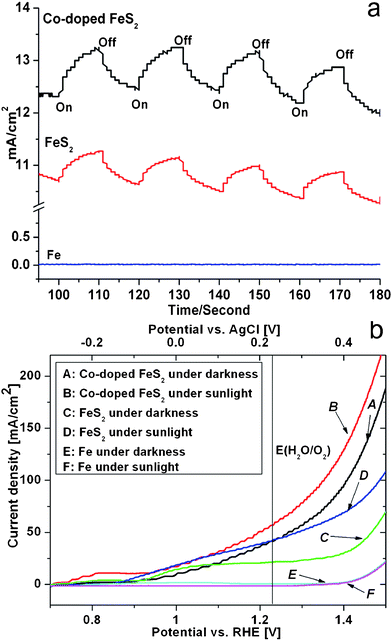 | ||
| Fig. 7 (a) Photocurrent response and (b) Current–voltage behavior of Fe, FeS2 (S1) and Co-doped FeS2 (S12) films under the darkness and illumination of simulated sunlight. Light intensity: 100 mW·cm−2; electrolyte: 1 mol·L−1KOH containing 10% methanol. | ||
Fig. 7b displays the current–voltage (I–V) curves of Fe, FeS2 and Co-doped FeS2 films under darkness and simulated sunlight, respectively. The current of Fe film wasn't measured under both of darkness and sunlight up to about 1.4 VRHE. The current of FeS2 film could be determined at 0.94 VRHE under darkness at first, then the current rises slowly to 19.5 mA·cm−2 at 1.1 VRHE and it remains almost constant until 1.4 VRHE. Corresponding to the potential of the reversible oxygen electrode, the current density is 21.6 mA·cm−2 at 1.23 VRHE; the photocurrent of FeS2 film would be produced at 0.90 VRHE under sunlight and the cathodic shift of voltage value is about 0.04 V. The photocurrent rapidly increased and the current density reached 42.5 mA·cm−2. Under similar conditions, the current of Co-doped FeS2 film is produced at about 0.94 VRHE under darkness. The current density rapidly goes up to 42.5 mA·cm−2 at 1.23 VRHE, which is almost twice of FeS2 film. Surprisingly, the photocurrent would be determined at 0.72 VRHE under sunlight and the cathodic shift is about 0.22 V which is much larger than that of FeS2. The photocurrent steeply climbed and the current density arrived to 56.8 mA·cm−2 under sunlight, which is larger than that of FeS2 under illumination condition. The photocurrent density of FeS2 and Co-doped FeS2 is higher than that of reported materials such as Fe2O3 and TiO2.1,48,49
Based on the current experimental results and reports,49,50 the possible schematic of water splitting would be deduced to understand how the prepared films help to split water. Step I, the films absorbs photon energy which is greater than the band gap energy of the material, then photoexcited electrons and holes pairs are generated on the films; step II, electrons and holes would immediately reach the surface of the films; Step III, CH3OH, which was adsorbed by the surface of the films, would be easily oxidized by holes to CO2 in the surface (CH3OH can be easily oxidized than water). The electrons flow toward the substrate (Fe) and pass to the cathode (Pt) through the external circuit, which induced H2O to be reduced, and then H2 would be generated. The first step is strongly dependent on the structure and electronic properties of the materials. Especially, a number of photoexcited electrons and holes can recombine in the second step, which largely reduces the photooxidation ability. In this study, on the one hand, CH3OH, a sacrificial reagent, promoted H2 evolution by its preferential photooxidation. And it relatively decreases the rate of the surface recombination between the surface hole and electron pairs because the concentration of holes on the surface decreases as to capture holes; on the other hand, the iron substrate has better electric conductivity than the prepared films. The electrons can easily reach the Fe substrate, which reduce the electrons and holes recombination loss. Consequently, the presence of CH3OH and the use of substract (Fe) promote H2 evolution under illumination because of decrease in the surface recombination rate of the electron and hole. Thus, compared with the literature reported,1,48,49 the photocurrent density of FeS2 and Co-doped FeS2 is higher.
In addition, electron paramagnetic resonance suggested that Co2+ substituting Fe2+ in the pyrite structure introduces defect states at different energy levels within the forbidden zone.51 The Co defect state with a donor electron occurs in the band gap, near or possibly overlapping the conduction band energy, so the extra electrons easily move into the conduction band. Furthermore, cobalt would play a catalytic role during the photocurrent process. The electrocatalytic activity of cobalt and iron/cobalt oxides for water oxidation is well established and involves the CoII/CoIII and CoIII/CoIV couples.1,52,53 The distinct photocurrent response and photocurrent density of the FeS2 and Co-doped FeS2 can be attributed to the cobalt doped in the pyrite.
Conclusions
Pyrite FeS2 and Co-doped FeS2 films were synthesized with the aid of scCO2. Diverse phases and morphologies could be obtained by controlling different reaction conditions. The reaction conditions including the pressure, precursor, STPP, reaction temperature and doped reagent, result in dramatic differences in the crystal phases. The UV-vis absorption spectroscopy of these films indicated that the absorption wavelength has an obvious blue shift compared with bulk FeS2. Photoelectrochemical experiments were conducted to measure the photocurrent response of the films. The current increase of FeS2 films was 0.5 mA·cm−2, and the current increase of Co-doped FeS2 films was about 1 mA·cm−2 under sunlight. As shown in the current–voltage (I–V) curve, the current density of FeS2 achieved 42.5 mA·cm−2 at 1.23 VRHE and the cathodic shift of voltage value was about 0.04 V under sunlight. The doped Co2+ electrode resulted in a 0.22 V cathodic shift, and the photocurrent increased to 56.8 mA.cm−2 at 1.23 VRHE. The present study has demonstrated that the FeS2 and Co-doped FeS2 films prepared display excellent properties for photoelectric response and water photolysis under sunlight.Acknowledgements
We gratefully appreciate the assistance with the photoelectrochemical characterization of Mr. Bingxin Lei and Mr. Xihong Lu.References
- A. Kay, I. Cesar and M. Grätzel, J. Am. Chem. Soc., 2006, 128, 15714 CrossRef CAS
.
- J. A. Turner, Science, 1999, 285, 687 CrossRef CAS
.
- A. Fujishima and K. Honda, Nature, 1972, 238, 37 CrossRef CAS
.
- M. Grätzel, Nature, 2001, 414, 338 CrossRef
.
- A. J. Nozik, Nature, 1975, 257, 383 CrossRef CAS
.
- Z. W. Qu and G. J. Kroes, J. Phys. Chem. B, 2006, 110, 23306 CrossRef CAS
.
- I. J. Ferrer, H. Mukaki and P. Salvador, J. Phys. Chem., 1986, 90, 2805 CrossRef CAS
.
- A. L. Linsebigler, G. Lu and J. T. Yates, Jr, Chem. Rev., 1995, 95, 735 CrossRef CAS
.
- L. Kavan, M. Grätzel, S. E. Gilbert, C. Klemenz and H. J. Scheel, J. Am. Chem. Soc., 1996, 118, 6716 CrossRef CAS
.
- R. Nakamura and Y. Nakato, J. Am. Chem. Soc., 2004, 126, 1290 CrossRef CAS
.
- R. Nakamura, T. Okamura, N. Ohashi, A. Imanishi and Y. Nakato, J. Am. Chem. Soc., 2005, 127, 12975 CrossRef CAS
.
- B. Neumann, P. Bogdanoff, H. Tributsch, S. Sakthivel and H. Kisch, J. Phys. Chem. B, 2005, 109, 16579 CrossRef CAS
.
- F. Allegretti, S. O'Brian, M. Polcik, D. I. Sayago and D. P. Woodruff, Phys. Rev. Lett., 2005, 95, 226104/1 CrossRef CAS
.
- G. Mattioli, F. Filippone and A. A. Bonapasta, J. Am. Chem. Soc., 2006, 128, 13772 CrossRef CAS
.
- T. Bak, J. Nowotny, M. Rekas and C. C. Sorrell, Int. J. Hydrogen Energy, 2002, 27, 991 CrossRef CAS
.
- Á. Valdésa and G. J. Kroes, J. Chem. Phys., 2009, 130, 114701/1 Search PubMed
.
- Z. Zou, J. Ye, K. Sayama and H. Arakawa, Nature, 2001, 414, 625 CrossRef CAS
.
- C. Santato, M. Ulmann and J. Augustynski, Adv. Mater., 2001, 13, 511 CrossRef CAS
.
- W. Jaegermann and H. Tributsch, J. Appl. Electrochem., 1983, 13, 743 CrossRef CAS
.
- A. K. Kleppe and A. P. Jephcoat, Mineral. Mag., 2004, 68, 433 CrossRef CAS
.
- A. Ennaoui, S. Fiechter, C. Pettenkofer, N. Alonso-Vante, K. Büker, C. Häpfner and H. Tributsch, Sol. Energy Mater. Sol. Cells, 1993, 29, 289 CrossRef CAS
.
- A. Ennaoui, S. Fiechter, H. Goslowsky and H. Tributsch, J. Electrochem. Soc., 1985, 132, 1579 CrossRef CAS
.
- Y. Hu, Z. Zheng, H. M. Jia, Y. W. Tang and L. Z. Zhang, J. Phys. Chem. C, 2008, 112, 13037 CAS
.
- H. Duan, Y. F. Zheng, Y. Z. Dong, X. G. Zhang and Y. F. Sun, Mater. Res. Bull., 2004, 39, 1861 CrossRef CAS
.
- K. Büker, S. Fiechter, V. Eyert and H. Tributsch, J. Electrochem. Soc., 1999, 146, 261 CrossRef
.
- D. W. Wang, Q. H. Wang and T. M. Wang, CrystEngComm, 2010, 12, 755 RSC
.
- J. Puthussery, S. Seefeld, N. Berry, M. Gibbs and M. Law, J. Am. Chem. Soc., 2011, 133, 716 CAS
.
- J. Oertel, K. Ellmer, W. Bohne, J. Röhrich and H. Tributsch, J. Cryst. Growth, 1999, 198(199), 1205 CrossRef
.
- A. Pascual, P. Díaz-Chao, I. J. Ferrer, C. Sánchez and J. R. Ares, Sol. Energy Mater. Sol. Cells, 2005, 87, 575 CrossRef CAS
.
- S. Lehner, K. Savage, M. Ciobanu and D. E. Cliffel, Geochim. Cosmochim. Acta, 2007, 71, 2491 CrossRef CAS
.
- I. J. Ferrer, C. de las Heras and C. Sánchez, Appl. Surf. Sci., 1993, 70(71), 588 CrossRef
.
- P. Díaz-Chao, I. J. Ferrer and C. Sánchez, Thin Solid Films, 2008, 516, 7116 CrossRef
.
- R. J. Bouchard, Mater. Res. Bull., 1968, 3, 563 CrossRef CAS
.
- S. Ogawa and T. Teranishi, Phys. Lett. A, 1972, 42, 147 CrossRef CAS
.
- B. Rezig, H. Dahman and M. Kenzari, Renewable Energy, 1992, 2, 125 CrossRef CAS
.
- M. Birkholz, D. Lichtenberger, C. Hopfner and S. Fiechter, Sol. Energy Mater. Sol. Cells, 1992, 27, 243 CrossRef CAS
.
- B. Thomas, K. Ellmer and M. Muller, J. Cryst. Growth, 1997, 170, 808 CrossRef CAS
.
- S. Nakamura and A. Yamamoto, Sol. Energy Mater. Sol. Cells, 2001, 65, 79 CrossRef CAS
.
- G. Willeke, R. Dasbach and B. Sailer, Thin Solid Films, 1992, 213, 271 CrossRef CAS
.
- J. Q. Jiao, L. P. Chen, X. Liu, W. Gao and F. J. Feng, Mater. Res. Bull., 2009, 44, 1161 CrossRef CAS
.
- J. Q. Jiao, X. Liu, W. Gao, C. W. Wang, F. J. Feng, X. L. Zhao and L. P. Chen, Solid State Sci., 2009, 11, 976 CrossRef CAS
.
- J. Q. Jiao, X. Liu, W. Gao, C. W. Wang, H. J. Feng, X. L. Zhao and L. P. Chen, CrystEngComm, 2009, 11, 1886 RSC
.
- K. T. Lim and H. S. Hwang, Langmuir, 2004, 20, 2466 CrossRef CAS
.
- P. Gao, Y. Xie, L. N. Ye, Y. Chen and Q. X. Guo, Cryst. Growth Des., 2006, 6, 583 CAS
.
- Y. B. Xie, Adv. Funct. Mater., 2006, 16, 1823 CrossRef CAS
.
- M. Yang, D. J. Wang, L. Peng, T. F. Xie and Y. Y. Zhao, Nanotechnology, 2006, 17, 4567 CrossRef CAS
.
- J. F. Liu, Z. H. Lu, S. Y. Zhao and K. Z. Yang, Supramol. Sci., 1998, 5, 541 CrossRef CAS
.
- S. E. John, S. K. Mohapatra and M. Misra, Langmuir, 2009, 25, 8240 CrossRef CAS
.
- S. K. Mohapatra, S. E. John, S. Banerjee and M. Misra, Chem. Mater., 2009, 21, 3048 CrossRef CAS
.
- K. Izawa, T. Yamada, U. Unal, S. Ida, O. Altuntasoglu, M. Koinuma and Y. Matsumoto, J. Phys. Chem. B, 2006, 110, 4645 CrossRef CAS
.
- R. N. Chandler and R. W. Bene, Phys. Rev. B, 1973, 8, 4979 CrossRef CAS
.
- B. S. Brunschwig, M. H. Chou, C. Creutz, P. Ghosh and N. Sutin, J. Am. Chem. Soc., 1983, 105, 4831 CrossRef
.
- Y. Matsumoto and E. Sato, Mater. Chem. Phys., 1986, 14, 397 CrossRef CAS
.
Footnote |
| † Electronic supplementary information (ESI) available. See DOI: 10.1039/c1ra00066g |
| This journal is © The Royal Society of Chemistry 2011 |
