Combining catalytic chain transfer polymerisation (CCTP) and thio-Michael addition: enabling the synthesis of peripherally functionalised branched polymers†
Kayleigh. A.
McEwan
and
David. M.
Haddleton
*
Department of Chemistry, The University of Warwick, Gibbet Hill, Coventry, United Kingdom. E-mail: D.M.Haddleton@warwick.ac.uk; Fax: +44 2476 528267; Tel: +44 2476 523256
First published on 20th June 2011
Abstract
Catalytic chain transfer polymerisation (CCTP) of divinyl monomers has been used to synthesise a family of branched polymers, which retain vinyl functionality; a range of decorated branched polymers have been prepared via thio-Michael addition.
Introduction
Interest in branched polymers has increased due to properties resulting from their structure and functionality.1 Attractive properties of branched polymers include increased solubility, reduced solution viscosity and a high level of terminal functionality.2 Synthesis of branched polymers by cobalt catalysed chain transfer polymerisation (CCTP) can be achieved by incorporation of a multi-vinyl monomer to the polymerisation. This method is unique in that it produces polymers with high levels of terminal vinyl functionality, using very low amounts of cobalt catalyst.3–5 Living radical polymerisation has also been used to prepare branched polymers with both highly branched structures and numerous vinyl functional groups.6 In addition an alternative method for the synthesis of hyperbranched polymers has emerged using controlled free radical polymerisation employing silyl enol ethers as termination agents, preventing gelation and incorporating terminal ketone functionality.7CCTP is a controlled free radical technique which produces low molecular weight macromonomers, using catalysts with chain transfer constants up to four orders of magnitude greater than conventional chain transfer agents, such as thiols, for methacrylates.8–14CCTP has been exploited in industry but academic interest in this field has been somewhat limited.15
Typically, a macrocyclic low spin cobalt(II) chain transfer agent is used in catalytic amounts, which acts via transfer of a hydrogen atom between itself and monomer or a propagating chain, producing a vinyl terminated transfer product which can either remain dormant or be involved in a reinitiation step. The most frequently used catalyst is a cobaloxime bridged with boron fluoride (CoBF). This has high stability towards oxygen and acids, good solubility in a range of solvents/systems and very high catalytic activity. CCTP is effective for a range of vinyl monomers but is most effective with α-methyl substituted monomers such as methacrylates, leading to a terminal vinyl group which is favoured over in-chain double bonds.16–18 Thus far the main application of CCTP has been in coatings. It has been employed as a high solids coating and its terminal vinyl functionality has been utilised, introducing crosslinking or chain extension on application.19,20
These very effective chain transfer agents can be used in the synthesis of branched polymers, by use of commercially available di-methacrylates.21Thiol-ene click chemistry provides an attractive and effective route to the exploitation of this high level of vinyl groups,22 creating a versatile system whereby branching and functionality can be introduced and controlled.22,23 Several new click reactions have been classified over the past decade,24 including methods of metal free click including thio-click using a UV radical source or radical initiator,25–27 Diels–Alder chemistry28,29 and Michael addition reactions.30,31Michael addition is a classical organic chemistry reaction32 and is finding increasing use in polymer chemistry.33 Recent advances in thiol-ene click chemistry have led to the development of basic/nucleophilic catalysts for thio-Michael reactions, in particular trialkyl phosphines.15,33–35 The phosphine catalyst reacts with an electron deficient vinyl bond leading to an enolate base, which subsequently deprotonates the thiol. The thiolate anion then conjugates to an electron deficient vinyl bond (Scheme 1).34
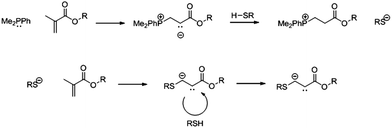 | ||
| Scheme 1 Phosphine mediated thio-Michael addition of a functional thiol to a methacrylate using dimethylphenylphosphine as a catalyst. | ||
Use of chain transfer agents with difunctional monomers has been successful, as demonstrated in research by Sherrington, who has utilised thiols very effectively.36–42 Guan reported the use of CCTP in a similar fashion in 2002, reporting control of polymer topology and the synthesis of hyperbranched polymers by CCTP. At the outset of this current work we were aware that Sherrington had disputed the data of Guan, stating that much higher levels of cobalt catalysts would be required to avoid gelation and that homopolymerisation of dimethacrylates without dilution by monofunctional monomers was said to be impossible.37
In this current work, we firstly validate the work of Guan and extend this to describe the combination of CCTP and thio-Michael addition obtaining a range of branched polymers with an array of peripheral functionalities.
Results and discussion
Branched polymer synthesis
Using the CCTP conditions previously outlined by Guan, various branched homopolymers and copolymers of ethylene glycol dimethacrylate (EGDMA) were synthesised (Scheme 2).21 Low molecular weight branched polymers were formed with oligomeric products observed by gel permeation chromatography (GPC). Fig. 1 shows the overlay of GPC traces collected hourly over the course of reaction A. The monomer peak (t = 0) decreased as the reaction proceeded, forming discernible dimer, trimer, and polymeric products. | ||
| Scheme 2 General reaction scheme for CCTP of ethylene glycol dimethacrylate (EGDMA).21 | ||
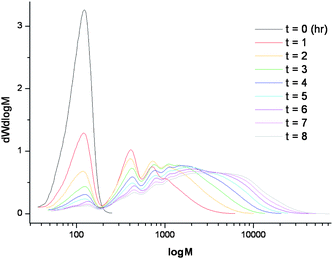 | ||
| Fig. 1 Overlay of GPC spectra for polymerisation A, monitored hourly (EGDMA homopolymer, CoBF (0.049 mol%), V-601, dichloroethane, 70 °C, 8 h, Mn = 1700 g mol−1, Mw = 4900 g mol−1, PDi = 2.9, conversion 93%). | ||
Conversion was monitored by Gas Chromatography-Flame Ionisation Detection (GC-FID). Using GC-FID the decreasing monomer concentration is monitored throughout the polymerisation, using a comparison to an internal standard to give conversion of monomer. The reaction was terminated after 8 h, obtaining a conversion of 93%, Fig. 2. Repeat experiments under the same conditions were performed and consistent results were obtained.
 | ||
| Fig. 2 Conversion data (GC-FID) for A montiored hourly (EGDMA homopolymer, CoBF (0.049 mol%), V-601, dichloroethane, 70 °C, 8 h, Mn = 1700 g mol−1, Mw = 4900 g mol−1, PDi = 2.9, conversion 93%). | ||
Conversion was also measured by GPC peak deconvolution of the dW/dlogMvs. logM plots. Oligomer peaks were deconvoluted and their area ratios used to calculate conversion of monomer, dimer, trimer and polymer products throughout the polymerisation, Fig. 3. Comparison of the two methods for determining conversion, GC-FID and GPC peak deconvolution, were in close correlation.
 | ||
| Fig. 3 Conversion data obtained viaGPC deconvolution for polymerisation A (EGDMA homopolymer, CoBF (0.049 mol%), V-601, dichloroethane, 70 °C, 8 h, Mn = 1700 g mol−1, Mw = 4900 g mol−1, PDi = 2.9, conversion 93%). | ||
The concentration of low mass oligomer are highest at the beginning of the polymerisation and decrease during the polymerisation. One key observation is that crosslinking occurs only when the Mw is high and monomer concentration is relatively low (below 20%). Thus, many of the subsequent reactions were subjected to early termination (between 6 to 10 h duration), giving overall conversions of >90%, but ensuring that gelation would not occur.
Although crosslinking can be avoided by termination of the polymerisation prior to gelation, care has to be taken to avoid post polymerisation crosslinking. This manifests itself by products becoming cloudy after a few days, accompanied by formation of a brown precipitate. This is consistent with oxidation of the cobalt(II) catalyst to a less soluble cobalt(III) species. Once the [Co(II)] falls below a certain level crosslinking occurs. To avoid this an antioxidant (1% topanol) was added, preventing this indefinitely.
Product A was investigated by matrix assisted laser desorption ionisation–time of flight (MALDI-TOF), Fig. 4. The spectrum shows a peak difference of approximately 198 Daltons, the repeat unit of the polymer. The most intense series of peaks correspond to polymer chains initiated by a hydrogen atom from [Co(III)-H]. The lower intensity peak series arises from polymers initiated by the primary radicals from the azo initiator.43,44EGDMA polymers incorporating one unit of hydroxyethyl methacrylate (HEMA) are also observed (minor peaks), this being an impurity in the EGDMA.
 | ||
| Fig. 4 MALDI-TOF spectrum of A (EGDMA homopolymer, CoBF (0.049 mol%), V-601, dichloroethane, 70 °C, 8 h, Mn = 1700 g mol−1, Mw = 4900 g mol−1, PDi = 2.9, conversion 93%). | ||
Increasing molecular weight by reduction in CoBF concentration
In order to prepare a range of molecular weights of branched PEGDMA the CoBF concentration was decreased, increasing the molecular weight of the products. CoBF concentrations of 0.039 (B), 0.029 (C), 0.019 and 0.009 mol% CoBF relative to monomer were attempted. When decreasing the CoBF concentration extra care was taken to avoid crosslinking by earlier termination of polymerisations. Attempts made to synthesise polymers using 0.019 and 0.009 mol% CoBF gelled within one hour and consequentially could not be characterised by solution techniques. Higher molecular weight polymers were successfully synthesised using [CoBF] = 0.039 and 0.029 mol%. The lower the concentration of CoBF the more rapidly the molecular weight and polydispersity increased, Table 1. MALDI-TOF spectra for B and C were also obtained for structural comparison to A. The results showed that all the products possessed the same peaks of different intensities, indicating the same products had been formed, with differing molecular weights (see ESI).| Name | Monomer | Ratio of CoBF to monomer (%) | Mn g mol−1 | Mw g mol−1 | PDi | Conversion (%) | Duration (hr) |
|---|---|---|---|---|---|---|---|
| A | EGDMA | 0.049 | 1700 | 4900 | 2.9 | 93 | 8 |
| B | EGDMA | 0.039 | 1600 | 5600 | 3.5 | 91 | 6 |
| C | EGDMA | 0.029 | 1800 | 8000 | 4.5 | 88 | 4 |
Effect of monomer concentration
An investigation was carried out to determine the effect of monomer concentration for the CCTP of EGDMA. The same conditions were used as in polymerisation A, with only the volume of solvent as a variable. All reactions were left for 26 h, providing they had not gelled prior to this, Table 2.| Name | Monomer/Solvent (by volume) | Mn g mol−1 (10 h) | Mw g mol−1 (10 h) | PDi (10 h) | Conversion (10 h) (%) | End State of Polymer (26 h) |
|---|---|---|---|---|---|---|
| D | 100/0 | N/A | N/A | N/A | N/A | Gel |
| E | 75/25 | 2300 | 20800 | 9 | 93.4 | Gel |
| F | 67/33 | 2100 | 13800 | 6.7 | 96 | Gel |
| G | 50/50 | 2000 | 9700 | 5 | 96.6 | Liquid |
| H | 33/67 | 1800 | 6500 | 3.6 | 96.9 | Liquid |
| I | 25/75 | 1100 | 2500 | 2.2 | 96 | Liquid |
The most pronounced effect of varying the monomer concentration was seen in the Mw and PDi of the polymers. As the solvent volume was decreased the Mw increased at an elevated rate, hence the onset of gelation occurs prematurely. This forms more highly branched polymers, which are more likely to form a gel network, Fig. 5, with the PDi showing the same trend, Fig. 6.
 | ||
| Fig. 5 Mw data obtained by GPC for polymerisations D–I over 10 h. Homopolymerisations of EGDMA with increasing concentration of solvent. | ||
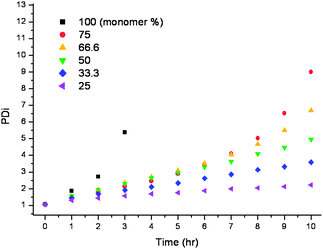 | ||
| Fig. 6 PDi data obtained by GPC for polymerisations D–I over 10 h, homopolymerisations of EGDMA with an increasing concentration of solvent. | ||
The molecular weights of polymers D–I increased rapidly once the conversion exceeded 70%. As the monomer concentration was decreased the polymerisation could be taken to a higher conversion, effectively delaying the rapid molecular weight elevation, Fig. 7.
 | ||
| Fig. 7 Conversion vs. Mw plot for the CCTP for polymerisations D–I of decreasing monomer concentration. | ||
Tailoring the degree of branching by copolymerisation
By variation of the monomer or introduction of comonomers to the CCTP polymerisation the level of branching of the resulting polymers can be controlled. Reduction in the degree of branching was achieved by introduction of the monofunctional monomer, methyl methacrylate (MMA) as a comonomer to the EGDMA polymerisation (J and K). These polymerisations yielded lower molecular weight products with high conversions. In cases of copolymerisations conversions of each monomer could be monitored independently by GC-FID, Fig. 8. Copolymers of trimethylol propane trimethacrylate (TMPTMA) and EGDMA were synthesised (L and M), increasing the degree of branching, and a homopolymer of TMPTMA (N) was synthesised giving a range of branched products with varying degrees of branching. | ||
| Fig. 8 Example of GC-FID conversion data. Polymerisation J: (EGDMA/MMA 80/20 copolymer 0.052 mol % CoBF). | ||
| Name | Monomer | Monomer Ratio (mol %) | Ratio of CoBF to monomer (mol %) | Mn g mol−1 | Mw g mol−1 | PDi | Conversion (%) | Duration (hr) |
|---|---|---|---|---|---|---|---|---|
| J | EGDMA/MMA | 80/20 | 0.052 | 800 | 1800 | 2.2 | 91 | 6 |
| K | EGDMA/MMA | 67/33 | 0.066 | 770 | 1600 | 2.1 | 76 | 6 |
| L | EGDMA/TMPTMA | 80/20 | 0.052 | 730 | 1800 | 2.5 | 76 | 4 |
| M | EGDMA/TMPTMA | 67/33 | 0.066 | 730 | 1600 | 2.2 | 73 | 3 |
| N | TMPTMA | 100 | 0.043 | 1200 | 4500 | 3.7 | 78 | 2 |
MALDI-TOF spectra for copolymers of EGDMA and MMA (J and K) (Fig. S10 and S11, ESI†) show an increasing molecular weight of both EGDMA homopolymers (major peaks) and EGDMA/MMA copolymers initiated by [Co–H]. Again minor peaks were present for polymer chains initiated by primary radicals from the azo initiator. Products with the addition of one HEMA unit (an impurity in the EGDMA monomer) were also observed. MALDI-TOF spectra for copolymers of EGDMA and TMPTMA (Fig. S18, ESI) show peaks denoting the increasing molecular weight of the copolymers and homopolymers of both EGDMA and TMPTMA.
Multidetector GPC analysis of branched products
GPC analysis using both refractive index (RI) and viscometry detectors was used to create Mark-Houwink (MH) plots giving information on the degree of branching by use of the MH equation45,46| M = K[η]α |
MH plots were generated to give a comparison of branched polymers (A–C and J–M) relative to a linear PMMA over the same molecular weight range. The α values, derived from the gradient of these plots (Fig. 9 and 10), were compared to linear polymers to give an indication of the degree of branching, Table 4. As branched polymers possess smaller hydrodynamic volumes than that of their linear counterparts, a marked decrease in the α value is expected when comparing branched and linear polymers over the same molar mass.
 | ||
| Fig. 9 Universal calibration GPC using RI and viscometry detectors to generate MH plots, giving an indication of the degree of branching in A–C and N compared to linear PMMA 1. (A, B and C, EGDMA homopolymers, CoBF concentration = 0.049, 0.039 and 0.029 mol% respectively. NTMPTMA homopolymer, CoBF concentration = 0.043 mol%). | ||
 | ||
| Fig. 10 Universal calibration GPC using RI and viscometry detectors used to generate MH plots, giving an indication of the degree of branching in J–M compared to linear PMMA 2. (J and KEGDMA/MMA copolymers, molar ratio of monomers 80/20, 67/33 respectively, CoBF concentrations 0.052, 0.066 mol% respectively. L and M, EGDMA/TMPTMA copolymers, molar ratio of monomers 80/20, 67/33 respectively, CoBF concentration 0.052, 0.066 mol % respectively). | ||
| α | dn/dc | α | dn/dc | ||
|---|---|---|---|---|---|
| PMMA 1 | 0.53 | 0.057 | PMMA 2 | 0.24 | 0.054 |
| A | 0.35 | 0.046 | J | 0.13 | 0.042 |
| B | 0.27 | 0.046 | K | 0.12 | 0.042 |
| C | 0.21 | 0.048 | L | 0.07 | 0.042 |
| N | 0.17 | 0.053 | M | 0.08 | 0.062 |
Polymers A, B, C and N display depressed α values as compared to linear PMMA of the same molar mass. As N is a trimethacrylate homopolymer this should be the most branched as it has the most vinyl groups per monomer unit from which branching can occur. This trend is confirmed by the decreased value of α throughout these polymers, Fig. 9.
At very low molecular weights the hydrodynamic volumes of a linear polymer and a branched polymer will not be significantly different, hence α values of very low molecular weight polymers compared to their linear counterpart will not show as significant a reduction in α as higher molecular weight branched polymers, as observed in polymers J–M. Polymers J–M show depressed α values compared to linear PMMA, Table 4, Fig. 10. Again, as branching increases the α value decreases, but due to the low molecular weight of polymers J–M the reduction in α is less pronounced when compared to polymers A–C and N.
The radius of gyration is largely responsible for controlling the intrinsic viscosity (IV) and a value of g′ (where g′ is a measure of branching = IV(branched)/IV(linear)) is widely accepted as a qualitative indicator of the degree of chain branching for polymers of equal molar mass.38 The g′ of two linear polymers should yield a constant value of one, as with increasing molecular weight there is no change in the IV between the two polymers. When comparing the IV of branched and linear polymers there is a reduction in the IV of the branched polymer as molecular weight increases, hence a reduction in g′ is observed for increasing molecular weight. Fig. 11 indicates that for polymers A–C and N there is a reduction in g′ as molecular weight increases, confirming branching in these products.
![Universal calibration GPC using RI and viscometry detectors used to generate g′ plots. A further indication of the degree of branching. (A, B and C, EGDMA homopolymers, [CoBF] = 0.049, 0.039 and 0.029 mol% respectively. NTMPTMA homopolymer, CoBF concentration 0.043 mol%).](/image/article/2011/PY/c1py00221j/c1py00221j-f11.gif) | ||
| Fig. 11 Universal calibration GPC using RI and viscometry detectors used to generate g′ plots. A further indication of the degree of branching. (A, B and C, EGDMA homopolymers, [CoBF] = 0.049, 0.039 and 0.029 mol% respectively. NTMPTMA homopolymer, CoBF concentration 0.043 mol%). | ||
A small decrease in g′ is observed for polymers J–M, Fig. 12. Again, this is due to the hydrodynamic volumes of these very low molecular weight products being close to that of their linear counterparts, hence only a small reduction in g′ is observed.
 | ||
| Fig. 12 Universal calibration GPC using RI and viscometry detectors used to generate g′ plots. (J and KEGDMA/MMA copolymers, molar ratio of monomers 80/20, 67/33 respectively, CoBF concentrations 0.052, 0.066 mol% respectively. L and M, EGDMA/TMPTMA copolymers, molar ratio of monomers 80/20, 67/33 respectively, CoBF concentration 0.052 and 0.066 mol % respectively). | ||
Functionalisation of PEGDMA (A) via thio-Michael addition
Functionalisation of the branched PEGDMA homopolymer was investigated using phosphine mediated thio-Michael addition, Scheme 3.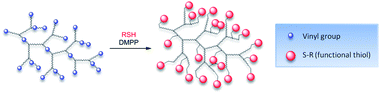 | ||
| Scheme 3 General thio-Michael addition reaction scheme for a branched vinyl terminated polymer with a functional thiol. | ||
A 1.5 double bond equivalent amount of thiol was added to the end solution of the PEGDMA polymerisation, no workup or purification was necessary. Firstly, the thiol-ene click reaction of A with benzyl mercaptan was attempted to form A1, Table 5. Upon addition of 0.2 mol equivalents to monomer of dimethylphenylphosphine (DMPP), there was a colour change of the solution from yellow to dark green, and an exothermic reaction proceeded. The reaction was monitored by 1H NMR. A rapid decrease in the vinyl region of the polymer was observed, these peaks are no longer visible by NMR after one hour (see full spectra in ESI), and additional peaks at δ 2.4–2.8 appeared, indicating the formation of the –CH2SCH2– group.
| Name | Thiol | Amount of Thiol (Double bond eq.) | Amount of DMPP (mol eq.) |
|---|---|---|---|
| A1 | Benzyl mercaptan | 1.5 | 0.2 |
| A2 | Benzyl mercaptan | 1.5 | 0.1 |
| A3 | Benzyl mercaptan | 1.5 | 0.05 |
| A4 | Mercaptoethanol | 1 | 0.1 |
| A5 | Thioglycerol | 1 | 0.1 |
| A6 | Dodecanethiol | 1 | 0.1 |
The benzyl group functionality of the thiol allowed the reaction to be monitored by GPC using photodiode array (PDA) detection. The PDA GPC spectrum of PEGDMA pre-fuctionalisation shows very little UV response for the polymer. Peaks are observed at 270 nm between 18 and 22 min retention time for topanol (to inhibit crosslinking), anisole (residual internal standard), and peaks are observed at 400 nm between 17 and 19 min retention time, which corresponds to monomer and dimer in the visible range, which is most likely due to the CoBF being highly coloured. Fig. 13.
 | ||
| Fig. 13 Top trace: Full PDA GPC spectra of unfunctionalised PEGDMA from 250–500 nm. Bottom left: Red GPC trace is extracted from PDA data displaying characterised peaks observed at 270 nm. Bottom right: Green trace is extracted from PDA data displaying characterised peaks observed at 400 nm. | ||
Post functionalisation a large response is observed in the PDA GPC at 270 nm between 14 and 18 min retention time, indicating the addition of benzyl mercaptan to the polymer. Other peaks can be characterised as DMPP, anisole, free benzyl mercaptan and topanol all observed at 270 nm between 18 and 24 min retention time, Fig. 14.
 | ||
| Fig. 14 Top trace: Full PDA GPC spectra of PEGDMA functionalised with benzyl mercaptan from 240–320 nm. Bottom left: Side on view of above. Bottom Right: Green trace is extracted from PDA data displaying characterised peaks observed at 270 nm. | ||
MALDI-TOF spectra was also investigated to further confirm the addition of benzyl mercaptan to the polymer, Fig. 15. A series of peaks with 322 Da separation was observed, corresponding to increasing molecular weight PEGDMA, with an increasing number of benzyl mercaptan units conjugated to the polymer.
 | ||
| Fig. 15 MALDI-TOF spectra of A1 (benzyl mercaptan functionalised EGDMA homopolymer, CoBF concentration 0.049mol%, 1.5 double bond eq. benzyl mercaptan, 0.2 mol eq. DMPP). | ||
The major peaks correspond to fully saturated PEGDMA, where one vinyl group is functionalised with a phosphine adduct and the remaining double bonds functionalised with benzyl mercaptan. The second largest series of peaks corresponds to a fully functionalised polymer where a single HEMA unit has been incorporated into the polymer, as seen in the original unfunctionalised polymer spectra. Other peaks include azo initiator functionalised polymer and unsaturated functionalised polymer.
Optimisation of the thio-Michael addition for this reaction was carried out. Using 0.2 mol equivalents of DMPP with respect to monomer, the reaction proceeds at a rapid rate and is complete within one hour. Reactions with lower amounts of DMPP, 0.1 (A2) and 0.05 (A3) mol equivalents with respect to monomer showed the expected decrease in rate by 1H NMR as the amount of phosphine catalyst was decreased. Using 0.1 mol equivalents of catalyst the reaction was complete within two hours. Using 0.05 mol equivalents the reaction was complete within four hours. All subsequent reactions were carried out using 0.1 mol equivalents of catalyst.
The amount of thiol used was also investigated. An excess of 1.5 mol equivalents of thiol with respect to vinyl bonds was used originally. To decrease this excess the thiol was added in portions to the reaction until complete removal of the vinyl bond signal was seen by 1H NMR, Fig. 16.
 | ||
| Fig. 16 1H NMR monitoring of thio-Michael addition. Gradual thiol addition to A (EGDMA homopolymer, 0.049 mol % CoBF) over time until full functionalisation achieved. | ||
A 1![[thin space (1/6-em)]](https://www.rsc.org/images/entities/char_2009.gif) :1 double bond equivalent of thiol to vinyl bond achieved full functionalisation. The thiol functionality was varied to determine the versatility of the thio-Michael addition, creating a range of branched polymers with an array of terminal functionalities. Due to the number of commercial thiols available, the scope for the thio-Michael addition is large, especially when considering the number of biological applications in which this technique could be utilised. Mercaptoethanol (A4), thioglycerol (A5) and dodecanethiol (A6) were reacted with PEGDMAvia the thio-Michael addition. 1H NMR, 13C NMR and MALDI-TOF confirmed the successful addition of all thiols (see ESI).
:1 double bond equivalent of thiol to vinyl bond achieved full functionalisation. The thiol functionality was varied to determine the versatility of the thio-Michael addition, creating a range of branched polymers with an array of terminal functionalities. Due to the number of commercial thiols available, the scope for the thio-Michael addition is large, especially when considering the number of biological applications in which this technique could be utilised. Mercaptoethanol (A4), thioglycerol (A5) and dodecanethiol (A6) were reacted with PEGDMAvia the thio-Michael addition. 1H NMR, 13C NMR and MALDI-TOF confirmed the successful addition of all thiols (see ESI).
Conclusions
CCTP is a facile route for the synthesis of branched polymers using commercially available monomers, validating the work reported by Guan. Branching can be controlled by choice of monomer; divinyl monomers produce less branched structures than use of a trivinyl monomer, for example. Synthesis of copolymers can be used to control branching by introduction of a branch terminating point, such as a mono-vinyl monomer or by introduction of a multi-vinyl monomer to increase branching. Molecular weight can also be controlled by increasing or reducing CoBF levels or increasing/reducing monomer concentration. The resulting branched polymers were then functionalised using phosphine mediated thiol-ene click chemistry yielding branched polymers with an array of peripheral functionalities. The range of commercially available thiols is large; therefore the scope for further functionalisation of these polymers is great; hence providing a convenient method for tailoring the properties of these materials.Acknowledgements
The authors thank EPSRC and Agilent (Polymer Laboratories) (KM) for funding. Equipment used in this research was partly obtained, through Birmingham Science City: Innovative Uses for Advanced Materials in the Modern World (West Midlands Centre for Advanced Materials Project 2), with support from Advantage West Midlands (AWM) and part funded by the European Regional Development Fund (ERDF).Notes and references
- R. M. England and S. Rimmer, Polym. Chem., 2010, 1(10), 1533 RSC.
- B. I. Voit and A. Lederer, Chem. Rev., 2009, 109(11), 5924 CrossRef CAS.
- A. A. Gridnev, J. Polym. Sci., Part A: Polym. Chem., 2000, 38(10), 1753 CrossRef CAS.
- J. P. A. Heuts, G. E. Roberts and J. D. Biasutti, Aust. J. Chem., 2002, 55(7), 381 CrossRef CAS.
- A. H. Soeriyadi, C. Boyer, J. Burns, C. R. Becer, M. R. Whittaker, D. M. Haddleton and T. P. Davis, Chem. Commun., 2010, 46(34), 6338 RSC.
- W. Wang, Y. Zheng, E. Roberts, C. J. Duxbury, L. Ding, D. J. Irvine and S. M. Howdle, Macromolecules, 2007, 40(20), 7184 CrossRef CAS.
- R. M. England and S. Rimmer, Chem. Commun., 2010, 46(31), 5767 RSC.
- N. S. Enikolopyan, B. R. Smirnov, G. V. Ponomarev and I. M. Belgovskii, J. Polym. Sci., Polym. Chem. Ed., 1981, 19(4), 879 Search PubMed.
- D. M. Haddleton, E. Depaquis, E. J. Kelly, D. Kukulj, S. R. Morsley, S. A. F. Bon, M. D. Eason and A. G. Steward, J. Polym. Sci., Part A: Polym. Chem., 2001, 39(14), 2378 CrossRef CAS.
- D. M. Haddleton, D. R. Maloney and K. G. Suddaby, Macromolecules, 1996, 29(1), 481 CrossRef CAS.
- T. Y. J. Chiu, J. P. A. Heuts, T. P. Davis, M. H. Stenzel and C. Barner-Kowollik, Macromol. Chem. Phys., 2004, 205(6), 752 CrossRef CAS.
- D. M. Haddleton, D. R. Maloney, K. G. Suddaby, A. Clarke and S. N. Richards, Polymer, 1997, 38(25), 6207 CrossRef CAS.
- D. M. Haddleton, D. R. Maloney, K. G. Suddaby, A. V. G. Muir and S. N. Richards, Macromol. Symp., 1996, 111, 37 CAS.
- D. M. Haddleton, D. Kukulj, T. P. Davis and D. R. Maloney, Trends in Polym. Sci., 1995, 3, 365 CAS.
- L. Nurmi, J. Lindqvist, R. Randev, J. Syrett and D. M. Haddleton, Chem. Commun., 2009,(19), 2727 RSC.
- A. A. Gridnev and S. D. Ittel, Chem. Rev., 2001, 101(12), 3611 CrossRef CAS.
- D. Kukulj, J. P. A. Heuts and T. P. Davis, Macromolecules, 1998, 31(18), 6034 CrossRef CAS.
- B. Pierik, D. Masclee and A.v. Herk, Macromol. Symp., 2001, 165(1), 19 CrossRef.
- J. Huybrechts, P. Bruylants, A. Vaes and A. De Marre, Prog. Org. Coat., 2000, 38(2), 67 Search PubMed.
- K. Adamsons, G. Blackman, B. Gregorovich, L. Lin and R. Matheson, Prog. Org. Coat., 1997, 34(1–4), 64 Search PubMed.
- Z. Guan, J. Am. Chem. Soc., 2002, 124, 5616 CrossRef CAS.
- M. W. Jones, G. Mantovani, S. M. Ryan, X. Wang, D. J. Brayden and D. M. Haddleton, Chem. Commun., 2009,(35), 5272 RSC.
- H. C. Kolb, M. G. Finn and K. B. Sharpless, Angew. Chem., Int. Ed., 2001, 40(11), 2004 CrossRef CAS.
- C. R. Becer, R. Hoogenboom and U. S. Schubert, Angew. Chem., Int. Ed., 2009, 48(27), 4900 CrossRef CAS.
- A. Gress, A. Völkel and H. Schlaad, Macromolecules, 2007, 40(22), 7928 CrossRef CAS.
- N. ten Brummelhuis, C. Diehl and H. Schlaad, Macromolecules, 2008, 41(24), 9946 CrossRef.
- M. Uygun, M. A. Tasdelen and Y. Yagci, Macromol. Chem. Phys., 2010, 211(1), 103 CrossRef CAS.
- H. Durmaz, A. Dag, D. Gursoy, A. L. Demirel, G. Hizal and U. Tunca, J. Polym. Sci., Part A: Polym. Chem., 2010, 48(7), 1557 CrossRef CAS.
- A. A. Kavitha and N. K. Singha, ACS Appl. Mater. Interfaces, 2009, 1(7), 1427 CrossRef CAS.
- C. E. Hoyle and C. N. Bowman, Angew. Chem., Int. Ed., 2010, 49(9), 1540 CrossRef CAS.
- B. D. Mather, K. Viswanathan, K. M. Miller and T. E. Long, Prog. Polym. Sci., 2006, 31(5), 487 CrossRef CAS.
- A. Michael, J. Prakt. Chem., 1887, 35(1), 349 Search PubMed.
- C. Gimbert, M. Lumbierres, C. Marchi, M. Moreno-Mañas, R. M. Sebastián and A. Vallribera, Tetrahedron, 2005, 61(36), 8598 CrossRef.
- J. W. Chan, C. E. Hoyle and A. B. Lowe, J. Am. Chem. Soc., 2009, 131(16), 5751 CrossRef CAS.
- J. W. Chan, B. Yu, C. E. Hoyle and A. B. Lowe, Chem. Commun., 2008,(40), 4959 RSC.
- P. Besenius, S. Slavin, F. Vilela and D. C. Sherrington, React. Funct. Polym., 2008, 68(11), 1524 Search PubMed.
- S. Camerlynck, P. A. G. Cormack, D. C. Sherrington and G. Saunders, J. Macromol. Sci., Part B: Phys., 2005, 44(6), 881 Search PubMed.
- G. Saunders, P. A. G. Cormack, S. Graham and D. C. Sherrington, Macromolecules, 2005, 38(15), 6418 Search PubMed.
- F. Isaure, P. A. G. Cormack and D. C. Sherrington, J. Mater. Chem., 2003, 13(11), 2701 RSC.
- S. Graham, P. A. G. Cormack and D. C. Sherrington, Macromolecules, 2004, 38(1), 86 Search PubMed.
- A. T. Slark, D. C. Sherrington, A. Titterton and I. K. Martin, J. Mater. Chem., 2003, 13(11), 2711 RSC.
- N. O'Brien, A. McKee, D. C. Sherrington, A. T. Slark and A. Titterton, Polymer, 2000, 41(15), 6027 CrossRef CAS.
- M. W. F. Nielen and S. Malucha, Rapid Commun. Mass Spectrom., 1997, 11(11), 1194 Search PubMed.
- D. C. Schriemer and L. Li, Anal. Chem., 1997, 69(20), 4176 CrossRef.
- Z. Grubisic, P. Rempp and H. Benoit, J. Polym. Sci., Part B: Polym. Lett., 1967, 5(9), 753 Search PubMed.
- T. Gruendling, T. Junkers, M. Guilhaus and C. Barner-Kowollik, Macromol. Chem. Phys., 2010, 211(5), 520 Search PubMed.
Footnote |
| † Electronic Supplementary Information (ESI) available. See DOI: 10.1039/c1py00221j/ |
| This journal is © The Royal Society of Chemistry 2011 |