Temperature and pH responsive hybrid nanoclay grafted with PDMAEMA†
Jukka
Niskanen
a,
Mikko
Karesoja
b,
Teemu
Rossi
c and
Heikki
Tenhu
*d
aLaboratory of Polymer chemistry, Department of Chemistry, University of Helsinki, P.O. Box 55, 00014, Helsinki, Finland. E-mail: jukka.niskanen@helsinki.fi
bLaboratory of Polymer chemistry, Department of Chemistry, University of Helsinki, P.O. Box 55, 00014, Helsinki, Finland. E-mail: mikko.karesoja@helsinki.fi
cLaboratory of Polymer chemistry, Department of Chemistry, University of Helsinki, P.O. Box 55, 00014, Helsinki, Finland. E-mail: teemu.rossi@helsinki.fi
dLaboratory of Polymer chemistry, Department of Chemistry, University of Helsinki, P.O. Box 55, 00014, Helsinki, Finland. E-mail: heikki.tenhu@helsinki.fi; Fax: +358 9 1915 0330; Tel: +358 9 1915 0335
First published on 29th June 2011
Abstract
Recent advances in grafting from techniques have made it possible to produce hybrid materials from montmorillonite clay by covalently grafting polymers to the surface of montmorillonite particles. In this article the temperature and pH responsiveness of a hybrid material consisting of poly(dimethylaminoethyl methacrylate) (PDMAEMA) grafted clay is investigated by differential scanning calorimetry, pressure perturbation calorimetry and fluorescence spectroscopy. The phase transition is affected not only by the pH of the aqueous medium, but also by the electrostatic interactions between the positively charged polymer and negatively charged clay particles.
Introduction
Hybrid materials have gained a lot of attention in recent years. Especially the recent advances in the controlled polymerisation techniques, such as ATRP (atom transfer radical polymerization), RAFT (reversible addition-fragmentation chain transfer) and NMP (nitroxide-mediated polymerisation), have opened the way for constructing new and interesting materials where inorganic and organic materials are combined.1 Organic polymers may be grafted to various inorganic materials such as silica and metal nanoparticles1 or substances like montmorillonite clay.2Polymers can be grafted to surfaces using either ‘grafting to’ or ‘grafting from’ techniques. In ‘grafting to’ the polymers are prepared separately and then attached to the surface to be grafted. In ‘grafting from’ a suitable initiator for polymerization is attached to a surface and the polymer chains are grown from these groups.1Previously we have successfully used poly(N-isopropyl acrylamide) (PNIPAM) to prepare polymer grafted gold nanoparticles3–5 as well as a block-co-polymer (poly(acrylic acid)-block-poly(butyl acrylate-methyl methacrylate)) to stabilise silver nanoparticles6 by utilising a ‘grafting to’ technique. Hybrid materials that can be dispersed in aqueous media display several interesting properties. Shan et al. have shown that the thermal transition properties of PNIPAM in water change when the polymer is grafted to the surface of a gold nanoparticle.3–5 For PNIPAM grated to gold nanoparticles, two phase transitions were observed whereas free PNIPAM chains in aqueous solutions only show one transition.5 Clearly the immobilisation of one end of the polymer chain affects its thermal properties. Often, the immobilisation of PNIPAM considerably broadens the temperature range of the chain collapse.7 In the case of the gold nanoparticle,5 the existence of two transitions was rationalised by assuming that the PNIPAM shell can be divided into two layers. In the layer being close to the nanoparticle surface the polymer chains are stretched and packed close to each other. In the outer region of the polymer corona the polymers are further apart and have more motional freedom. Thus the polymer concentration and the hydration of the polymer chains are different in these layers and two different phase transitions could be oserved.5
Montmorillonite has been used in various applications primarily by blending it with different polymers.2 Covalent grafting with polymers, however, is a new advancement in this field. Since the clay is a negatively charged pack of cards consisting of silicate sheets, the first logical step was to intercalate a positively charged initiator for ATRP polymerisation between the layers.2 Covalent attachment of initiators has also been recently developed. ATRP initiators can be covalently attached e.g. with a chlorosilane group bearing the initiators8,9 or with amino bearing trimethoxysilanes, to which the initiator is later attached.10,11
The ‘grafting from’ technique has previously been used to prepare a nanocomposite material of montmorillonite in a poly(butyl acrylate-methyl methacrylate) matrix. Grafts with the same chemical composition as that of the matrix polymer were grown from a covalently attached ATRP-initiator on the clay surface. The polymer grafts exfoliated the clay and made it well compatible with the polymer matrix. In this way a homogeneous nanocomposite material could be obtained.8
Hybrid materials partially constructed of environmentally responsive polymers are challenging and interesting ones. Thermoresponsive polymers like PNIPAM and poly(vinyl caprolactam) (PVCL) have been studied to a great extent as free homo- and block copolymers in aqueous solutions and as components in hybrid materials.4,5,12–15 Poly(dimethylaminoethyl methacrylate) (PDMAEMA) is a weak poly base which is both pH and temperature responsive.16 Properties of PDMAEMA grafted to clay are interesting since in water the polymer carries a positive charge owing to the protonation of the amine group. Thus it may be assumed that PDMAEMA interacts with the negatively charged clay, the strength of interaction depending on the degree of protonation (Scheme 1).
 | ||
| Scheme 1 Structure of poly(dimethylaminoethyl methacrylate) (PDMAEMA). | ||
Solution properties of PDMAEMA depend on pH, temperature and the molar mass.16 The cloud point temperature changes upon the degree of protonation of the amine groups of the polymer (pKa = 7.417). Plamper et al. have studied PDMAEMA and its cloud point vs. pH for both linear and star polymers. In the pH range 7–10 the cloud point varied between 79 and 26 °C and disappeared when pH was below 7.16 The cloud point was shown to be dependent on the molecular mass especially below 200![[thin space (1/6-em)]](https://www.rsc.org/images/entities/char_2009.gif) 000 g mol−1 and it increases with lowering the molar mass, the change being most prominent within a pH range 8–10.16
000 g mol−1 and it increases with lowering the molar mass, the change being most prominent within a pH range 8–10.16
In this work we have studied the properties of aqueous solutions of PDMAEMAs with two different molar masses (51![[thin space (1/6-em)]](https://www.rsc.org/images/entities/char_2009.gif) 000 and 282
000 and 282![[thin space (1/6-em)]](https://www.rsc.org/images/entities/char_2009.gif) 000 g mol−1). The results are compared with PDMAEMA chains (51
000 g mol−1). The results are compared with PDMAEMA chains (51![[thin space (1/6-em)]](https://www.rsc.org/images/entities/char_2009.gif) 000 and 232
000 and 232![[thin space (1/6-em)]](https://www.rsc.org/images/entities/char_2009.gif) 000 g mol−1) that have been grafted to clay particles with the ‘grafting from’ technique. The colloidal stability of the obtained hybrid nanoparticles is affected by the pH of the solution as well as by the length of the polymer graft. Thermoresponsive properties of PDMAEMA are examined for aqueous solutions and dispersions with different pH values.
000 g mol−1) that have been grafted to clay particles with the ‘grafting from’ technique. The colloidal stability of the obtained hybrid nanoparticles is affected by the pH of the solution as well as by the length of the polymer graft. Thermoresponsive properties of PDMAEMA are examined for aqueous solutions and dispersions with different pH values.
The phase transition of PDMAEMA has been studied using fluorescence spectroscopy. In this, a fluorescent probe 1,8-ANS (8-anilino-1-naphthalenesulfonic acid) has been utilised. 1,8-ANS is an extremely useful classical probe, the fluorescence emission of which in water is negligible. When bound to a polymer or in a hydrophobic environment, its emission intensity increases several orders of magnitude.19 Thus in the case of PDMAEMA, by following the emission intensity as a function of temperature one should easily observe if the sulfonic acid containing probe is attached to the polymer or not. The emission maximum is also known to be very sensitive to the polarity of the surroundings. As will be shown, considerable changes in the fluorescence intensity were observed with increasing temperature and in certain cases the emission maxima changed.
Fluorescence anisotropy reveals information about the mobility of the fluorescent probe in a polymer solution. An increase of the rate of molecular tumbling leads to a decrease in the anisotropy and vice versa.
A complementary view on the phase transitions of polymers in solutions or dispersions has been obtained with micro differential scanning calorimetry (microDSC) and pressure perturbation calorimetry (PPC). Of thermoresponsive polymers, the phase transitions of e.g. poly(N-isopropyl acrylamide) (PNIPAM), poly(vinyl caprolactam) (PVCL), and poly(2-isopropyl-2-oxazoline) have been previously studied with these techniques.12,13 While microDSC gives information on the enthalpic and entropic changes involved in a phase transition, pressure perturbation calorimetry reveals the changes in the hydration layer of the polymer during the transition.12,13,18 In a PPC experiment, the sample and a reference are subjected to sudden changes in pressure (∼500 kPa). The change in pressure causes a change in the heat of the solution which the calorimeter compensates for. This way the change in heat caused by a sudden drop and increase in pressure at a given temperature can be determined. From this data the thermal expansion coefficient (α) of the partial volume of the polymer can be calculated. Further by integrating a plot of α vs. temperature, the relative volume change of the hydrated/dehydrated polymer (ΔV/V) can be obtained.18
The purpose of this report is to show that linking PDMAEMA to clay particles has a significant effect on the phase transition of the partially charged polymer chains. The effect is not only due to the motional restriction by the covalent bond between the particle and the polymer.
Frielinghaus et al. have shown by neutron scattering that poly(ethylene oxide) adsorbed to clay has mobile and immobile sections.19 This should also be the case with PDMAEMA grafted to clay. The polymer is covalently attached to the clay platelets and in addition some parts of the chains are adsorbed to the solid surfaces. The length of the chain is critical, since shorter chains might adsorb almost completely to the clay surface whereas longer chains have motionally free segments.
Cui and van Duijneveldt have shown that in polyetheramines (poly(ethylene oxide) or poly(propylene oxide) chains with amine groups at the chain ends) the primary amines can adsorb to clay by ion exchange mechanism. This occurs even at pH that is higher than the pH required for the protonation of the amine groups.20 In the case of PDMAEMA there are no primary amines but only tertiary ones and thus it is reasonable to assume that the polymer adsorbs to the clay surface mainly via the groups that are protonated.
Experimental
Materials
Dimethylaminoethylmethacrylate (DMAEMA, Acros Organics) was passed through a basic alumina column to remove inhibitor. Tetrahydrofuran (THF, Lab-Scan) was distilled over sodium and benzoquinone to remove water. N,N,N′,N′,N-pentamethyldiethylenetriamine (PMDETA, Aldrich, 99%) was distilled prior use.Buffer solutions with pH 7 and pH 8 were from Fluka and that with pH 9 from Merck and they were used as received.
3-Aminopropyltrimethoxysilane (Aldrich, 97%), 8-anilino-1-naphthalenesulfonic acid ammonium salt (Sigma, >97%), 2-bromoisobutyryl bromide (Aldrich, 98%), Cu(I)Br (Aldrich, 99![[thin space (1/6-em)]](https://www.rsc.org/images/entities/char_2009.gif) 999%), Cu(I)Cl (Merck, 98%), copper flakes (Cu0), DMF (Lab-Scan), ethanol (Altia, 99.5%), hydrofluoric acid (HF, Fluka, 40%) and triethylamine (TEA, Fluka, 98%) were used as received.
999%), Cu(I)Cl (Merck, 98%), copper flakes (Cu0), DMF (Lab-Scan), ethanol (Altia, 99.5%), hydrofluoric acid (HF, Fluka, 40%) and triethylamine (TEA, Fluka, 98%) were used as received.
Montmorillonite clay (Nanofil 116) was obtained from Rockwood Clay additives GmbH. The clay was dried by dispersing it in ethanol and evaporating the liquid phase in vacuo. The size distribution for the clay particles was determined by light scattering from a dispersion in deionized water after 5 minutes sonication. The mean hydrodynamic diameter for the pure unmodified clay particles is ∼400 nm (see ESI†).
The reaction of aminosilane with clay
In a typical reaction, 18 g of clay was dispersed in 200 ml of freshly distilled THF. The aminosilane (20 ml) was then added to the dispersion and the mixture was left overnight. The next day the clay was filtered and washed with methanol and THF repeatedly.9–11 Finally the clay was dried in vacuo and the yield was 20.4 g. Analysis of the silane modified clay was performed by IR spectroscopy and thermogravimetric analysis (TGA). No peaks corresponding to the aminosilane could be observed in the IR spectra. The TGA however shows a mass loss of 10% in the temperature range 150–700 °C.Attachment of the ATRP-initiator
13 g of clay reacted with silane was dispersed in 200 ml of dry THF. Into the dispersion, 15 ml triethylamine was added and the flask placed on ice. Next, 15 ml 2-bromoisobutyryl bromide was added slowly in small quantities into the dispersion. The reaction was left to stir for 72 hours. Then the clay was filtered and washed repeatedly with water, THF and methanol. Finally the initiator–clay was dried in vacuo. The yield was 12.6 g. To verify the attachment of the initiator, a sample of the clay was subjected to Soxhlet extraction with THF for 5 days. IR spectra of the purified initiator–clay show two peaks from carbonyl groups at 1643 and 1533 cm−1. TGA of the final product shows a 17% decrease in mass within a temperature range 150–600 °C. The attachment of the ATRP-initiator to the clay particles is described in Scheme 2.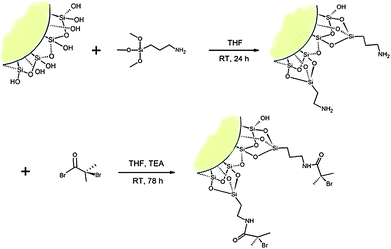 | ||
| Scheme 2 Schematic illustration of the attachment of an ATRP-initiator on the edge of a clay platelet. | ||
Polymerisation of DMAEMA
The initiator–clay was dispersed in DMF. The monomer, Cu0 and Cu(I)Cl were added in the dispersion. The flask was sealed with a rubber septum and the reaction mixture was purged with nitrogen gas for 60 min. After this the flask was lowered into an oil bath at 80 °C. After 10 minutes of temperature stabilization the ligand PMDETA was added through the septum and then the nitrogen flow was removed. The polymerization was left overnight (∼17 h). The reaction was stopped by opening the septum and by immediately precipitating the polymer in water at 60–80 °C. The product was dissolved in a small amount of DMF and placed in a dialysis tubing which was transferred in water. Further details of the polymerizations are presented in Table 1.| Nr. | Init. Clay/g | DMAEMA/ml | DMF/ml | Cu(0)/mmol | Cu(I)X/mmol | PMDETA/mmol |
|---|---|---|---|---|---|---|
| 1 | 2.01 | 125.0 | 50 | 0.27 | 1.27, Cu(I)Cl | 1.29 |
| 2 | 2.00 | 75.0 | 75 | 0.2 | 1.27, Cu(I)Cl | 1.29 |
| 3 | 4.76 | 35.0 | 150 | 0.39 | 0.91, Cu(I)Br | 0.86 |
1H nuclear magnetic resonance (NMR; polymerization 1, 200 MHz, CDCl3, TMS, δ ppm): 4.04 (O–CH2–); 2.56 (N–CH2–); 2.28 (N–CH3); 1.80 (–CH2–); 1.06 (C–CH3); 0.90 (–CH2–).
Detachment of polymer chains from clay
For the determination of the molar mass by SEC, the polymer chains were detached from the clay using HF. In a typical reaction ∼1 g of clay grafted with polymer was dispersed in 20 ml THF in a Teflon tube. Then 5 ml of 40% HF was added to the dispersion and the reaction was left overnight. The obtained PDMAEMA solutions were first neutralized with CaCO3 and then further purified by dialysis against water. Finally the polymer was freeze-dried. Free polymers were obtained from polymerizations nr 1 and 3 by this method. Results from SEC are presented in Table 2. NMR spectra of the polymer before and after detachment confirm that the polymers do not degrade during this treatment. (Spectra are presented in ESI†.) Van de Wetering et al. have studied the hydrolysis behavior of PDMAEMA and shown that PDMAEMA is stable and does not hydrolyze under acidic conditions (80 °C, pH 0.5–7).17| Polymer | M n | PDI | m % clay |
|---|---|---|---|
| 1 | 282![[thin space (1/6-em)]](https://www.rsc.org/images/entities/char_2009.gif) 000 000 |
1.4 | 6.9 |
| 2 | 232![[thin space (1/6-em)]](https://www.rsc.org/images/entities/char_2009.gif) 000 000 |
1.6 | 5.5 |
| 3 | 51![[thin space (1/6-em)]](https://www.rsc.org/images/entities/char_2009.gif) 000 000 |
1.6 | 44.0 |
1H nuclear magnetic resonance (NMR; (PDMAEMA, 282![[thin space (1/6-em)]](https://www.rsc.org/images/entities/char_2009.gif) 000 g mol−1), 200 MHz, CDCl3, TMS, δ ppm): 4.07 (O–CH2–); 2.58 (N–CH2–); 2.28 (N–CH3); 1.87 (–CH2–); 1.80 (–CH2–); 1.44 (–CH2–); 1.04 (C–CH3); 0.89 (–CH2–).
000 g mol−1), 200 MHz, CDCl3, TMS, δ ppm): 4.07 (O–CH2–); 2.58 (N–CH2–); 2.28 (N–CH3); 1.87 (–CH2–); 1.80 (–CH2–); 1.44 (–CH2–); 1.04 (C–CH3); 0.89 (–CH2–).
Instrumentation and characterisation
The NMR instrument used was a 200 MHz Varian Gemini 2000 NMR-spectrometer. Sample concentrations were 20–40 mg ml−1 in deuterated chloroform (Euriso-top). Tetramethylsilane was the reference in all measurements.Size exclusion chromatography (SEC) was used to determine the molar masses of the polymers. PMMA standards from PSS Polymer Standards Service GmbH were used for calibration. Eluent was either THF or DMF/LiBr (1 mg ml−1). The apparatus included the following instruments: Biotech model 2003 degasser, Waters 515 HPLC pump, Waters 717plus auto sampler, Viscotek 270 dual detector, Waters 2487 dual λ absorbance detector, Waters 2410 refractive index detector and the Omnisec™ software from Viscotek. Styragel HR 1, 2 and 4 columns and a flow rate of 0.8 ml min−1 were used in the measurements.
Calorimetric analyses of the polymers were conducted with a MicroCal VP DSC Microcalorimeter, equipped with a Pressure Perturbation accessory. Solutions and dispersions were made in three buffers with pH 7, 8 and 9 and stored at 7 °C. Since PDMAEMA is a poly base the pH of the solutions and dispersions was somewhat higher than that of the original buffer solution, i.e. 7.8, 8.3 and 9.3. All solutions and dispersions were 5 mg ml−1 and degassed before measurement. The samples with pure polymers were filtered through membranes with pore size 0.45 μm. The samples were run from 5 to 90 °C with 60 °C h−1, repeating the heating–cooling cycle three times. The pre-equilibration time was 120 min before each heating cycle. The polymer concentrations were corrected by subtracting the amount of clay in the samples. The measured enthalpy values will be given per repeating DMAEMA unit. Polymer concentrations for the measured samples are presented in Table 3.
| Free PDMAEMA | Heating | Cooling | T max/°C | ΔV/V (%) | ||
|---|---|---|---|---|---|---|
| M n/g mol−1 | C a/mM | pH | ΔH/kJ mol−1 | ΔH/kJ mol−1 | ||
| a Polymer concentration. | ||||||
282![[thin space (1/6-em)]](https://www.rsc.org/images/entities/char_2009.gif) 000 000 |
31.80 | 7.8 | 11.05 | 10.28 | 77.9 | 2.80 |
282![[thin space (1/6-em)]](https://www.rsc.org/images/entities/char_2009.gif) 000 000 |
33.08 | 8.3 | 2.89 | 3.19 | 52.0 | 0.20 |
282![[thin space (1/6-em)]](https://www.rsc.org/images/entities/char_2009.gif) 000 000 |
33.08 | 9.3 | 1.84 | 1.75 | 32.5 | 0.03 |
51![[thin space (1/6-em)]](https://www.rsc.org/images/entities/char_2009.gif) 000 000 |
31.40 | 7.8 | 6.35 | 7.15 | 76.2 | 3.30 |
| Clay grafted with PDMAEMA | ||||||
232![[thin space (1/6-em)]](https://www.rsc.org/images/entities/char_2009.gif) 000 000 |
31.23 | 7.8 | 8.89 | 9.66 | 75.8 | 3.60 |
232![[thin space (1/6-em)]](https://www.rsc.org/images/entities/char_2009.gif) 000 000 |
30.09 | 8.3 | 3.97 | 4.36 | 52.9 | 0.20 |
232![[thin space (1/6-em)]](https://www.rsc.org/images/entities/char_2009.gif) 000 000 |
30.98 | 9.3 | 1.92 | 1.86 | 32.8 | 0.08 |
51![[thin space (1/6-em)]](https://www.rsc.org/images/entities/char_2009.gif) 000 000 |
16.54 | 7.3 | 8.56 | 9.51 | 76.7 | 2.90 |
PPC measurements were conducted at 5–90 °C (pH 8.3 and 9.3) or at 5–97 °C (pH 7.8) with 15 min equilibrating time before the run and 2 min equilibration time at each temperature point. The pulse time was set to 80 s to give the system enough time to stabilize after the pressure drop before the increase of pressure. For these calculations the specific volume of the solute (in this case the polymer) needs to be known. Zana et al. have shown that the partial specific volumes ![[V with combining macron]](https://www.rsc.org/images/entities/i_char_0056_0304.gif) of polymers can be estimated by group contribution theory within an accuracy of 2%. In their paper the value of
of polymers can be estimated by group contribution theory within an accuracy of 2%. In their paper the value of ![[V with combining macron]](https://www.rsc.org/images/entities/i_char_0056_0304.gif) for PDMAEMA is reported as 0.854 ml g−1.21 From the data obtained, the thermal expansion coefficient (α) of the partial volume of the polymer can be calculated using eqn (1).
for PDMAEMA is reported as 0.854 ml g−1.21 From the data obtained, the thermal expansion coefficient (α) of the partial volume of the polymer can be calculated using eqn (1).
 | (1) |
From both microDSC and PPC measurement sets the second runs were used for analysis.
The IR spectra were measured with a Perkin-Elmer Spectrum One spectrometer.
Thermogravimetric analyses were performed with a Mettler Toledo 850. 70 μl Al2O3 crucibles were used and the samples were heated from 25 to 700 °C (10 °C min−1) under nitrogen atmosphere. In the analysis water evaporation was observed as the first step between 25 and 150 °C. The second step from 150 to 700 °C was considered to originate from organic material bound to the clay. It needs to be noted that when we discuss the clay content of various samples, the water content has always been taken into account, i.e. we refer to the mass of dry clay. Thermograms are presented in ESI†.
Fluorescence studies were conducted with a Horiba Jobin Yvon Fluoromax-4 spectrofluorometer, using FluorEssence™ software. For the fluorescent studies a 0.01 M stock solution of the probe 8-anilino-1-naphthalenesulfonic acid ammonium salt (1,8-ANS) in water was prepared. 20 μl of this solution was added to 3 ml of 1 mg ml−1polymer solutions or polymer grafted clay dispersions. The fluorescence spectra as a function of temperature were recorded at 20–60 °C (pH 9.3), 20–80 °C (pH 8.3) and 60–95 °C (pH 7.8) with 5 °C steps. Before measurement the samples were equilibrated 30 min at the starting temperature and then 15 minutes at each of the measured temperature point. Excitation wavelength was 375 nm and emission was observed between 400 and 700 nm. Slits were 3 nm for excitation and 1 nm for emission. The obtained spectra were integrated to get a total intensity value for each measurement at a given temperature.
Anisotropy measurements were performed from 20 to 60 °C (pH 9.3), 26–86 °C (pH 8.3) and 26–96 °C (pH 7.8) with 2 °C steps. The samples were equilibrated 15 min at the starting temperature and then 5 minutes at each of the measured temperature points. Excitation was at 375 nm and emission observed at 470 nm, using slits 4 and 4 nm. In these experiments, the probe is excited with polarized light and emission is detected both vertically (IV) and perpendicularly (IPP) to the incident light. The anisotropy (r) for a probe is obtained using eqn (2).
 | (2) |
Results
Preparation of polymeric samples
Clay grafted with 51![[thin space (1/6-em)]](https://www.rsc.org/images/entities/char_2009.gif) 000 g mol−1 PDMAEMA chains was produced. However it was noticed that the dispersions of this material were not stable at pH 8.3 and 9.3 but precipitated in minutes after agitation was stopped. To increase the stability of the particles, a material with longer (232
000 g mol−1 PDMAEMA chains was produced. However it was noticed that the dispersions of this material were not stable at pH 8.3 and 9.3 but precipitated in minutes after agitation was stopped. To increase the stability of the particles, a material with longer (232![[thin space (1/6-em)]](https://www.rsc.org/images/entities/char_2009.gif) 000 and 282
000 and 282![[thin space (1/6-em)]](https://www.rsc.org/images/entities/char_2009.gif) 000 g mol−1) polymer chains was produced.
000 g mol−1) polymer chains was produced.
For comparison and analysis the polymer chains were detached from the clay. This way free polymers were obtained and the properties of both materials could be investigated.
The initiator modified clay was washed with water, methanol and THF and the attachment of the initiator groups was confirmed by prolonged Soxhlet extraction, TGA and IR spectroscopy. The final hybrid materials were also analysed by TGA to determine the amount of clay. From the TGA results the amount of water is subtracted.
In the microcalorimetric analysis the second heating and cooling runs were used for analysis and the enthalpies were calculated per mole of a repeating unit.
Solution properties of PDMAEMA
The intensity of emission observed from solutions of 1,8-ANS and PDMAEMA (282![[thin space (1/6-em)]](https://www.rsc.org/images/entities/char_2009.gif) 000 g mol−1, Fig. 1) decreases with increasing temperature. However, at the cloud point the emission intensity suddenly increases due to scattering from the collapsed polymer. Probably at that instant the environment of the probe suddenly turns less polar. Lowering the pH from 9.3 to 7.8 shifts the cloud point from ∼30 °C to 75 °C. The overall decrease in the intensity of emission indicates that the polymer loses its hydration water at the cloud point. Since the probe is ionic and the local environment for the probe gets more hydrophobic, it is eventually squeezed out from the polymer coil and the fluorescence intensity decreases (Fig. 2). The decrease in the intensity at temperatures above the cloud point may naturally be also affected by gradual precipitation of the polymer. However, the decrease is observed already at low temperatures (T < TCP), except at pH 9.3 and thus, the hypothesis exemplified in Fig. 2 seems realistic. As will be shown below, also the fluorescence anisotropy data support the hypothesis.
000 g mol−1, Fig. 1) decreases with increasing temperature. However, at the cloud point the emission intensity suddenly increases due to scattering from the collapsed polymer. Probably at that instant the environment of the probe suddenly turns less polar. Lowering the pH from 9.3 to 7.8 shifts the cloud point from ∼30 °C to 75 °C. The overall decrease in the intensity of emission indicates that the polymer loses its hydration water at the cloud point. Since the probe is ionic and the local environment for the probe gets more hydrophobic, it is eventually squeezed out from the polymer coil and the fluorescence intensity decreases (Fig. 2). The decrease in the intensity at temperatures above the cloud point may naturally be also affected by gradual precipitation of the polymer. However, the decrease is observed already at low temperatures (T < TCP), except at pH 9.3 and thus, the hypothesis exemplified in Fig. 2 seems realistic. As will be shown below, also the fluorescence anisotropy data support the hypothesis.
 | ||
Fig. 1 Summary of integrated emission intensities of 1,8-ANS in PDMAEMA (282![[thin space (1/6-em)]](https://www.rsc.org/images/entities/char_2009.gif) 000 g mol−1) solutions with pH 7.8, 8.3 and 9.3 as a function of temperature. 000 g mol−1) solutions with pH 7.8, 8.3 and 9.3 as a function of temperature. | ||
 | ||
| Fig. 2 Illustration of the fluorescent probe 1,8-ANS being squeezed out from the polymer coil during the phase transition (probe bound to the polymer is coloured with green and that in aqueous phase with grey). | ||
The emission is weaker from the solution with pH 7.8 than that observed for the other solutions, when not taking into account the maximum around the cloud point. The local environment of the probe certainly is more polar in this case due to more charges in the polymer chains. The maxima for the emission are at ∼470 nm for the solutions with pH 8.3 and 9. Ricca et al. have reported that the emission maximum for 1,8-ANS in a poly(vinyl pyrrolidone) hydrogel is 470 nm.23 This confirms that the probe is indeed bound to the polymer chains and that the collapsed PDMAEMA resembles a neutral polymer in polarity. A clear shift of the emission maximum from 491 nm to 469 nm is observed with increasing temperature for the solution with pH 7.8. This clearly indicates that the polymer changes from polar to less polar during the phase transition. For all three solutions the emission maxima are ∼470 nm at temperatures above the cloud point indicating that the polarities of the collapsed coils are equal in all three cases. (Emission spectra are presented in ESI†.)
The fluorescence anisotropy shows a sudden drop at the cloud point in the solutions of free polymer (Fig. 3). The anisotropy data well support the idea of the probe being squeezed out from the polymer coil upon the collapse of the chain. The initial level of anisotropy is different due to the density of packing of the polymer chains, which depends on the pH of the solutions.
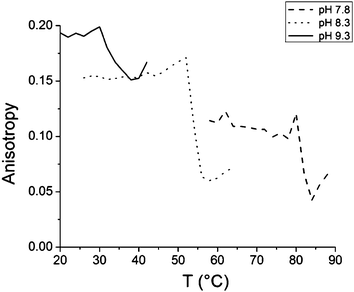 | ||
Fig. 3 Anisotropy data of 1,8-ANS in PDMAEMA (282![[thin space (1/6-em)]](https://www.rsc.org/images/entities/char_2009.gif) 000 g mol−1) solutions with pH 7.8, 8.3, and 9.3. 000 g mol−1) solutions with pH 7.8, 8.3, and 9.3. | ||
![[thin space (1/6-em)]](https://www.rsc.org/images/entities/char_2009.gif) 000 g mol−1) in a solution with pH 7.7 was also investigated and the enthalpy of the phase transition was 6.35 kJ mol−1 (Fig. 5).
000 g mol−1) in a solution with pH 7.7 was also investigated and the enthalpy of the phase transition was 6.35 kJ mol−1 (Fig. 5).
 | ||
Fig. 4 Heating thermograms of PDMAEMA (282![[thin space (1/6-em)]](https://www.rsc.org/images/entities/char_2009.gif) 000 g mol−1) solutions with pH 7.8, 8.3 and 9.3. 000 g mol−1) solutions with pH 7.8, 8.3 and 9.3. | ||
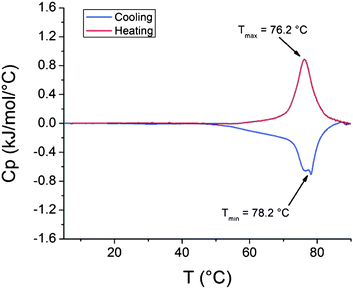 | ||
Fig. 5
Thermogram of PDMAEMA (51![[thin space (1/6-em)]](https://www.rsc.org/images/entities/char_2009.gif) 000 g mol−1) solution with pH 7.7. 000 g mol−1) solution with pH 7.7. | ||
Some interesting details are observed in the cooling thermograms. The peaks observed during heating show only slight shouldering. However, the reverse processes upon cooling occur clearly in a step wise manner (Fig. 6). The solution with pH 8.3 shows a double peak and in pH 7.8, the shouldering of the exothermic peak is noticeably clear. Thus the dissolution of charged PDMAEMA is a two step process. At pH 9.3 the polymer behaves as a neutral one. In the solutions with pH 7.8 and 8.3, the polymer chains are protonated during the first stages of dissolution. This promotes swelling and further dissolution of the polymer chains. The sharp peaks observed in the cooling thermograms for solutions with pH 8.3 and 7.8 would then originate from the dissolution and protonation of the chains. The broad shouldering of the peaks owes to the further dissolution of the polymer chains.
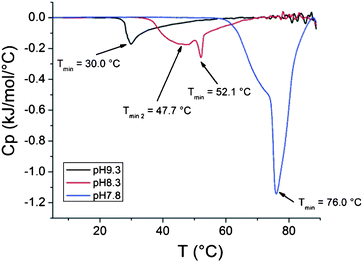 | ||
Fig. 6 Cooling thermograms of PDMAEMA (282![[thin space (1/6-em)]](https://www.rsc.org/images/entities/char_2009.gif) 000 g mol−1) solutions with pH 7.8, 8.3 and 9.3. 000 g mol−1) solutions with pH 7.8, 8.3 and 9.3. | ||
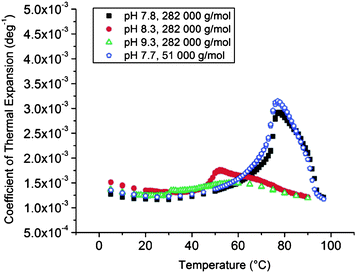
This method is well documented and has been used to study solution behaviour of e.g.proteins,25–27DNA28 and several synthetic thermoresponsive polymers.29,30 The thermal expansion coefficient is sensitive to temperature and solvation properties of molecules e.g.proteins have both hydrophobic and hydrophilic groups. The hydrophobic groups act as structure makers in water and the hydrophilic groups as structure breakers, thus they affect the thermal expansion coefficient differently.25 The value of α decreases with temperature due to the solvation effects of hydrophilic groups, while hydrophobic groups have an opposite effect.25–27 The effect of the structuration of solvent can also be observed if the hydrogen bonding capability of the solvent is changed. D2O gives larger values for α than H2O due to stronger hydrogen bonding. Values of α for pure water are higher than for aqueous guanidinium sulfate in which the salt disturbs long range hydrogen bonding. Several groups have also observed a similarity in the peaks obtained from PPC and microDSC in which both curves show similar Tmax and shape.25,28,30 This, however, is not a general fact as has been shown with PVCL.29
The solvation effect of hydrophilic groups, that is the polar or charged groups, can also be seen for PDMAEMA in a PPC run. In the PPC curves, a characteristic negative slope with positive curvature is observed at the lower temperature region below the transition temperature (Fig. 7).
 | ||
| Fig. 7 PPC data of PDMAEMA solutions. | ||
Increasing the amount of charges by lowering the pH has a great effect on the volume of the hydration layer of PDMAEMA chains. The relative changes (ΔV/V) in the hydration layers upon the collapse of the polymer are 0.03, 0.20 and 2.80% in pH 9.3, 8.3 and 7.8 for PDMAEMA chains with molecular mass 282![[thin space (1/6-em)]](https://www.rsc.org/images/entities/char_2009.gif) 000 g mol−1. The corresponding value is 3.30% for a polymer with molecular mass 51
000 g mol−1. The corresponding value is 3.30% for a polymer with molecular mass 51![[thin space (1/6-em)]](https://www.rsc.org/images/entities/char_2009.gif) 000 g mol−1 in pH 7.7. The values vary in a wide range as could be expected.
000 g mol−1 in pH 7.7. The values vary in a wide range as could be expected.
Comparison with ΔV/V values of neutral responsive polymers gives a useful scale which shows the magnitude of the change in PDMAEMA ΔV/V. For noncharged thermoresponsive polymers poly(vinylcaprolactam) (PVCL), poly(N-isopropyl acrylamide) (PNIPA) and poly(2-isopropyl-2-oxazoline) (PiPrOx) the ΔV/V are reported as 0.57% (PVCL), 1.01% (PNIPA) and 1.40% (PiPrOx).29,30
Behaviour of PDMAEMA bound to clay surfaces
![[thin space (1/6-em)]](https://www.rsc.org/images/entities/char_2009.gif) 000 g mol−1) grafted to clay behaves similarly to the free polymer. The cloud points are equal, i.e. 30, 50 and 75 °C for dispersions with pH 9.3, 8.3 and 7.8 (Fig. 8). As is the case for the free polymer, no change in the absorption maximum (470 nm) is observed for the dispersion with pH 9.3. For the dispersion with pH 8.3 a moderate change from 478 nm to 470 nm in the absorption maximum is observed when heating the sample from 20 to 80 °C. A shift of the absorption maximum from 487 to 470 nm is observed for the dispersion with pH 7.8. (Emission spectra are presented in ESI†.) The findings are indeed well in line with the observations made for the free polymer.
000 g mol−1) grafted to clay behaves similarly to the free polymer. The cloud points are equal, i.e. 30, 50 and 75 °C for dispersions with pH 9.3, 8.3 and 7.8 (Fig. 8). As is the case for the free polymer, no change in the absorption maximum (470 nm) is observed for the dispersion with pH 9.3. For the dispersion with pH 8.3 a moderate change from 478 nm to 470 nm in the absorption maximum is observed when heating the sample from 20 to 80 °C. A shift of the absorption maximum from 487 to 470 nm is observed for the dispersion with pH 7.8. (Emission spectra are presented in ESI†.) The findings are indeed well in line with the observations made for the free polymer.
 | ||
Fig. 8 Summary of integrated emission intensities from 1,8-ANS in dispersions of clay grafted with PDMAEMA with pH 7.8, 8.3 and 9.3 as a function of temperature (232![[thin space (1/6-em)]](https://www.rsc.org/images/entities/char_2009.gif) 000 g mol−1, 6% clay). 000 g mol−1, 6% clay). | ||
The anisotropy data confirm that also in this case the probe is squeezed out from the polymer coils during the phase transition (Fig. 9). As observed for the solutions of free polymers (Fig. 3) the mobility of the probe increases with lowering the pH and increasing temperature, and the mobility abruptly increases during the phase transition.
 | ||
Fig. 9 Anisotropy data of 1,8-ANS in clay grafted with PDMAEMA dispersions with pH 7.8, 8.3 and 9.3 (232![[thin space (1/6-em)]](https://www.rsc.org/images/entities/char_2009.gif) 000 g mol−1, 6% clay). 000 g mol−1, 6% clay). | ||
![[thin space (1/6-em)]](https://www.rsc.org/images/entities/char_2009.gif) 000 g mol−1, 6% clay) show an increase in enthalpy of the phase transition with lowering the pH of the dispersions (Fig. 10). The enthalpy values for the composite dispersions differ however from the enthalpies obtained for the solutions of free polymers. The same is true for a dispersion of clay grafted with shorter PDMAEMA where the molecular mass of the polymer is 51
000 g mol−1, 6% clay) show an increase in enthalpy of the phase transition with lowering the pH of the dispersions (Fig. 10). The enthalpy values for the composite dispersions differ however from the enthalpies obtained for the solutions of free polymers. The same is true for a dispersion of clay grafted with shorter PDMAEMA where the molecular mass of the polymer is 51![[thin space (1/6-em)]](https://www.rsc.org/images/entities/char_2009.gif) 000 g mol−1 and correspondingly, the amount of clay is higher (44%, Fig. 11). The peaks in the heating thermograms are reasonably narrow but as with the free polymer, the peaks in the cooling thermograms are more complex (Fig. 12).
000 g mol−1 and correspondingly, the amount of clay is higher (44%, Fig. 11). The peaks in the heating thermograms are reasonably narrow but as with the free polymer, the peaks in the cooling thermograms are more complex (Fig. 12).
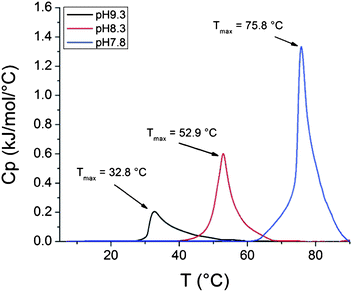 | ||
Fig. 10 Heating thermograms of clay grafted with PDMAEMA dispersions with pH 7.8, 8.3 and 9.3 (232![[thin space (1/6-em)]](https://www.rsc.org/images/entities/char_2009.gif) 000 g mol−1, 6% clay). 000 g mol−1, 6% clay). | ||
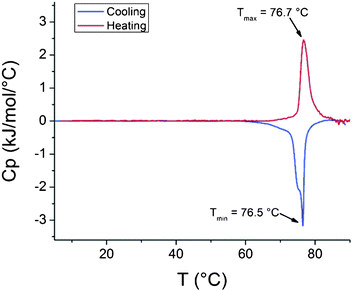 | ||
Fig. 11
Thermogram of clay grafted with PDMAEMA dispersion with pH 7.3 (51![[thin space (1/6-em)]](https://www.rsc.org/images/entities/char_2009.gif) 000 g mol−1, 44% clay). 000 g mol−1, 44% clay). | ||
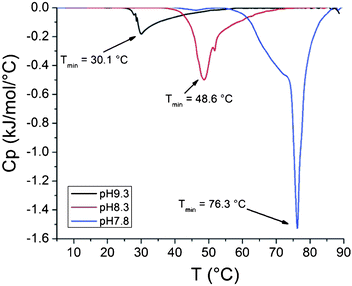 | ||
Fig. 12 Cooling thermograms of clay grafted with PDMAEMA dispersions with pH 7.8, 8.3 and 9.3 (232![[thin space (1/6-em)]](https://www.rsc.org/images/entities/char_2009.gif) 000 g mol−1, 6% clay). 000 g mol−1, 6% clay). | ||
For samples with pH 9.3 the difference in enthalpy between the grafted polymer (1.84 kJ mol−1) and the free one (1.92 kJ mol−1) is negligible. Interestingly, the enthalpy for the grafted polymer (3.97 kJ mol−1) in a dispersion with pH 8.3 is much higher compared to the free polymer (2.89 kJ mol−1). At pH 7.8 the enthalpy for polymer grafted to clay (8.89 kJ mol−1) is lower than for the free polymer (11.05 kJ mol−1) and it occurs at 2 °C lower temperature. For the shorter polymer at pH 7.8 the enthalpy is higher (8.56 kJ mol−1) for the polymer grafts than for the free polymer (6.35 kJ mol−1).
![[thin space (1/6-em)]](https://www.rsc.org/images/entities/char_2009.gif) 000 g mol−1) are 3.60, 0.20 and 0.08% for dispersions with pH 7.8, 8.3 and 9.3, correspondingly. For the composite particles with shorter grafts (51
000 g mol−1) are 3.60, 0.20 and 0.08% for dispersions with pH 7.8, 8.3 and 9.3, correspondingly. For the composite particles with shorter grafts (51![[thin space (1/6-em)]](https://www.rsc.org/images/entities/char_2009.gif) 000 g mol−1) ΔV/V is 2.90% in a dispersion with pH 7.3.
000 g mol−1) ΔV/V is 2.90% in a dispersion with pH 7.3.
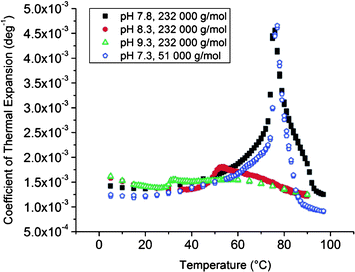 | ||
| Fig. 13 PPC data of dispersions of clay grafted with PDMAEMA. | ||
When comparing with the free homopolymer, the grafting hardly affects the hydration layer in the dispersions with pH 9.3 and 8.3. However, in the dispersions with pH 7.8 and 7.3 the effect of the grafting becomes visible. For the longer PDMAEMA grafts the change in hydration volume (3.60%) is greater than for the free polymer (2.80%). Surprisingly enough, an opposite effect is observed in the case of the shorter grafts (2.90 vs. 3.30%).
Discussion
PDMAEMAs with two molar masses have been studied in three buffers, both as free chains in solution and as grafts on montmorillonite particles. The particles were dispersed in the same three buffers.The fluorescence studies indicate that the collapsed chains resemble in polarity a neutral polymer. The emission maxima for 1,8-ANS are at 470 nm after the phase transition for all samples. The presence of clay in the dispersions alters the polarity of the systems when the PDMAEMA is charged (pH 8.3 and 7.8). This can be observed as a shift in the emission maximum of 1,8-ANS at room temperature. For the dispersion the emission maximum is 487 nm at pH 7.8, 478 nm at pH 8.3, and 470 nm at pH 9.3. For the solutions of free polymers the maxima are in the order of increasing pH at 491 nm, 470 nm, and 470 nm.
The calorimetric data are different for the dispersions of clay grafted with PDMAEMA and the solutions of free polymer.
Firstly, the enthalpy of the phase transition in a dispersion of the clay grafted with high molar mass PDMAEMA is higher than for the free polymer at pH 8.3 (3.97 kJ mol−1vs. 2.98 kJ mol−1). The double peak observed in the cooling thermograms is more evident for the free polymer than for the polymer grafted to clay (Fig. 6 and 12).
Secondly, the enthalpy of the phase transition in a dispersion of clay grafted with shorter PDMAEMA chains is higher than that of the free polymer (8.56 kJ mol−1vs. 6.35 kJ mol−1). As noted before, the dispersion with short grafts could be measured only at pH 7.7, however.
Thirdly, at pH 7.8, the enthalpy of the phase transition in a dispersion of the clay grafted with a high molar mass PDMAEMA is lower than for the homopolymer (8.89 kJ mol−1vs. 11.05 kJ mol−1). At this pH, the transition is also observed at a lower temperature for the grafts than for the free polymer (75.8 °C vs. 77.9 °C).
These observations indicate that the PDMAEMA interacts with the clay. Montmorillonite clay consists of negatively charged platelets which are held together by counterions. Thus it can interact with the positive charges in the PDMAEMA chains. The partial adsorption of the chains to the clay surface affects the enthalpies of the phase transitions. The lower the pH, the stronger is the interaction as can be deduced from the observations described above.
In the case of the clay grafted with shorter PDMAEMA chains the polymers may be almost completely adsorbed to the clay surface. This would explain the different behaviour observed for the shorter polymer at pH 7.3, compared with the hybrid material with longer chains at pH 7.8. Also the colloidal stability for the clay grafted with shorter PDMAEMA chains is lower. At pH 8.3 and 9.3 this hybrid material is not colloidally stable enough for any meaningful microDSC measurements.
Lee et al. have studied the protonation of PDMAEMA (pKa = 7.4) in detail by titration and shown that 80% of the deprotonation of the amino groups in the polymer occurs in the pH interval 6–8.31 These authors also point out the effect of ionic strength on the protonation. In the present case, ionic strength somewhat varied in the samples, being 0.18, 0.25, and 0.12 in the buffers with pH 7, 8, and 9, correspondingly. This causes slight variation in the degree of protonation but the effect is highest at the lowest pH,31 and thus does not affect our conclusions.
Conclusions
In a hybrid material consisting of PDMAEMA grafted clay, the temperature induced phase transition is affected not only by the pH of the solution but also by the electrostatic interactions between the clay and positively charged polymer. This can be observed from the thermograms, when comparing a solution of a free polymer (282![[thin space (1/6-em)]](https://www.rsc.org/images/entities/char_2009.gif) 000 g mol−1) with a polymer (232
000 g mol−1) with a polymer (232![[thin space (1/6-em)]](https://www.rsc.org/images/entities/char_2009.gif) 000 g mol−1) grafted to clay (Fig. 4, 6, 10 and 12). The influence of clay is most prominent in the dispersion with pH 8.3 while in dispersions with pH 7.8 and 9.3 the effect is less obvious. pH dependence is a result of the interplay between the degree of protonation and chain length. In the lowest pH the degree of protonation is highest and the solid clay surface gets saturated with polycations leaving part of the chain free. Shortening the polymer chain (51
000 g mol−1) grafted to clay (Fig. 4, 6, 10 and 12). The influence of clay is most prominent in the dispersion with pH 8.3 while in dispersions with pH 7.8 and 9.3 the effect is less obvious. pH dependence is a result of the interplay between the degree of protonation and chain length. In the lowest pH the degree of protonation is highest and the solid clay surface gets saturated with polycations leaving part of the chain free. Shortening the polymer chain (51![[thin space (1/6-em)]](https://www.rsc.org/images/entities/char_2009.gif) 000 g mol−1) considerably decreases the colloidal stability of the clay particles because a bigger fraction of the polymer is now adsorbed to the surface.
000 g mol−1) considerably decreases the colloidal stability of the clay particles because a bigger fraction of the polymer is now adsorbed to the surface.
PPC measurements show that the volume of the hydration layer of the high molecular mass polymers increases drastically with decreasing pH for both free polymers and polymers grafted to clay. The change in the hydration volume is roughly 50 times higher at pH 7.8 than at pH 9.3. The presence of clay has a noticeable effect on the volume change. For the hybrid material with 232![[thin space (1/6-em)]](https://www.rsc.org/images/entities/char_2009.gif) 000 g mol−1 chains ΔV/V = 3.6% and for the free polymer chains 282
000 g mol−1 chains ΔV/V = 3.6% and for the free polymer chains 282![[thin space (1/6-em)]](https://www.rsc.org/images/entities/char_2009.gif) 000 g mol−1, ΔV/V = 2.8%.
000 g mol−1, ΔV/V = 2.8%.
The fluorescence studies with a probe (1,8-ANS) confirm the conclusions made from calorimetric data. The polarity of the polymer decreases during the temperature induced phase transition. Emission intensity for both free PDMAEMA and PDMAEMA grafted to clay decreases with increasing temperature because of the collapse of the chains. The change in polarity of the polymer is clearly observed in samples with pH 7.8 as a blue shift in the emission maxima owing to the chain collapse.
Acknowledgements
The authors thank Professor Françoise Winnik for helpful discussions concerning the data analysis. We would like to thank as well Rockwood Clay Additives for kindly providing us with the clay needed for this work. This work was funded by MUST (Multi-Level Protection of Materials for Vehicles by “Smart” Nanocontainers) project, which is a 7th framework programme EU-project.Notes and references
- J. Pyun and K. Matyjaszewski, Chem. Mater., 2001, 13, 3436–3448 CrossRef CAS.
- S. Pavlidou and C. D. Papaspyrides, Prog. Polym. Sci., 2008, 33, 1119–1198 CrossRef CAS.
- J. Raula, J. Shan, M. Nuopponen, A. Niskanen, H. Jiang, E. I. Kauppinen and H. Tenhu, Langmuir, 2003, 19, 3499–3504 CrossRef CAS.
- J. Shan, Y. Zhao, N. Granqvist and H. Tenhu, Macromolecules, 2009, 42, 2696–2701 CrossRef CAS.
- J. Shan, J. Chen, M. Nuopponen and H. Tenhu, Langmuir, 2004, 20, 4671–4676 CrossRef CAS.
- J. Niskanen, J. Shan, H. Tenhu, H. Jiang, E. Kauppinen, V. Barranco, F. Picó, K. Yliniemi and K. Kontturi, Colloid Polym. Sci., 2010, 288, 543–553 CAS.
- S. Balamurugan, S. Mendez, S. S. Balamurugan, M. J. O'Brie and G. P. López, Langmuir, 2003, 19, 2545–2549 CrossRef CAS.
- M. Karesoja, H. Jokinen, E. Karjalainen, P. Pulkkinen, M. Torkkeli, A. Soininen, J. Ruokolainen and H. Tenhu, J. Polym. Sci., Part A: Polym. Chem., 2009, 47, 3086–3097 CrossRef CAS.
- P. A. Wheeler, J. Wang and L. J. Mathias, Chem. Mater., 2006, 18, 3937–3945 CrossRef CAS.
- C.-M. Leu, Z.-W. Wu and K.-H. Wei, Chem. Mater., 2002, 14, 3016–3021 CrossRef CAS.
- P. A. Wheeler, J. Wang, J. Baker and L. J. Mathias, Chem. Mater., 2005, 17, 3012–3018 CrossRef CAS.
- P. Kujawa and F. M. Winnik, Macromolecules, 2001, 34, 4130–4135 CrossRef CAS.
- A. Laukkanen, L. Valtola, F. M. Winnik and H. Tenhu, Polymer, 2005, 46, 7055–7065 CrossRef CAS.
- J. Shan, M. Nuopponen, H. Jiang, E. Kauppinen and H. Tenhu, Macromolecules, 2003, 36, 4526–4533 CrossRef CAS.
- V. Aseyev, H. Tenhu and F. M. Winnik, Adv. Polym. Sci., 2010, 1–61 Search PubMed.
- F. A. Plamper, M. Ruppel, A. Schmalz, O. Borisov, M. Ballauff and A. H. E. Müller, Macromolecules, 2007, 40, 8361–8366 CrossRef CAS.
- P. van de Wetering, N. J. Zuidam, M. J. van Steenbergen, O. A. G. J. van der Houwen, W. J. M. Underberg and W. E. Hennink, Macromolecules, 1998, 31, 8063–8068 CrossRef CAS.
- F. Attanasio, G. Rialdi, R. Swierzewski and W. Zielenkiewicz, J. Therm. Anal. Calorim., 2006, 83, 637–640 CrossRef CAS.
- X. Frielinghaus, M. Brodeck, O. Holderer and H. Frielinghaus, Langmuir, 2010, 26, 17444–17448 CrossRef CAS.
- Y. Cui and J. S. van Duijneveldt, Langmuir, 2010, 26, 17210–17217 CrossRef CAS.
- R. Zana, J. Polym. Sci., Polym. Phys. Ed., 1980, 18, 121–126 CrossRef CAS.
- J. R. Lakowicz, Principles of Fluorescence Spectroscopy, Springer, 3rd edn, 2006 Search PubMed.
- M. Ricca, V. Foderà, D. Giacomazza, M. Leone, G. Spadaro and C. Dispenza, Colloid Polym. Sci., 2010, 288, 969–980 CAS.
- B. P. Nair, C. Pavithran, J. D. Sudha and V. S. Prasad, Langmuir, 2010, 26, 1431–1434 CrossRef CAS.
- L.-N. Lin, J. F. Brandts, J. M. Brandts and V. Plotnikov, Anal. Biochem., 2002, 302, 144–160 CrossRef CAS.
- L. Mitra, N. Smolin, R. Ravindra, C. Royer and R. Winter, Phys. Chem. Chem. Phys., 2006, 8, 1249 RSC.
- L. Mitra, J.-B. Rouget, B. Garcia-Moreno, C. A. Royer and R. Winter, ChemPhysChem, 2008, 9, 2715–2721 CrossRef CAS.
- G. Rayan, A. D. Tsamaloukas, J. Macgregor and H. Heerklotz, J. Phys. Chem. B, 2009, 113, 1738–1742 CrossRef CAS.
- A. Laukkanen, L. Valtola, F. M. Winnik and H. Tenhu, Macromolecules, 2004, 37, 2268–2274 CrossRef CAS.
- R. Obeid, F. Tanaka and F. M. Winnik, Macromolecules, 2009, 42, 5818–5828 CrossRef CAS.
- H. Lee, S. H. Son, R. Sharma and Y.-Y. Won, J. Phys. Chem. B, 2011, 115, 844–860 CrossRef CAS.
Footnote |
| † Electronic supplementary information (ESI) available. See DOI: 10.1039/c1py00143d |
| This journal is © The Royal Society of Chemistry 2011 |
