Preparation and study of alkyl carbamylated polyrotaxanes with large hysteresis during sol–gel phase transition
Wei
Li
a,
Yanli
Guo
*a,
Peng
He
a,
Rong
Yang
a,
Xingguo
Li
*a,
Ye
Chen
a,
Dehai
Liang
a,
Masatoshi
Kidowaki
b and
Kohzo
Ito
b
aBeijing National Laboratory for Molecular Sciences (BNLMS), (The State Key Laboratory of Rare Earth Materials Chemistry and Applications), College of Chemistry and Molecular Engineering, Peking University, Beijing, 100871, China. E-mail: xgli@pku.edu.cn; Tel: +86 010 62765930
bDepartment of Advanced Materials Science, Graduate School of Frontier Sciences, University of Tokyo, 5-1-5 Kashiwanoha, Kashiwa-City, Chiba 277-8562, Japan
First published on 6th May 2011
Abstract
Ethyl carbamylated polyrotaxane (ECPR) and propyl carbamylated polyrotaxane (PCPR) were prepared based on the reactions between ethyl/propyl isocyanate and polyrotaxane (PR) in anhydrous DMSO under an argon atmosphere. By changing the alkyl type and substitution ratio, the PR derivative with good water-solubility was obtained and its solutions showed reversible sol–gel phase transition. During the heating process, transition temperature from sol to gel decreased from 32 °C to 18 °C with increasing the solution concentration from 2.44% to 13.5%, while in the cooling process, all the gels with various concentration did not turn into sols until the temperature decreased to 1 °C, exhibiting large hysteresis between heating and cooling.
1. Introduction
In recent years, polyrotaxanes (PRs) with topological interlocked structures have attracted more and more attention, since their unique architecture leads to a lot of novel properties and potential applications in the fields of materials and biological sciences.1–16 Many efforts have been made to construct more interesting supramolecular structures,2,7–10,17–20 clarify the basic physical properties4,21–29 and develop various useful materials for industrial and medical applications.3,6,15,30–34 More recently, Kidowaki30 and Kataoka35 have made an attempt to introduce hydrophobic groups onto the cyclic molecules threaded on the linear polymer by synthesizing methylated polyrotaxane composed of α-cyclodextrin (α-CD) and poly(ethylene glycol) (PEG), and succeeded in preparing a thermosensitive sol–gel reversible hydrogel. According to their studies, substitution of hydroxyl groups (–OH) of α-CDs by methoxyl groups (–OCH3) not only weakened the intra- and intermolecular hydrogen bonding interaction of PR molecules, resulting in the remarkable improvement of water-solubility of the derivative, but also induced temperature-responsive hydrophobic interaction, which plays an important role in the reversible sol–gel phase transition. Furthermore, the phase transition behavior of methylated PR has been investigated in detail based on differential scanning calorimetry (DSC) and rheological measurements. Although the PR with methyl groups has been studied a lot, the effects of hydrophobicity of the grafted side chains on the properties of the PR derivatives have not been systematically studied. In the present work, we introduced ethyl carbamyl and propyl carbamyl groups onto α-CDs of the PRs, based on the reaction of alkyl isocyanate and –OH groups. The influence of alkyl chain length and substitution ratio on the water-solubility and phase transition behavior of PR derivatives was investigated. Among the PR derivatives, ethyl carbamylated PR (ECPR) with substitution ratio of 0.111 showed the maximum water-solubility (15.62 g/100 g H2O). More interestingly, although the aqueous solution of ECPR (0.111) exhibited a similar reversible sol–gel phase transition, different from the methylated PR with little hysteresis,30 a remarkable hysteresis was observed during the sol–gel transition of ECPR, suggesting that the hydrophobicity of the grafted side chains significantly influenced phase transition behavior of the PR derivatives.2. Experimental
2.1. Materials
Polyrotaxane composed of PEG (M.W. 35,000) and α-CD, end-capped with adamantanamine was provided by Advanced Softmaterials, Inc. The number of α-CDs threaded on a PEG chain was estimated to be ca. 98 based on 1H NMR, corresponding to 24.5% coverage of PEG chains with α-CDs (one α-CD molecule can perfectly cover two PEG monomer units). Ethyl isocyanate and propyl isocyanate were purchased from J&K Chemical. Dibutyltindilaurate, serving as a catalyst, and dimethylsulphoxide (DMSO) were purchased from Alfa Aesar. All chemicals were used without further purification.2.2. Preparation of alkyl carbamylated polyrotaxane (ACPR)
In the previous study, Kidowaki and Kataoka30 prepared methylated PR based on a reaction of CH3I and polysaccharide. In this work, the reaction of isocyanate and –OH groups in the α-CDs enabled us to introduce alkyl carbamyl groups, including ethyl and propyl carbamyl groups onto the polyrotaxanes under milder and safer conditions without the evolution of hydrogen gas.1.0000 g of PR was dried at 80 °C under vacuum for 2 h, and then dissolved in 20 mL anhydrous DMSO under an argon atmosphere. 10 μL dibutyltindilaurate, serving as a catalyst, was added into the above solution, and stirred for 1 h at room temperature. Then, ethyl isocyanate or propyl isocyanate was slowly added to the solution to react for 24 h at room temperature. The amount of alkyl isocyanate used in this study is shown in Table 1. By changing the amount of alkyl isocyanate, we attempted to control the degree of substitution of ACPR. After 24 h, the reaction was stopped by adding distilled water to the reactant mixture, which was then dialyzed against water for 3 days by using a cellulose tube (MWCO 12,000) and freeze-dried to give a whitish solid. Finally, the solid was washed with acetonitrile, collected by centrifugation, and dried under vacuum at 80 °C to give the product. The purity of the polyrotaxane derivative was examined by GPC. The peak assigned to low molecular weight impurity is about 10% in area, in comparison to that assigned to the polyrotaxane derivative.
| Polyrotaxane | Alkyl isocyanate | Code | |
|---|---|---|---|
| 1.0000 g (∼9.90 × 10⁻³ mmol) | Ethyl isocyanate | 0.057 g (0.80 mmol) | ECPR1 |
| 0.112 g (1.58 mmol) | ECPR2 | ||
| 0.225 g (3.16 mmol) | ECPR3 | ||
| Propyl isocyanate | 0.125 g (1.49 mmol) | PCPR1 | |
| 0.250 g (2.99 mmol) | PCPR2 | ||
| 1.140 g (13.4 mmol) | PCPR3 | ||
2.3. Measurements
Fourier Transform Infrared (FTIR) spectra were measured on a Shimadzu FTIR 8400 spectrometer at room temperature, using the KBr pellet technique, in the region of 4000–600 cm−1.1H Nuclear Magnetic Resonance (1H NMR) spectra were recorded on a Bruker ARX-400 NMR spectrometer at 400 MHz at room temperature, using DMSO-d6 as solvent and tetramethylsilane (TMS) as internal standard.
Micro differential scanning calorimetry (Micro-DSC) measurements were run on a Setaram differential scanning calorimeter with scanning range from −1 to 50 °C at a scan rate of 0.5 °C min−1. The ACPR aqueous solutions were measured by using distilled water as a reference.
Light transmittance measurements were recorded on a Shimadzu UV-3100 spectrometer from 1 °C to 60 °C. The ACPR aqueous solutions were measured by using air as a reference, and a flow of dry N2 was used to prevent water vapor from condensing on the surface of the quartz cells.
The rheological measurements of the ACPR aqueous solution were performed on a Physica MCR 301 stress-controlled rheometer (Anton paar) with parallel plate geometry (25 mm in diameter) at a gap of 0.5 mm. The temperature dependent shear experiments were carried out at 1 Hz with the strain of 2%. To prevent the sample from drying, the mixture was sealed with low viscosity liquid paraffin.
3. Results and discussion
3.1. FTIR and 1H NMR characterization
Fig. 1 shows the FTIR spectra of PR and its derivatives. Compared with that of the original PR, a new IR absorption peak is observed around 1720 cm−1 in the spectrum of each PR derivative. The new peak is assigned to C![[double bond, length as m-dash]](https://www.rsc.org/images/entities/char_e001.gif) O stretching modes, providing us evidence on the introduction of alkyl carbamyl groups. Besides, the peak around 1540 cm−1, which is assigned to CN out-of-plane bending vibration and NH scissoring vibration modes, also supports it. All the above prove that alkyl isocyanate has reacted with PR and the alkyl carbamyl groups have been introduced onto the PRs. As discussed below, 1H NMR spectra give further evidence for the reaction.
O stretching modes, providing us evidence on the introduction of alkyl carbamyl groups. Besides, the peak around 1540 cm−1, which is assigned to CN out-of-plane bending vibration and NH scissoring vibration modes, also supports it. All the above prove that alkyl isocyanate has reacted with PR and the alkyl carbamyl groups have been introduced onto the PRs. As discussed below, 1H NMR spectra give further evidence for the reaction.
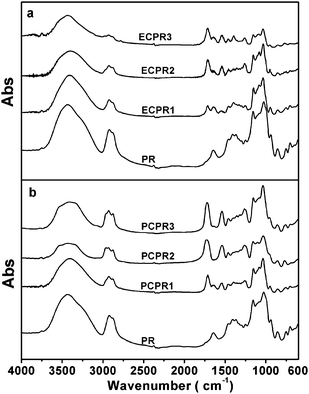 | ||
| Fig. 1 FTIR spectra of (a) ECPR and (b) PCPR. | ||
Fig. 2 shows 1H NMR spectra of the original PR and its derivatives in DMSO-d6. As compared to that of the original PR, new signal located at 6.9 ppm appeared in NMR spectrum of each PR derivative. The new NMR signal is attributed to 9NH and 13NH, which indicates that the alkyl isocyanate reacted with the PR and the alkyl carbamyl groups were successfully introduced onto the α-CDs. Furthermore, the signals at 1.9 ppm (7CH), 2.9 ppm (8CH and 12CH) and 1.4 ppm (11CH) also give good evidence for the reaction.
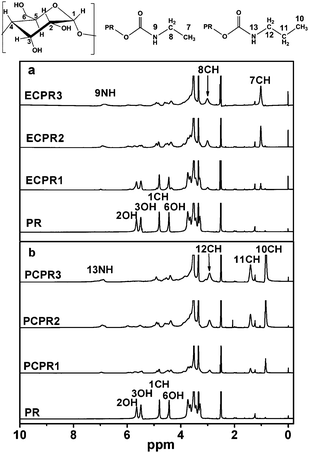 | ||
| Fig. 2 1H NMR spectra of (a) ECPR and (b) PCPR in DMSO-d6. | ||
Substitution ratio was calculated by comparing NMR signal areas of 7CH (or 10CH) of alkyl carbamyl groups and 1CH of α-CDs. As shown in Table 2, substitution ratio increases as increasing the amount of alkyl isocyanate added.
3.2. Solubility of ECPR and PCPR
As shown in Table 3, ECPR2 with substitution ratio of 0.111 shows the maximum water-solubility, while the other ECPRs with both higher and lower substitution ratios show poorer solubility. Since there are eighteen –OH groups in each α-CD, we suppose when two ethyl carbamyl groups were introduced into one α-CD, the hydrogen bonds among the α-CDs were effectively broken and water-solubility was remarkably improved. However, when propyl carbamyl groups with stronger hydrophobicity were introduced into the α-CDs, there is no obvious improvement in water-solubility for all the derivatives with various substitution ratios, indicating although the propyl carbamyl groups grafted to the α-CDs weakened the intra- and intermolecular hydrogen bonding, their strong hydrophobicity also resulted in the poor water-solubility.| Sample | Substitution ratio | Solubility (g/100 g H2O) |
|---|---|---|
| ECPR1 | 0.026 | 0.035 |
| ECPR2 | 0.111 | 15.62 |
| ECPR3 | 0.214 | 0.21 |
| PCPR1 | 0.172 | 0.16 |
| PCPR2 | 0.244 | 0.13 |
| PCPR3 | 0.354 | 0 |
Since the water-solubility of ECPR2 was effectively improved by introducing ethyl carbamyl side-groups with a proper substitution ratio of 0.111, further study on sol–gel phase transition was mainly based on this derivative.
3.3. Sol–gel phase transition study
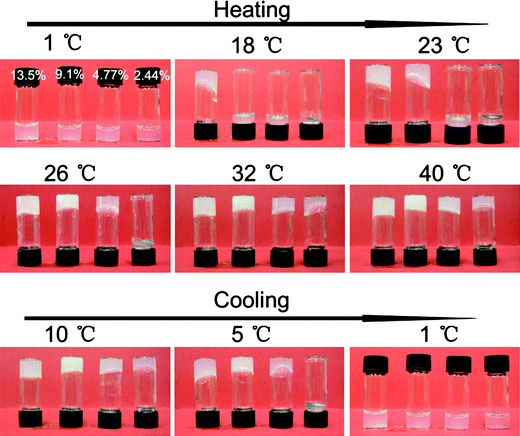 | ||
| Fig. 3 Sol–gel transition of ECPR2 solutions with various concentrations, (a) 13.5 wt%, (b) 9.1 wt%, (c) 4.77 wt%, (d) 2.44 wt%. | ||
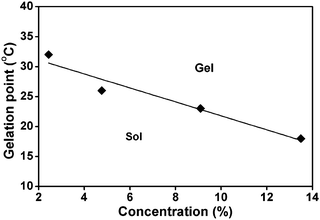 | ||
| Fig. 4 Phase diagram of the sol–gel transition. | ||
However, in the cooling process, even the gel with the lowest concentration of 2.44 wt% did not turn to a sol until the temperature was decreased to 5 °C. All the gels with higher concentration eventually melted into sols at 1 °C. This indicates that the phase transition from gel to sol is a much slower kinetic process as compared to the sol to gel transition.
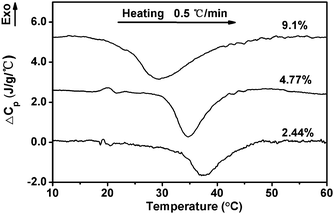 | ||
| Fig. 5 DSC curves of ECPR2 solutions in heating scans at a rate of 0.5 °C min−1. | ||
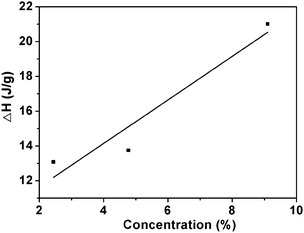 | ||
| Fig. 6 The relationship between the enthalpy of phase transition and the concentration of ECPR2 solutions. | ||
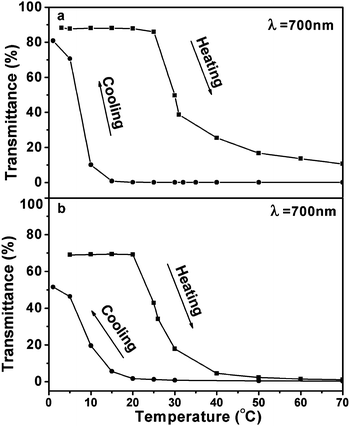 | ||
| Fig. 7 Temperature dependence of light transmittance for (a) 2.44 wt%, and (b) 4.77 wt% ECPR2 aqueous solutions. Squares and circles represent heating and cooling processes, respectively. | ||
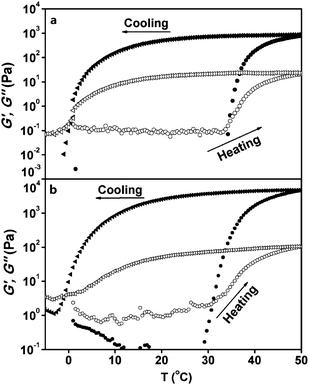 | ||
| Fig. 8 Temperature dependence of the storage modulus G′ (closed symbols) and the loss modulus G′′ (open symbols) for (a) 2.44 wt%, and (b) 4.77 wt% ECPR2 solutions at a scan rate of 0.5 °C min−1. The heating and cooling processes are represented by circles and triangles, respectively. | ||
The frequency dependence of G′ and G′′ for 2.44 wt% and 4.77 wt% ECPR2 solutions is shown in Fig. 9. The solution was kept at each temperature for over 60 min to reach equilibrium. The viscoelastic behaviors are drastically changed at the sol–gel transition temperature, 30 °C for 2.44% and 10 °C for 4.77% ECPR2 solutions, respectively. Above the transition temperatures, G′ ≫ G′′ is observed in the frequency range with a plateau even at low frequencies, indicating an elastic gel behavior.35,36
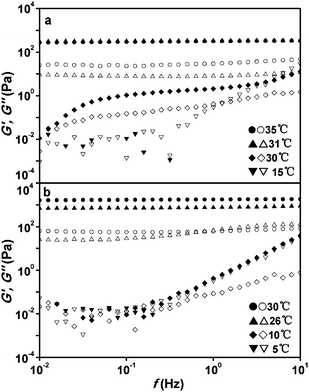 | ||
| Fig. 9 Frequency dependence of G′ (closed marks) and G′′ (open marks) for (a) 2.44 wt%, and (b) 4.77 wt% ECPR2 solutions at various temperatures with the strain of 2%. | ||
4. Conclusion
In this study, we successfully introduced alkyl carbamyl groups onto the α-CDs of PRs based on the reaction between isocyanate and α-CDs. By changing the alkyl type and substitution ratio, we prepared ECPR2 with good water-solubility (S = 15.62 g/100g H2O). Unlike the methylated PRs, the aqueous solutions of ECPR2 show sol–gel phase transition with remarkably large hysteresis between heating and cooling, indicating that the hydrophobicity of the side chains significantly influences the phase transition behavior of the PR derivatives.Acknowledgements
This work was supported by MOST of China (No. 2009CB939902) and NSFC (Nos. 20971009, 20821091 and 51071003).References
- A. Harada and M. Kamachi, Macromolecules, 1990, 23, 2821–2823 CrossRef CAS.
- A. Harada, J. Li and M. Kamachi, Nature, 1992, 356, 325–327 CrossRef CAS.
- Y. Okumura and K. Ito, Adv. Mater., 2001, 13, 485 CrossRef CAS.
- K. Mayumi and K. Ito, Polymer, 2010, 51, 959–967 Search PubMed.
- H. Fujita, T. Ooya and N. Yui, Macromolecules, 1999, 32, 2534–2541 CrossRef CAS.
- N. Yui, R. Katoono and A. Yamashita, Inclusion Polymers, 2009, vol. 222, pp. 55–77 Search PubMed.
- T. Takata, H. Kawasaki, N. Kihara and Y. Furusho, Macromolecules, 2001, 34, 5449–5456 CrossRef CAS.
- A. Harada, J. Li and M. Kamachi, Nature, 1994, 370, 126–128 CrossRef CAS.
- A. Harada, J. Li and M. Kamachi, Nature, 1993, 364, 516–518 CrossRef CAS.
- J. Araki and K. Ito, Soft Matter, 2007, 3, 1456–1473 RSC.
- T. Ooya and N. Yui, J. Biomater. Sci., Polym. Ed., 1997, 8, 437–455 CrossRef CAS.
- T. Oku, Y. Furusho and T. Takata, Angew. Chem., Int. Ed., 2004, 43, 966–969 CrossRef CAS.
- T. Takata, Polym. J., 2006, 38, 1–20 CrossRef CAS.
- X. W. Zhang, X. Q. Zhu, F. Y. Ke, L. Ye, E. Q. Chen, A. Y. Zhang and Z. G. Feng, Polymer, 2009, 50, 4343–4351 CrossRef CAS.
- J. Li, Inclusion Polymers, 2009, vol. 222, pp. 79–112 Search PubMed.
- C. Yang, J. S. Yang, X. P. Ni and J. Li, Macromolecules, 2009, 42, 3856–3859 Search PubMed.
- J. Araki and K. Ito, J. Polym. Sci., Part A: Polym. Chem., 2006, 44, 6312–6323 CrossRef CAS.
- J. Araki, K. Kagaya and K. Ohkawa, Biomacromolecules, 2009, 10, 1947–1954 Search PubMed.
- J. Araki, T. Kataoka and K. Ito, Soft Matter, 2008, 4, 245–249 RSC.
- T. Sato and T. Takata, Macromolecules, 2008, 41, 2739–2742 CrossRef CAS.
- C. M. Zhao, Y. Domon, Y. Okumura, S. Okabe, M. Shibayama and K. Ito, J. Phys.: Condens. Matter, 2005, 17, S2841–S2846 CrossRef CAS.
- T. Karino, Y. Okumura, K. Ito and M. Shibayama, Macromolecules, 2004, 37, 6177–6182 CrossRef CAS.
- T. Karino, Y. Okumura, C. M. Zhao, T. Kataoka, K. Ito and M. Shibayama, Macromolecules, 2005, 38, 6161–6167 CrossRef CAS.
- T. Karino, Y. Okumura, C. M. Zhao, M. Kidowaki, T. Kataoka, K. Ito and M. Shibayama, Macromolecules, 2006, 39, 9435–9440 CrossRef CAS.
- K. Mayumi, H. Endo, N. Osaka, H. Yokoyama, M. Nagao, M. Shibayama and K. Ito, Macromolecules, 2009, 42, 6327–6329 Search PubMed.
- K. Mayumi, N. Osaka, H. Endo, H. Yokoyama, Y. Sakai, M. Shibayama and K. Ito, Macromolecules, 2008, 41, 6480–6485 CrossRef CAS.
- T. Karino, M. Shibayama, Y. Okumura and K. Ito, Phys. B, 2006, 385, 807–809 Search PubMed.
- K. Mayumi, M. Nagao, H. Endo, N. Osaka, M. Shibayama and K. Ito, Phys. B, 2009, 404, 2600–2602 CrossRef CAS.
- Y. Shinohara, K. Kayashima, Y. Okumura, C. M. Zhao, K. Ito and Y. Amemiya, Macromolecules, 2006, 39, 7386–7391 CrossRef CAS.
- M. Kidowaki, C. M. Zhao, T. Kataoka and K. Ito, Chem. Commun., 2006, 4102–4103 RSC.
- M. Kidowaki, T. Nakajima, J. Araki, A. Inomata, H. Ishibashi and K. Ito, Macromolecules, 2007, 40, 6859–6862 CrossRef CAS.
- J. Araki, T. Kataoka, N. Katsuyama, A. Teramoto, K. Ito and K. Abe, Polymer, 2006, 47, 8241–8246 CrossRef CAS.
- Y. Ohya, S. Takamido, K. Nagahama, T. Ouchi, R. Katoono and N. Yui, Biomacromolecules, 2009, 10, 2261–2267 Search PubMed.
- N. Yui, in Biomedical Applications of Smart Materials, Nanotechnology and Micro/Nano Engineering, ed. P. Vincenzini and D. DeRossi, 2009, vol. 57, pp. 144–147 Search PubMed.
- T. Kataoka, M. Kidowaki, C. M. Zhao, H. Minamikawa, T. Shimizu and K. Ito, J. Phys. Chem. B, 2006, 110, 24377–24383 CrossRef CAS.
- K. Nishinari, Colloid Polym. Sci., 1997, 275, 1093–1107 CrossRef CAS.
| This journal is © The Royal Society of Chemistry 2011 |
