Nanofluid acrylate composite resins—initial preparation and characterization†
John
Texter
*ab,
Zhiming
Qiu‡
ab,
Rene
Crombez
ab,
Joseph
Byrom
ab and
Weidian
Shen
bc
aSchool of Engineering Technology, Eastern Michigan University, Ypsilanti, MI 48197, USA. E-mail: jtexter@emich.edu
bCoatings Research Institute, Eastern Michigan University, Ypsilanti, MI 48197, USA
cDepartment of Physics, Eastern Michigan University, Ypsilanti, MI 48197, USA
First published on 3rd May 2011
Abstract
The introduction of solvent-free nanofluids composed of suitably surface functionalized nanoparticles (nanosilica for example) has led to some interesting new materials. Here we show that the process of surface functionalizing with both nanofluid-inducing surface groups and with reactive (acrylate) surface groups produces solvent free nanofluids that can be incorporated in reactive coatings, films, and bulk materials and composites. We demonstrate in this study some composite materials based on our new reactive acrylate-nanofluid and a commercially available tetraacrylate. While it is widely known that addition of fillers and nanoparticles to resins often produces increased storage and elastic moduli, while generally also increasing brittleness, we found in this study that increasing weight fractions of reactive nanofluid in an otherwise very brittle environment, produces materials that are tougher (softer) while maintaining or decreasing storage moduli (depending on whether the loading is small or large). Possible applications include a new class of clearcoat protective overcoats and interesting new materials where softness is a formulation variable, such as in plasticization. In addition, we demonstrate that nanocomposites at high loading may be made thermally responsive in ways the parent polymer matrix is not. AFM surface analyses show that the nanofluid particles exhibit surface activity at the air–polymer interface similar to that observed for interfacial nanoparticles in Pickering emulsions. This surface activity, along with the intrinsic softness of the nanofluid particles, may offer a simple approach to providing intrinsic lubrication for polymeric surfaces subject to frictional shear.
Introduction
Giannelis and coworkers1–6 have introduced an exciting and new class of supramolecular fluids, we call solvent-free nanofluids, derived from nanoparticle cores surface-decorated with ionic liquid kinds of organic salts. Other groups have made solvent-free nanofluids by condensing dimethylstearylammoniumacetate zinc complexes to form solvent free luminescent and viscous liquid zinc nanocrystals,7 by decorating nanosilica and nanotitania with polyethylene glycol (PEG) oligomers,8 and by coating multiwall carbon nanotubes with PEG.9 Following the initial approach of Giannelis et al., where surface decoration is obtained using trimethoxysilylalkylammonium salts, we have added further surface modification so as to make new nanofluids as reactive components for new classes of zero VOC (volatile organic component) transparent resins suitable for various applications.These new reactive nanofluids may be pictured as supramolecular cross-linking agents. The sizes of such nanofluid particles are of the order of lengthy oligomeric length scales. Such nanofluids may also be used in large proportion wherein the inherent properties of the nanofluid are expressed in the resulting resin. In this report we describe the preparation of an acrylate-functionalized nanofluid and the preparation of UV-cured clearcoats therefrom after addition of a lower molecular weight acrylate. Organic–inorganic hybrid polymers have been finding increasing application and diversification10,11 in the last 20 years, and these nanofluid-based resins constitute a new class of such hybrids.
Extensive studies of nanocomposites comprising inorganic nanoparticles, including nanosilica and of nanocomposites comprising organically surface modified nanosilica have been reviewed.12–14 Organic surface functionalization usually improves the ease of dispersion of the inorganic nanoparticle in an organic polymer or prepolymer matrix. It also improves the mechanical transfer of stress from the matrix to the nanoparticle.15
The use of acrylate functionalized alkoxysilane reagents to surface functionalize nanosilica for composing UV cured clearcoats with improved scratch resistance has been described in several papers.16–18 In these studies the scratch resistance was improved by loading the acrylate resins with (meth)acrylate functionalized nanosilica. In these formulations the surface modification was done with methacryloyloxypropyltrimethoxysilane. Well established sol–gel condensation was used to attach these surface modifiers to the nanosilica surfaces. This acrylate surface modification both improves the dispersibility of the nanosilica in acrylate monomer and provides covalent attachments to the matrix by polymerization through the surface acryl or methacryl groups. We use these same chemistries in this study, except that we also have functionalized the nanosilica with ionic liquid kinds of surface groups, so that the nanosilica is in a solvent-free nanofluid state prior to resin formulation.
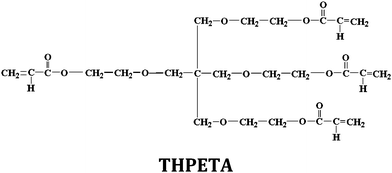
Herein we describe the initial synthesis and characterization of an acrylate-functionalized reactive nanofluid. We also describe and characterize a series of acrylate resins produced by photosensitized UV polymerization of this reactive nanofluid with a well known tetraacrylate monomer (THPETA). Possible future applications are also discussed.
Experiment
Materials
Ludox SM, a nominally 7 nm diameter colloidal silica, was obtained as the gift of the W. R. Grace & Co. (Baltimore, MD) as a 40%, w/w aqueous dispersion. The surface modifying reagents methyldidecyl ammonium propyltrimethoxy silane chloride and acryloyloxypropyltrimethoxy silane were obtained from Gelest (Morrisville, PA). 4-Nonylphenyl uncosa(oxyethylene)-3-sulfomethyl potassium salt (CAS 119438-10-7) was obtained from Aldrich. Tetrahydroxyethyl pentaerythritol tetraacrylate, THPETA (SR 494; ρ = 1.13 g cm−3),19 was obtained from Sartomer (Exton, PA). The photoinitiator, 2,2-dimethoxy-2-phenylacetophenone (DMPA), and methanol were obtained from Aldrich. Deionized water was used throughout. Glass microscope slides were obtained from Fisher Scientific.Synthesis of reactive nanofluid
The two-step synthesis of our nanofluid is pictured in Scheme 1. The first step involves the parallel surface functionalization of two trimethoxysilane reagents. The second step involves anion exchange for the chloride.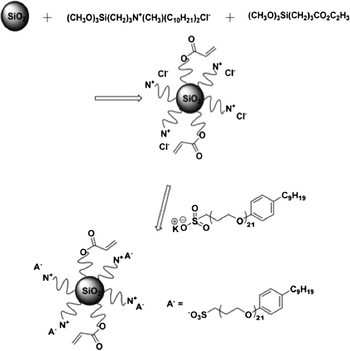 | ||
| Scheme 1 Synthetic scheme for the acrylate-modified nanofluid. | ||
An aqueous suspension of Ludox SM (7 mL, 3.22 g SiO2) is prepared by diluting with 40 mL deionized (DI) H2O. Then the acrylate reagent, (CH3O)3Si(CH2)3CO2C2H3 (0.185 g), is added to (CH3O)3Si(CH2)3N(CH3)(C10H21)2Cl in methanol (42%, 9.5 mL, 3.99 g reagent). This solution is then added slowly to the aqueous Ludox SM suspension. A white precipitate formed immediately, and the suspension was stirred at 25 °C for 24 h.
Then the product is washed with deionized H2O and this chloride salt (1.0 g) is then reacted with 1.5 g (20% excess) 4-nonylphenyl uncosa(oxyethylene)-3-sulfomethyl potassium salt in 10 mL CHCl3. The mixture is stirred at 25 °C for 24 h. The acrylate nanofluid product is added to methanol and DI water to remove KCl and excess sulfonate salt, and dried in a vacuum oven at 25 °C (yield: 1.97 g; 98.5%).
The product was stored in a desiccator until used, to minimize water adsorption. Prior to measuring bulk properties using TGA and DSC, samples of nanofluid were heated in vacuo at 100 °C for several hours or more to remove any adsorbed water.
A comparison filler derived from the same Ludox SM nanosilica core and the same acryloylpropyltrimethoxysilane, as illustrated in Scheme 2, was prepared. An aqueous suspension of Ludox SM (7.0 mL, 3.22 g SiO2) is prepared by diluting with 40 mL deionized (DI) H2O. Then the acrylate reagent (CH3O)3Si(CH2)3CO2C2H3 (3.0 g, 0.013 mol) in 9.5 mL methanol is added slowly to the aqueous suspension with stirring at 23.8 °C and stirring is continued for 48 h. The product suspension was centrifuged to remove solvent. The product is then washed with DI water three times and with methanol two times, and then dried in vacuo at 24 °C. TGA analysis indicated the product was 36.6% (w/w) organic and 73.4% silica. The resulting product is soluble in DMF.
 | ||
| Scheme 2 Synthetic scheme for the acrylate modified nanosilica. | ||
Film formation
Coatings were made by dissolving the acrylate sulfonate nanofluid at different weight ratios with THPETA without any added solvent. A photoinitiator, 2,2-dimethoxy-2-phenylacetophenone (DMPA), was used at 1% (by weight of total reagents). Dissolution was achieved by vigorous mixing using a mechanical shaking device. Coatings on clean glass microscope slides (1′′ × 3′′) were made by using the 1 mil slot of a small drawdown bar. After the actual coating was done, the slides were then exposed using a Fusion UV (Gaithersburg, MD) F300S/F300SQ apparatus. Coatings were exposed 20 times at a belt speed setting of 30 with an H bulb. Clear and highly cured samples were obtained in each case.Comparison coatings of the acrylate modified nanosilica were prepared by preparing a 20% (w/w) suspension (solution) of the nanosilica in DMF, and then using this suspension to prepare a series of solutions with THPETA at silica/THPETA weight ratios of 0.01, 0.02, and 0.05. The photosensitizer DMPA was added at a 1% (w/w) level with respect to the total (non-DMF) organic phase. Photosensitized UV irradiation was then used as described above to make clearcoats on microscope slides.
Measurement methods
Transmission electron microscopy (TEM) was done using a JEOL 3011 (Peabody, MA).Image analysis for particle sizing was done using a binning/spreadsheet program built around the freeware “ImageJ”.20 The area of each particle image was converted to an equivalent circular diameter. These equivalent circular diameters were collected in bins of 0.5 or 1 nm width and used to derive normalized number frequency and volume frequency distributions. Various moments were then calculated by integrating the respective operator over one or the other of these normalized distributions.
Differential scanning calorimetry (DSC) was done using a TA Instruments (New Castle, DE) Q2000 instrument. Thermogravimetric analysis (TGA) was done using a TA Instruments Q200 instrument.
Density measurement was done by pycnometry. Estimates of acrylate content were obtained by the Wijs iodide/thiosulfate titration method.21
Nanoindenting measurements for hardness and modulus were done using a NanoIndenter XP by MTS Systems Corp. (Oak Ridge, TN). The nano-indentation method utilized a Berkovich tip, in continuous stiffness mode, to a depth of 5 μm. Each sample was tested in 9 different locations in a 3 × 3 square matrix with 500 μm between each indentation site. Hardness moduli (H) were determined by the load (P) applied to the specimen divided by the contact area projected on the original surface (A), so that H = P/A at a given depth (displacement). The variation of tip area A(z) with depth (z) was calibrated with fused quartz.
Storage moduli were determined by dynamic mechanical analysis. An additional low magnitude oscillating force, F(t) = F0 exp (iωt), was superimposed onto the loading force (P) with a resulting displacement, z(t) = z0 exp (i[ωt − φ]), where F0 is the force amplitude, ω is the harmonic frequency, z0 is the displacement amplitude and φ is the phase angle (the angle by which the displacement lags behind the driving force). Force and displacement amplitudes and phase angle are measured by the nanoindentation system. Contact stiffness (S) was determined by:
| S = F0/z0 cos φ + mω2 − Ks, |
| Eeff = S/(2β)(π/A)1/2 |
| 1/Eeff = (1 − ν2)/E + (1 − νi2)/Ei |
Scratch testing was done using the NanoIndenter XP apparatus. A progressively increasing load (from 0 to 200 mN) was applied to each sample while at the same time scratching 400 μm across the sample at 40 μm s−1, using a conical shaped tip with a tip radius of 1 μm.
Atomic force microscopy (AFM; Digital Instruments Multimode Scanning Probe Microscope, MMSPM) with a Nanoscope IIIa Controller and Extender Module (Veeco Metrology Group) was done in tapping mode. The probes used were all Veeco model RFESP with a nominal resonant frequency of 75 kHz and a nominal stiffness of 3 N m−1.
Results
Nanosilica
The Ludox SM nanosilica dispersion was diluted and spotted on TEM grids for particle size analysis. Image analysis of 4926 particles from a series of TEM images (see Fig. S1 in the ESI†) was done to compose the resulting normalized particle size distributions illustrated in Fig. 1. The first moments of each distribution yielded number and volume average diameters of 9.7 nm and 11.1 nm, respectively. The quotient of these averages yields a polydispersity index (PDI) of 1.12. This value and the strongly overlapping distributions in Fig. 1 indicate that this nanosilica had low polydispersity.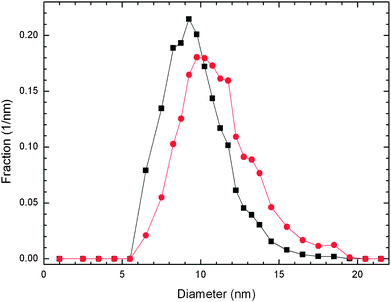 | ||
| Fig. 1 Normalized number frequency (■) and volume frequency (●) particle size distributions for the nanosilica prior to surface modification. | ||
The surface to volume ratio moment was calculated from the normalized volume frequency distribution, 〈6/d〉 = 0.541 nm−1, where d is particle diameter. The nanosilica density was determined from analytical ultracentrifugation as 2.196 g cm−3. The quotient of these two quantities yields the specific surface area, 246 m2 g−1silica. Analytical ultracentrifugation (AUC) of the nanosilica dispersion (illustrated in Fig. S2 of the ESI†) yielded particle size distributions based on hydrodynamic diameter that were quantitatively similar to the number average distribution pictured in Fig. 1. Both the number average distribution and the AUC distributions peak a little above 9 nm.
Characterization of acrylate nanofluid
The DSC illustrated in Fig. 2 shows a glass transition at about −64 °C and a broad melting endotherm over −15 to 25 °C. The solidification exotherm over −12 to −40 °C is doubly humped; this humped structure suggests the possible existence of polymorphism, but no further evidence is available. These thermal aspects (glass transition and hysteresis in melting/solidification) are what we would expect a classical fluid to exhibit, except that the melting and solidification ranges are much wider than we would otherwise anticipate. The lack of perceptible endothermic activity on the first and second heating cycles above 100 °C confirms the efficacy of dehydration in vacuo at 100 °C in removing any adsorbed water or methanol.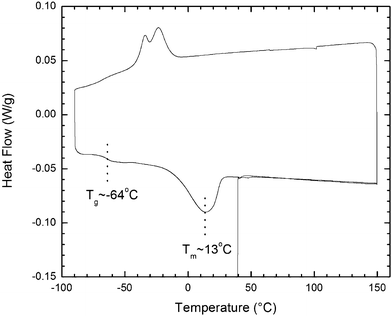 | ||
| Fig. 2 DSC of the acrylate-modified nanofluid; cyclic scan at 10 °C min−1 beginning at 40 °C, to 150 °C, to −90 °C, and finally to 150 °C. | ||
Thermogravimetric analysis (TGA; Fig. S3 in the ESI†) was done from room temperature up to 580 °C under a stream of nitrogen. The lack of measureable decomposition below 120 °C corroborates the removal of adsorbed water by heating in vacuo at 100 °C before testing. The quaternary and acrylate surface groups partially decomposed to leave a residue at 580 °C corresponding to a weight fraction of 0.369. This weight fraction indicates that about half the ammonium groups condensed onto the silica particle surfaces (∼1100 per particle) and about half produced core-free self-condensation products that washed out in the DI water washing steps. Titration for acrylate groups using the Wijs method indicated about 100 acrylate groups were incorporated per particle. A surface “coverage” of about 1200 organosilane groups per particle (per 387 nm2) corresponds to only 0.32 nm2 per silane group. This is too high a surface density for a monolayer, and it is more realistic to think of this outer shell as comprising multilayers of surface groups. An appropriate model has been developed by Bauer and co-workers16,17 for explaining the surface modification of similar silicas with the methacrylate analogue of our acrylate reagent. Rather than an idealized model of all three Si–O bonds coordinating the surface groups trigonally to the core silica surface, ladder structures of surface groups grow out from the surface.
It is this outer organic shell and its ionic liquid-like composition that transforms the nanosilica into a nanofluid. Archer and co-workers have shown in a series of rheology studies of solvent-free nanofluids (nano ionic materials, NIMS) that the storage modulus of such core/shell nanofluids decreases with increasing shell volume fraction.22–25
The multilayer nature of this “shell”, while not shown directly in these studies, is supported by various studies of the self-condensation of other trimethoxysilane reagents.26–30 These studies show that the most regular reaction products in the absence of nanosilica substrates are POSS (polysilesquioxane) derivatives and open POSS structures. Interfacial forces tend to drive the reagents to the nanosilica surfaces where opportunistic coupling with a surface hydroxyl will lead to the attachment of either of the surface modifying reagents. Subsequent condensation with other trimethoxysilanes is expected to lead to polyhedral oligosilesquioxanes,26,27,31 and to dimers, ladder-like tetrameric rings and higher order ring structures.30 Very recently32 it has been shown that the autocondensation of the quaternary chloride trimethoxysilane utilized here followed by the same ion exchange process described above produces core-free nanofluids of considerably lower viscosity and storage modulus of only 0.15 Pa with a density of about 1.1 g cm−3. If we assume a shell density of 1.1 g cm−3 we calculate a final particle density of 1.35 g cm−3, which compares favorably with the measured density of 1.36 g cm−3.
Characterization of acrylate modified nanosilica
Thermogravimetric analysis (TGA) was done from room temperature up to 530 °C under a stream of nitrogen (see Fig. S4 in the ESI†). The acrylate surface groups partially decomposed to leave a residue at 530 °C corresponding to a weight fraction of 0.634. This weight fraction indicates that about 2600 acryloxyoylpropylsilyl groups per particle condensed onto the silica particle surfaces. Such a number can only be accommodated by the formation of “multilayer” chains of groups, as described by Bauer and co-workers.16,17Resin formulation and coating
Resin coatings were formulated at low and high levels of acrylate sulfonate nanofluid. A series of coatings containing 0 to 5% (w/w) of nanofluid was made to examine effects of low doping. A comparison control coating series was made using the core silica with only acrylate surface modification at 1, 2, and to 5% (w/w) silica in the tetraacrylate, THPETA. Another series containing 0, 50, 60, and 80% (w/w) of nanofluid was made to examine the material properties of predominately nanofluid-based resins.Storage and hardness moduli
Storage moduli for 0–5% (w/w) nanofluid–THPETA resins, several weeks and 10 months after UV curing, are illustrated in Fig. 3. The moduli vary with depth, nanofluid content, and age. In Fig. 3 we illustrate coating (film) moduli as a function of nanofluid composition over 0 to 5% (w/w), as a function of penetration depth into the film (100 to 3000 nm), and at aging times of several weeks after curing and 10 months after curing (Fig. 3(a) and (b), respectively). The peak of the variations in Fig. 3(a) appears at about 2% (w/w) nanofluid and at the greatest penetration depth, although the 100 nm penetration depth results show a small depression at 2% (w/w). With substantial further aging, as seen in Fig. 3(b), the variation with penetration depth over 2–5% (w/w) nanofluid decreases, and the peak of the variations moves to a composition of 1% (w/w) nanofluid and becomes much sharper. This compression of the differences found at different penetration depths with aging is most likely due to slow molecular relaxation. The apparent relative softness of the surface can be attributed to the expected lower coordination of THPETA and nanofluid at the surface. Some of these variations, however, may be due to crosslinking variations with depth as a result of self-attenuation of the incident UV, and perhaps also due to post curing photoinitiation or thermal initiation.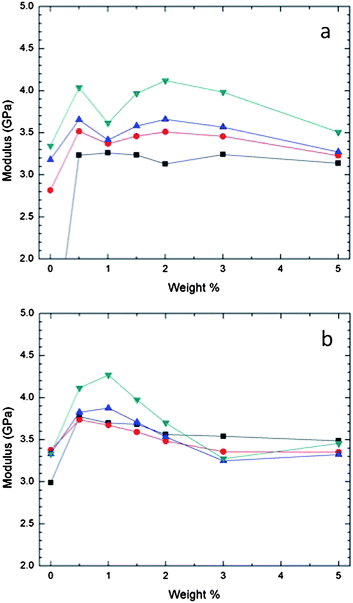 | ||
| Fig. 3 Storage modulus by nanoindentation of THPETA–SiO2–acrylate resins as a function of nanofluid content at various penetration depths: (a) after curing for peak in several weeks and (b) after curing for 10 months. Results at different penetration depths are presented: ■, 100 nm; ●, 1000 nm; ▲, 2000 nm; and ▼, 3000 nm. | ||
In Fig. 3 after both aging periods we do not see a net increase in modulus with increasing nanofluid; we see an initial increase at most penetration depths, but this increase then recedes with further additions of nanofluid. In Fig. 4 we illustrate an analogous nanocomposite formulation, except that the nanosilica was only surface functionalized with silane propanol groups. In this system we observe the classically expected result of increasing modulus with increasing nanofiller content. Also, in this system the modulus appears to increase with increasing penetration depth.
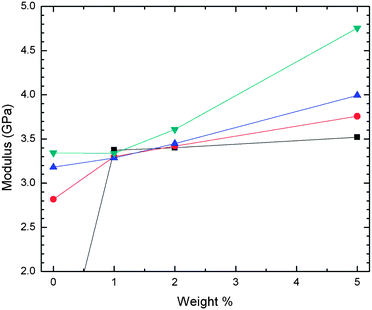 | ||
| Fig. 4 Storage moduli by nanoindentation of THPETA–SiO2 nanocomposite resins as a function of silica content at various penetration depths. Results at different penetration depths are presented: ■, 100 nm; ●, 1000 nm; ▲, 2000 nm; and ▼, 3000 nm. The 100 nm result at 0% is 0.5 GPa. | ||
Hardness is depicted in Fig. 5 for the nanofluid series 1, 2, and 5% (w/w) and for the nanosilica series also at 1, 2, and 5% (w/w) and as a function of penetration depth. The nanofluid samples appear softer close to the surface, over 100–200 nm in penetration depth, while the nanosilica samples appear harder. At greater depths the 1 and 2% (w/w) samples of each type appear to converge towards one another as the penetration depth increases. The 5% w/w samples differ much more, although they also mirror one another about an imaginary reflection axis at about 0.2 GPa.
 | ||
| Fig. 5 Hardness as a function of penetration depth for 1 (■, □), 2 (●, ○), and 5% (w/w) (◆, ◇) acrylate sulfonate nanofluid (■, ●, ◆) in acrylate resin and for the acrylate-modified nanosilica (□, ○, ◇) in acrylate resin. | ||
Storage modulus (a) and hardness (b) at high nanofluid loading are illustrated in Fig. 6. The THPETA-only composition is the 0% (w/w) acrylate sulfonate nanofluid control. This control sample steeply increases in modulus over the top 500 nm of sample. After this depth the modulus continues to increase, but much more slowly. The 50% (w/w) sample appears to have a steeper rise in modulus with penetration than the control until a depth of 400 nm is reached, where it levels off at 1.7 GPa until a depth of 2000 nm is reached. After this point the modulus increases gradually with penetration. The modulus curve for the 60% (w/w) sample is similar but much suppressed relative to the 50% (w/w) curve, and the modulus curve for the 80% (w/w) sample is even more suppressed. Similar curve shapes are seen for the hardness measurements in Fig. 6(b). At these high loadings it can unequivocally be concluded that the modulus and hardness decrease with increasing loading.
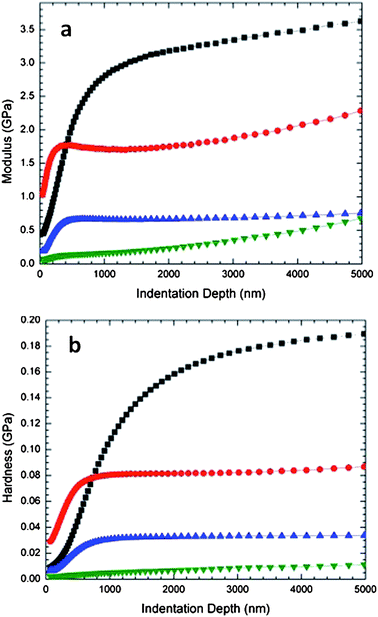 | ||
| Fig. 6 Storage modulus (a) and hardness (b) for nanofluid acrylate sulfonate series at high loading: 0% (■); 50% (w/w; 45% v/v) (●); 60% (w/w; 56% v/v) (▲); and 80% (w/w; 77% v/v) (▼). | ||
Thermal effects of high loading
The DSC in Fig. 7 illustrates how high loading of the silica nanofluid impacts the resin thermal properties. The reference resin of THPETA is essentially featureless over the −100 to 50 °C interval. THPETA as the liquid monomer is reported19 to have a Tg at 2 °C; it appears this hard resin is devoid of a glass transition. The 50% nanofluid composite resin exhibits two thermal features absent in the control. First, a distinct glass transition appears at about −55 °C. This is 9 °C higher than in the pure nanofluid (Fig. 2). Second, a slight exothermic signal can be seen at about 12 °C. This exothermicity appears related to the melting endotherm exhibited by the nanofluid. These features are also seen in the 60% nanofluid sample, except that the glass transition is more intense and the exothermic transition appears stronger and more diffuse over the 0–25 °C interval. Finally the 80% nanofluid composite exhibits an even stronger glass transition, and the exothermic transition is comparable to that of the 60% nanofluid sample, but shifted higher to the 8–34 °C interval.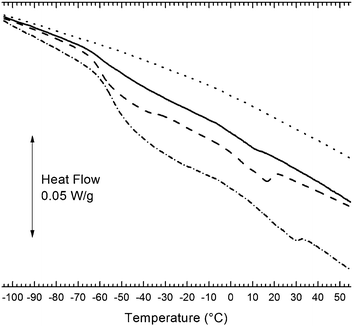 | ||
Fig. 7
DSC of THPETA resins formulated with 0% (⋯), 50% (![[thick line, graph caption]](https://www.rsc.org/images/entities/char_e117.gif) ), 60% ( ), 60% (![[dash dash, graph caption]](https://www.rsc.org/images/entities/char_e091.gif) ), and 80% (w/w) ( ), and 80% (w/w) (![[dash dot, graph caption]](https://www.rsc.org/images/entities/char_e090.gif) ) acrylate nanofluid. ) acrylate nanofluid. | ||
These data suggest that the glass transition of the composite emanates from the nanofluid particles but is shifted to slightly higher temperature due to constraints from polymerization in the (through the) corona of the nanofluid inclusions. The magnitude of the enthalpic step (glass) transition appears to scale with the nanofluid content. The exothermic behavior in the 0–20 °C region appears, on the other hand, to reflect melting of the nanofluid inclusions, and suggests, therefore, that as loading becomes very high, clusters must have formed that are meltable.
Scratch resistance
A progressively increasing load (from 0 to 200 mN) was applied to each sample while at the same time scratching 400 μm across the sample at 40 μm s−1, using a conical shaped tip with a tip radius of 1 μm. The data taken during the scratch tests revealed critical loads at which the mode of damage increased in severity from plowing to chipping. These critical loads are graphed in Fig. 8. The critical loads agreed nicely with what is seen in the optical images of the scratches. They show a decreasing trend with increasing concentration. This trend indicates that the higher the concentration of incorporated nanofluid, the lower the load needed to cause severe damage while scratching.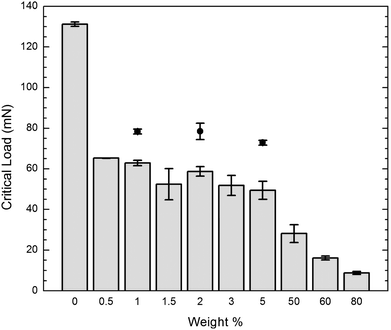 | ||
| Fig. 8 Critical load for onset of chipping from plowing as a function of nanofluid composition. | ||
Optical micrographs of the actual scratches are illustrated in Fig. 9(a). In the 0% control, at 125–130 mN there is a transition from marring (plowing), to chipping and cracking. The very fine lines seen to precede and to follow the trenches illustrated correspond to marring we call plowing.
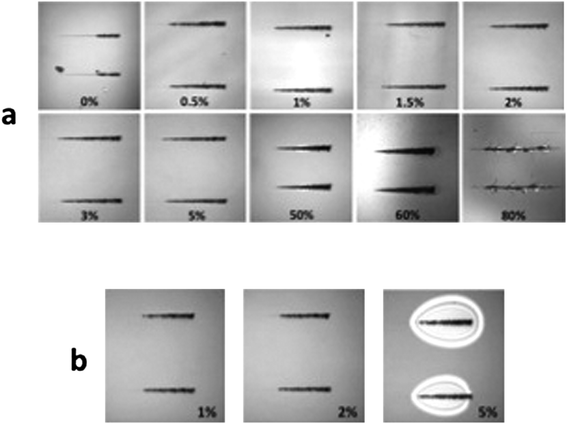 | ||
| Fig. 9 Optical micrographs of scratches made in (a) testing acrylate sulfonate nanofluid–THPETA resins; and (b) acrylate surface modified nanosilica–THPETA resins. The weight percent nanofluid in each formulation is indicated in each frame. | ||
In the 50% sample, cracking begins at 25 mN, and the scratch becomes optically visible under the microscope. At 72 mN the cracking becomes more severe. In the 60% sample, the mar becomes rough at 7.7 mN; at 15.6 mN cracking starts and the scratch becomes visible; at 51 mN, there is severe cracking. In the 80% sample, scratching takes place down to the substrate almost immediately; the onset of chipping occurs at about 9 mN.
In this series of formulations the effect of even a small amount of nanofluid, 0.5% (w/w), decreases the inherent matrix scratch resistance by 50%. There is, however, only minor additional effect as the loading is increased to 5%. This same series of loadings had a negligible effect on storage modulus and hardness. The usual effect of added silica on such nanocomposites, and on THPETA itself, is an increase in abrasion resistance with increasing loading.
A similar scratch analysis of the 1, 2, and 5% comparison coatings of acrylate surface modified nanosilica resulted in critical loads of 78 ± 2, 78 ± 4, and 73 ± 23 mN, respectively, for the onset of cracking (from marring/plowing). Optical micrographs of the resulting scratches are illustrated in Fig. 9(b). The cured film thicknesses were 50–60 μm for the 1% and 2% coatings and 20–30 μm for the 5% coating.
Surface morphology
We also imaged the surface of the samples using an atomic force microscope (AFM) in tapping mode. The images presented below of the 2% sample were representative of most of the coatings at this scale (200 nm × 200 nm × 4 nm). The most prominent surface features are seen in both the elevation (left) and phase (right) images of Fig. 10. These features appear to be isolated and small clusters of nanofluid particles. Because of the combination of acrylate and didecylmethyl ammonium surface groups, these nanofluid particles are expected to be surface active at the resin precursor/air interface. The largest elevations shown are about 4.0 nm, and such an elevation corresponds to the approximate radius of these nanofluid nanoparticles. Similar images and results were seen for the 0.5%, 1%, 3%, and 5% samples (see Fig. S5–S8 in the ESI†).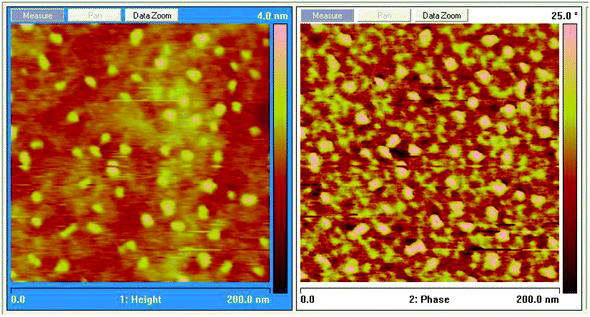 | ||
| Fig. 10 AFM tapping mode images (left, elevation and right, phase) of 2% (w/w) nanofluid in THPETA after UV curing. | ||
This apparent surface activity of these nanofluid particles at the tetraacrylate/air interface prior to curing is a simple manifestation of the amphiphilic nature of these nanoparticles. A sufficient condition for such interfacial activity is that the particles be incompletely wetted by the tetraacrylate phase.33,34
Similar AFM topographical data for the 1% and 2% comparison and “conventionally surface modified” acrylate nanosilica–THPETA resin coatings (see Fig. S9 and S10 in the ESI†) show that these nanoparticles are surface active, as should be expected, and that the peak elevations appear to be about 3 nm. Moreover, comparison of the elevation and phase images indicates distinctly different views. This comparison, therefore, suggests the nanosilica is much more aggregated at the interface than is apparent in the nanofluid sample of Fig. 10. The degree of surface activity of the acrylate-modified silica appears significantly less than that of the nanofluid in Fig. 10.
An AFM analysis of the elevation image of a control coating only of THPETA resin containing no nanofluid nor nanosilica (see Fig. S11 in the ESI†) indicates that the roughness variations of the film maximize at about 1.5 nm. The corresponding phase image suggests a fairly homogeneous surface structure.
An AFM analysis of a coating loaded to 50% (w/w) nanofluid (see Fig. S12 in the ESI†) shows the nanofluid is highly surface active, but it is also highly aggregated. The elevation analysis indicates maximum elevations approaching 4 nm. Some individual clusters appear to have dimensions of 30–60 nm. The corresponding phase image does not appear to highlight individual particles or aggregates and bears strong resemblance to the control phase image of the matrix polymer surface (Fig. S11 in the ESI†). The phase appears to vary by up to 7° in both of Fig. S11 and S12†. This similarity suggests the clusters are coated with the THPETA.
Discussion
Core nanosilica
The image analysis of the core nanosilica produced number average and volume average size distributions that exhibit very low polydispersity. This analysis yields reasonable average diameters from both number (9.7 nm) and volume (11.1 nm) normalized distributions. It is also noteworthy that the analytical ultracentrifugation distributions peak at the same diameter, ∼9.3 nm, as the number frequency distribution.Model for nanofluid loading effects
A critical criterion for understanding nanofiller effects on mechanical properties is knowing whether or not good adhesion is obtained between the matrix and the nanoparticles. Decreases in storage moduli or Young's modulus upon composite formulation with inorganic fillers have been ascribed to disruption of crosslinking in the resulting resin and lack of adhesion between the matrix and the imbedded particulates.15,35,36 These kinds of effects are the primary driving forces behind using surface modified particulates. In these nanofluid/THPETA composites we believe we can discount poor adhesion and disrupted crosslinking, since the nanofluid particles are surface functionalized with acrylate groups. Although the surface density of acrylate functionality is much lower than a comparably sized spherical volume of THPETA, this difference has not had a negative effect on composites using methacrylate functionalized nanosilicas.16,17In Fig. 3(a) it appears the modulus is not very sensitive to the nanofluid content, while after aging as shown in Fig. 3(b) the modulus peaks at 1% (w/w) and then remains constant from 3% to 5% (w/w). These data are perhaps most interesting because of what they do not show. Most nanocomposites comprising surface modified nanoparticle fillers exhibit an increase in storage modulus with increasing amount of incorporated nanoparticle.15,37 Such expected behavior is demonstrated in Fig. 4 for the acrylate-modified nanosilica. The hardness modulus values in Fig. 5 increase with loading for the acrylate-modified nanosilica and decrease with loading for the nanofluid. The two sets of trends appear almost to mirror each other. The trends for the 1% and 2% loading levels appear to approach each other with increasing penetration depth. At 5% (w/w) loading, however, the modulus values are distinctly different over the entire range of penetration studied. The impact of extremely high loading of the nanofluid on storage and hardness moduli is shown in Fig. 6(a) and (b), respectively. Both types of moduli decrease dramatically with increasing loading.
Our understanding of why inorganic fillers increase storage and hardness moduli is based on the simple reasoning that if we add inorganic particulates with storage and hardness moduli much, much greater than those of the matrix polymer, the composite moduli increase. Rheology studies of a similarly composed nanofluid, but of one without any acrylate functionality, indicate storage moduli in the range of 5–30 kPa,32 5 orders of magnitude lower than the THPETA cross-linked matrix. Since the nanofluid material itself is a (viscous) liquid and has intrinsic moduli much lower than most matrix polymers, it is, therefore, logical to think the incorporation of nanofluid as filler would decrease the composite moduli.
Most extant models15 for effects of particulate fillers on moduli, such as the Einstein model and others, presume an increase in modulus with increasing volume fraction. Of all the quantitative models proposed to explain particulate filler effects on moduli, one of them that does not assume particulate moduli (Ep) to be greater than the polymer matrix moduli (Emat) is:
| Eresin = χpEpφp + Ematφmat |
| Eresin = Emat + (χpEp − Emat)φp |
With this model the effects of nanoparticle loading will be positive or negative or indifferent, depending on whether the quantity dEresin/dφp = (χpEp − Emat) is positive, negative, or about zero.
It appears that this simple mixture model does in fact qualitatively explain the nanofluid loading phenomena observed in Fig. 3, 5, and 6, as well as explaining the conventional results of Fig. 4. Just as has been found in applying the Einstein equation to suspension rheology, and then to nanoparticle loading effects on composite moduli, more complex models will be needed to explain the detailed behaviors seen at loadings in the range of 5–90%. In these higher ranges of loading, interparticle nanofluid interactions (particle–particle and multi-particle interactions) as well as nanofluid–matrix interactions must be considered.
Interfacial structure
The topographical AFM data indicate that the nanofluid disperses more uniformly than the acrylate surface modified nanosilica. This is perhaps a peculiarity of the differently modified particles and their respective compatibility with the THPETA monomer. However, the nanofluid particles would appear to be intrinsically more dispersible due to their ionic liquid like shell. Rather than assuming any significant charge repulsion between nanofluid particles, we consider these particles to be sterically stabilized. In the low dielectric constant monomer prior to photosensitized polymerization, the extent of counter ion dissociation is expected to be very low.The interfacial activity illustrated in Fig. 10 results from a composition that was 2% (w/w; 1.79% v/v) nanofluid. The surface concentration of nanofluid evident in Fig. 10 is slightly greater than 10% (v/v), indicating significant preferential interfacial segregation (5-fold relative to bulk). The degree of preferential segregation at high loading in the 50% (w/w) (or 45% v/v) composition (see Fig. S12 in the ESI†) appears much less, and image analysis (see Fig. S14–S17 in the ESI†) indicates the surface concentration of nanofluid particles is about 58% (v/v), indicating preferential surface segregation of 29%. This degree of preferential segregation is much less than the 500% exhibited at 2% (w/w) loading (Fig. 10).
The delamination obtained with two of the three comparison nanosilica (1% and 5%) coatings during AFM sample preparation and that seen during the scratch testing of the 5% film (Fig. 9) suggests these coatings are more brittle and have less adhesion than the corresponding nanofluid films. The differences in the critical loads for transitioning from plowing to chipping at low loading between the nanofluid-loaded and comparison coatings were much less than the differences between the unfilled control coating (0% loading) and either of the nanocomposite types. The chipping appears to be very similar among the two types of nanocomposites, with the nanofluid samples being slightly softer.
Anticipated future applications
The increasing magnitude of the Tg endothermic step with increasing nanofluid loading illustrated in Fig. 7 suggests one approach to modifying a nanocomposite Tg. The second, higher temperature endotherm may be another Tg, although it seems related to the underlying Tm of the nanofluid. The ensuing cross-linking may prevent actual melting, but as in many heterogenous polymers, there may be crystalline regions susceptible to melting, such as in PDMS.39 Such thermal transitions very likely affect intra-particle diffusional transport in the resin, which may be important for some applications.
Conclusions
We have demonstrated surface modification with two different functionalities via the sol–gel (trimethoxysilane hydrolysis) surface modification of nanosilica particles. Ion exchange of the chloride anion with a soft sulfonate anion produces a nanofluid that is a viscous liquid in the absence of any added solvent. This nanofluid was diluted with acrylate monomer (THPETA) to produce clear-coat resin precursors. Clearcoats were then produced by photoinitiation under UV irradiation. We have shown for the first time that addition of such nanofluids to a resin can result in marked softening, rather than the conventionally seen hardening upon forming nanocomposites from surface-reactive nanofillers. We also see significant decreases in storage modulus at high nanofluid loading, although the direction and magnitude of the effect will generally depend on loading and the other components present.We have shown that a simple mixture model can account for both modulus increases and decreases when formulating nanocomposites, depending on whether the added filler has moduli greater than or less than those of the matrix polymer. We have also demonstrated the possibility of increasing storage modulus while decreasing hardness (increasing toughness). Thus, such reactive nanofluids represent a new class of plasticizers.
Incorporation of very large amounts of reactive nanofluid has been demonstrated to yield thermoresponsive materials. Such high loading promises the potential of producing soft and compliant materials that may form new types of adhesives and sealants.
Detailed surface morphology analysis has shown that such nanofluid particles are surface active at the monomer/air interface. Such surface activity may also lead to a new approach to lubrication of polymer disks and other polymer surfaces.
Acknowledgements
We gratefully acknowledge Ms Antje Volker and Prof. Helmut Cölfen for the analytical ultracentrifugation results for Ludox SM. This work was also supported by WPAFB UTC Prime Contract FA8650-05-D-5807, Task Order BH Subcontract Agreement 06-S568-BH-C1, Army Research Laboratories Contract W911QX-06-C-0102, and the United States Navy (ONR Grant Award No. N00014-04-1-0763). The experimental part of this work was further supported by instrumentation grants from the United States National Science Foundation (Grant Nos. DMR-0414803 and CHE-0443444).References
- A. B. Bourlinos, R. Herrera, N. Chalkias, D. D. Jiang, Q. Zhang, L. A. Archer and E. P. Giannelis, Adv. Mater., 2005, 17, 234–237 CrossRef CAS.
- S. C. Warren, M. J. Banholzer, L. S. Slaughter, E. P. Giannelis, F. J. DiSalvo and U. B. Wiesner, J. Am. Chem. Soc., 2006, 128, 12074–12075 CrossRef CAS.
- A. B. Bourlinos, E. P. Giannelis, O. Zhang, L. A. Archer, G. Floudas and G. Fytas, Eur. Phys. J. E: Soft Matter Biol. Phys., 2006, 20, 109–117 Search PubMed.
- A. B. Bourlinos, A. Stassinopoulos, D. Anglos, R. Herrera, S. H. Anasrasiadis, D. Petridis and E. P. Giannelis, Small, 2006, 2, 513–516 CrossRef CAS.
- R. Rodriquez, R. Herrera, L. A. Archer and E. P. Giannelis, Adv. Mater., 2008, 20, 4353–4358 CrossRef CAS.
- Y. Zheng, J. Zhang, L. Lan, P. Yu, R. Rodriguez, R. Herrera, D. Wang and E. P. Giannelis, ChemPhysChem, 2010, 11, 61–64 CrossRef CAS.
- D. P. Liu, G. D. Li, Y. Su and J. S. Chen, Angew. Chem., Int. Ed., 2006, 45, 7370–7373 CrossRef CAS.
- H. M. Xiong, W. Z. Shen, Z. D. Wang, X. Zhang and Y. Y. Xia, Chem. Mater., 2006, 18, 3850–3854 CrossRef CAS.
- Y. Lei, C. Xiong, H. Guo, J. Yao, L. Dong and X. Su, J. Am. Chem. Soc., 2008, 130, 3256–3257 CrossRef CAS.
- J. Wen and G. L. Wilkes, Chem. Mater., 1996, 8, 1667–1681 CrossRef CAS.
- K. H. Haas, Adv. Eng. Mater., 2000, 2, 571–584 CrossRef CAS.
- S. Shokoohi, A. Alefazar and R. Khosrokhavar, J. Reinf. Plast. Compos., 2008, 27, 473–485 CrossRef CAS.
- K. P. Unnikeishnan and E. T. Thachil, Des. Monomers Polym., 2006, 9, 129–152 Search PubMed.
- J. Moczo and B. Pukanszky, J. Ind. Eng. Chem., 2008, 14, 535–563 Search PubMed.
- S. Y. Fu, X. Q. Feng, B. Lauke and Y. W. Mai, Composites, Part B, 2008, 39, 933–961 CrossRef.
- F. Bauer, H. J. Gläsel, E. Hartmann, E. Bilz and R. Mehnert, Nucl. Instrum. Methods Phys. Res., Sect. B, 2003, 208, 267–270 CrossRef CAS.
- F. Bauer, H. J. Gläsel, U. Decker, H. Ernst, A. Freyer, E. Hartmann, V. Sauerland and R. Mehnert, Prog. Org. Coat., 2003, 47, 147–153 CrossRef CAS.
- F. Bauer, R. Flyunt, K. Czihal, M. R. Buchmeiser, H. Langguth and R. Mehnert, Macromol. Mater. Eng., 2006, 291, 493–498 CrossRef CAS.
- Technical Data Sheet: SR494, Ethoxylated (4) Pentaerythritol Tetraacrylate, Sartomer, http://www.sartomer.com/wpapers/2073.pdf, accessed 5 February 2011 Search PubMed.
- Image J—Image Processing and Analysis in Java, accessed 29 June 2010, http://rsbweb.nih.gov/ij/ Search PubMed.
- N. B. Kyriakidis and T. Katsiloulis, J. Am. Oil Chem. Soc., 2000, 77, 1235–1238 CrossRef CAS.
- A. B. Bourlinos, S. R. Chowdhury, R. Herrera, D. D. Jiang, Q. Zhang, L. A. Archer and E. P. Giannelis, Adv. Funct. Mater., 2005, 15, 1285–1290 CrossRef CAS.
- R. Rodriguez, R. Herrera, A. B. Bourlinos, R. Li, A. Amassian, L. A. Archer and E. P. Giannelis, Appl. Organomet. Chem., 2010, 24, 581–589 CrossRef CAS.
- P. Agarwal, H. Qi and L. A. Archer, Nano Lett., 2010, 10, 111–115 CrossRef CAS.
- J. L. Nugent, S. Y. Moganty and L. A. Archer, Adv. Mater., 2010, 22, 3677–3680 CrossRef CAS.
- L. Matejka, O. Dukh, D. Hlavata, B. Meissner and J. Brus, Macromolecules, 2001, 34, 6904–6914 CrossRef CAS.
- C. V. Santilli, V. H. V. Sarmento, K. Dahmouche, S. H. Pulcinelli and A. F. Craievich, J. Phys. Chem. C, 2009, 113, 14708–14714 CrossRef CAS.
- S. Shen, D. Hu, P. Sun, X. Zhang and A. N. Parikh, J. Phys. Chem. B, 2009, 113, 13491–13498 CrossRef CAS.
- S. Shen, P. Sun, W. Li, A. N. Parikh and D. Hu, Langmuir, 2010, 26, 7708–7716 CrossRef CAS.
- M. Maly, P. Posocco, M. Fermeglia and S. Pricl, Mol. Simul., 2008, 34, 1215–1236 CrossRef CAS.
- T. A. Tereshchenko, A. V. Shevchuk, V. V. Shevchenko, S. V. Snegir and V. A. Pokrovskii, Polymer Sci., 2006, 48, 1248–1256 Search PubMed , original Russian text.
- D. Chojnowski, MS thesis, Eastern Michigan University, Ypsilanti, MI, 2011.
- B. P. Binks and J. H. Clint, Langmuir, 2002, 18, 1270–1273 CrossRef CAS.
- P. A. Kralchevsky, I. B. Ivanov, K. P. Ananthapadmanabhan and A. Lips, Langmuir, 2005, 21, 50–63 CrossRef CAS.
- F. Danusso and G. Tieghi, Polymer, 1986, 27, 1385–1390 CrossRef CAS.
- Z.-P. Fang and Q.-L. Hu, Angew. Makromol. Chem., 1999, 265, 1–4 CrossRef CAS.
- M. Mauger, A. Dubault and J. L. Halary, J. Mater. Sci., 2006, 41, 8284–9294 CrossRef CAS.
- M. Rahman and C. S. Brazel, Polym. Degrad. Stab., 2006, 91, 3371–3382 CrossRef CAS.
- D. Fragiadakis and P. Pissis, J. Non-Cryst. Solids, 2007, 353, 4344–4352, DOI:10.1016/j.jnoncrysol.2007.05.183.
- A. B. Bourlinos, S. R. Chowdhury, D. D. Jiang, Y.-U. An, Q. Zhang, L. A. Archer and E. P. Giannelis, Small, 2005, 1, 80–82 CrossRef CAS.
- L. A. Archer. L. Olenick, J. L. Nugent, and A. M. E. Corona, WO 2010/083041 (A1), 22 July 2010.
Footnotes |
| † Electronic supplementary information (ESI) available. See DOI: 10.1039/c1py00065a |
| ‡ Present address: College of Materials Science & Engineering, South China University of Technology, Guangzhou 510640, P. R. China. |
| This journal is © The Royal Society of Chemistry 2011 |

