DOI:
10.1039/C1PY00059D
(Paper)
Polym. Chem., 2011,
2, 2052-2061
Synthesis and characterization of molecularly imprinted polymer of N-maleoylchitosan-grafted-2-acrylamido-2-methylpropanesulfonic acid and its controlled delivery and recognition of bovine serum albumin
Received
2nd February 2011
, Accepted 21st May 2011
First published on 9th June 2011
Abstract
In this study a novel molecularly imprinted polymer matrix, namely protein-imprinted N-maleoylchitosan-grafted-2-acrylamido-2-methylpropanesulfonic acid polymer (MIP) matrix was prepared by using bovine serum albumin (BSA) as a template. The characteristics of the MIP were investigated using FTIR, SEM, XRD and Zeta Potential Analyses. The effects of monomer to template ratio, cross linking density, porogen, pH and ionic strength on the loading of BSA into the MIP were investigated. The adsorption studies showed that the MIP exhibits good recognition for BSA, as compared to non-imprinted polymer (NIP). The experimental adsorption isotherms of BSA onto MIP and NIP were determined and well fitted by Sips model with a maximum binding capacity of 113.51 mg g−1 for MIP and 76.39 mg g−1 for NIP. A pseudo-second-order kinetic model adequately described the kinetic rate in comparison to a pseudo-first-order model. In vitro release profiles of model drug from the MIP were investigated in physiological buffered solution using a UV/vis spectrophotometer. In addition, the drug release mechanism was analyzed by fitting the amount of drug released into Peppa's potential equation.
1. Introduction
Molecular imprinting is recognized as a powerful technique for the synthesis of tailor-made molecular recognition materials by co-polymerizing suitable functional monomers in the presence of desired template molecules.1 Molecularly imprinted polymers (MIPs) have attracted considerable interest from scientists and engineers because of their advantages like high stability, specific recognition, and ease of mass preparation. MIPs have been widely applied in number of areas including liquid chromatography (as a stationary phases for separation), sensing elements in sensors, artificial antibodies in immunoassays, capturing matrices in solid phase extraction, and heterogeneous catalysts.2 With the advances in protein chemistry and the increased understanding of protein recognition, researchers are attempting to construct completely synthetic polymeric materials that can specifically bind target molecules. Such materials can have applications ranging from chromatography to controlled drug delivery.
Chitosan (CTS), a biopolymer, is the deacetylated product of chitin. Due to its biodegradability, biocompatibility and avirulence, CTS has been used in many biomedical applications. The properties of high mechanical strength, hydrophilicity, good adhesion and non-toxicity of CTS allow it to be used as food additive, anticoagulant and wound healing accelerator.3 Due to its positive charges at physiological pH, CTS is also bioadhesive, which increases retention at the site of application. But CTS has some drawbacks, it is only soluble in aqueous medium in the presence of a small amount of acid such as acetic acid and its mechanical properties are not readily suitable for some biomedical applications. Also, the toxicity of chitosan to some organisms has been reported, associated with its bacteriostatic effect.4 These drawbacks have raised some concerns about using CTS as a fully biocompatible polymer. As a result many researchers have tried to modify its properties without compromising the viability of future use in living organisms. Graft copolymerization of CTS is a common way to improve pore size, mechanical strength, chemical stability, hydrophilicity and also biocompatibility. 2-Acrylamido-2-methylpropanesulfonic acid (AMPS) has received much attention in the past few years due to its strongly ionizable sulfonate group. AMPS dissociate completely throughout the pH range. In this work CTS was first converted into N-maleoylchitosan (MACTS) by treating with maleic anhydride. This modification increases hydrophilicity of CTS and helps to copolymerize with AMPS in the presence of BSA (as a template). Thus MIP derived from AMPS and CTS exhibits pH-dependent release of drug molecules. The resulting MIP was characterized by FTIR, SEM, XRD and zeta potential analysis and the adsorption capacity, selectivity and controlled/sustained release of the MIP were also evaluated.
2. Materials and methods
2.1. Materials
CTS and AMPS were obtained from Aldrich, USA. Maliec anhydride (MAH) and sodium dodecyl sulfate (SDS) were purchased from SRL, Mumbai and ammonium per sulfate (APS) was obtained from Central Drug House, New Delhi. Methylenebisacrylamide (MBA) and N,N,N,N-tetramethyl-ethylenediamine (TEMED) were supplied by Spectro Chem, Mumbai. BSA, hemoglobin, cytochrome c and lysozyme were obtained from S-D Fine Chem. The pH was adjusted by using sodium acetate buffer prepared from 1 M CH3COOH (28.30 mL) and 0.3M CH3COONa (78.33 mL). Distilled water with specific conductivity less than 1 μohm cm−1 was used throughout the study. All other chemicals used in the study were analytical grade.
2.2. Methods
2.2.1. Preparation of MACTS.
MACTS was prepared as reported elsewhere.5 Typically, CTS (3.0 g) was dissolved in 3 mL CH3COOH containing 150 mL ethanol and 150 mL water and stirred well for 10 min using magnetic stirrer. Then 150 mL MAH (0.1 M) dissolved in ethanol was added into the solution drop wise for 2 h at 65 °C. The reaction mixture was allowed to set for another 8 h at 65 °C with occasional stirring. The reaction mixture was then cooled at room temperature and precipitated in excess of acetone filtered to remove the solvent and then resultant MACTS was washed with acetone to remove excess reagents. Finally the product was dried at 40 °C.
2.2.2. Preparation of prepolymerization complex and graft copolymerization of AMPS.
Exactly 0.00126 g AMPS, 0.02 M chloroform and 0.05 g BSA were dissolved in a 15.0 mL sodium acetate buffer (0.01M) and put into 100 mL four-necked flask which was equipped with a mechanical stirrer and nitrogen inlet. The mixture was stirred continuously for 30 min. Then 3.0 g MACTS, 0.0075 g APS and 0.00186 g TEMED were added immediately and stirred well for 10 min. Finally the cross-linker, 0.00025 g MBA was added, stirred well. The mixture was stirred under nitrogen atmosphere for 3 h at 40 °C. The resultant MIP was filtered and washed with distilled water in order to remove the residual reagent and dried. The MIP was washed with 10% (v/v) acetic acid containing 10% (w/v) SDS to remove the embedded template (BSA). To remove the remnant SDS and acetic acid, the gel was extensively washed with distilled water. Scheme of preparation was shown in Fig. 1.
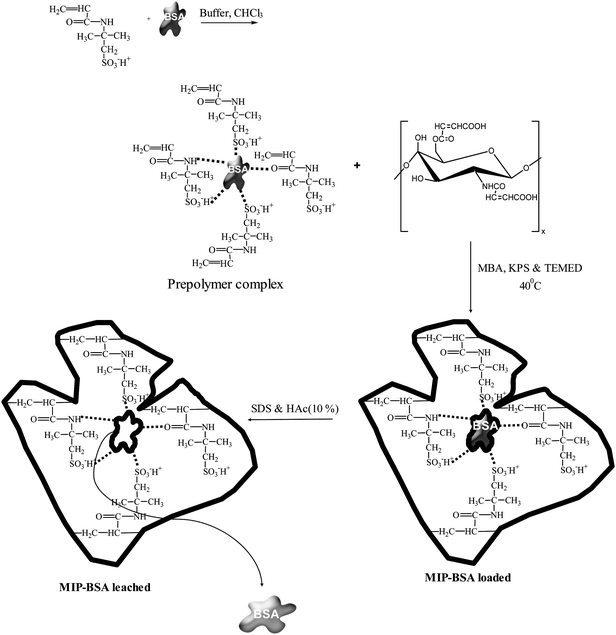 |
| | Fig. 1 Proposed reaction scheme of BSA-imprinted N-maleoylchitosan-grafted-2-acrylamido-2-methylpropanesulfonic acid polymer matrix. | |
The NIP was synthesized under the same conditions as MIP without the addition of BSA.
2.3. Instruments for characterization
The scanning electron microscopy (SEM) images of the MIPs were taken using a JEOL JSM 6390 LA Scanning electron microscope. A cryofreezing method was used for taking SEM photographs. An aluminum stub was placed into a glass Petri dish and covered with liquid nitrogen. When the liquid evaporated below the top of the stub, the polymer was placed onto the stub, and the gel was held in place to freeze. Because carbon tape will not stick to frozen aluminum, the frozen polymer was then transferred to a room temperature stub containing carbon tape and gently patted down. Immediately, the polymer was sputter-coated with a thin layer of gold. This technique was employed in order to “freeze” the pores of the polymer as they exist in their hydrated state. Polymer samples were subsequently imaged using a SEM at 15 kV with a working distance of 6 mm. FTIR Spectra of the MIP were recorded between 4000–400 cm−1 using a Perkin-Elmer FTIR spectrophotometer. XRD analysis of the samples was done on Rigaku Dmax IC model (Japan). The electrophoretic mobility measurements, were carried out using a Malwern Zetasizer 3000 HSA. All pH measurements were made on a μ processor Systronic pH meter (model 361). A temperature controlled water bath shaker (Lab line shaking incubator) with a temperature variation of ±1 °C was used for equilibrium studies. The absorbance measurements of protein solution were performed on a JASCO-530 UV-Visible Spectrophotometer.
Batch mode experiments were carried out to determine the loading of BSA and release profile at various pH values and ionic concentrations. The first set of the experiments was conducted to study the effect of pH on the loading of BSA on MIP matrix. For this 100 and 150 mg L−1 solution of BSA was prepared from the stock solution. 50 mL of each of the solution were taken in different stoppered bottles (100 mL) each containing 0.1 g of adsorbent. The pH of each sample was adjusted between 2.0 and 7.0 using 0.1 M HCl and NaOH solutions. The stoppered bottles containing the sample were kept for agitation time of 3 h in a water bath shaker to optimize the maximum loading capacity of MIP matrix. Maximum BSA imprinting was observed at pH 4.5 for the two concentrations and this was taken as the optimum pH for all subsequent adsorption experiments. The quantity of BSA present in the supernatant liquid was determined using a UV–Visible Spectrophotometer at a wavelength of 730 nm. Kinetics studies of BSA imprinting were also performed using 50, 100, 150 and 250 mg L−1 solution of BSA. Calculations were done and percentage of loading of BSA at different time, onto MIP matrix was found out. In order to study the effect of ionic concentration on loading capacity of BSA on the MIP, batch experiments were conducted at different concentrations of NaCl (0.02 to 0.1M) containing BSA solution were used.
2.5. Controlled release of BSA
Controlled release of BSA was carried out using 0.1g of 37.5 and 35.9 mg g−1 BSA loaded MIP and NIP respectively. Each sample of MIP and NIP were suspended in 100 ml physiological buffer solution at 37 °C and placed in an incubated shaker at 120 rpm. The physiological buffered solution was prepared according to the European Pharmacopeia 5.0,6 the composition of which was NaCl, 8.0 g; KCl, 0.2 g; CaCl2, 0.1 g; MgCl2, 0.1 g; Na2HPO4·12H2O, 3.18 g and KH2PO4, 0.2 g in 1 L distilled water. At predetermined time intervals, 3 ml of aliquots was withdrawn and the concentration of drug released was monitored by UV spectrophotometer at 730 nm. The dissolution medium was replaced with fresh buffer to maintain the total volume. The BSA release percent can be determined by the following equation:
where C(0) and C(t) represents the amount of BSA loaded and amount of BSA released at a time t, respectively.
3. Results and discussion
3.1.1. Effect of monomer to template molar ratio
The molar relationship between the functional monomer and the template is a critical factor for precise molecular recognition in non-covalent molecular imprinting.7 In this work, MIPs were prepared by varying the amounts of functional monomer (AMPS) after fixing the amounts of the template, cross-linker and porogen. The results are shown in Table 1. As we can see, the adsorption of BSA increases with the increase of the molar ratio of AMPS to BSA up to 8, and then varies a little. As the amount of AMPS increases, the equilibrium is favorable to the formation of a functional monomer–template complex, which yields more specific binding sites on the MIP. However, too much AMPS can result in a large number of non-specific binding sites, which decrease its selectivity. In this work, the optimized molar ratio of AMPS to BSA is 8.
Table 1 Effect of monomer to template ratio on BSA adsorption
| Amount of adsorption of BSA (%) |
Molar ratio of AMPS to BSA |
| 62.42 |
2 |
| 74.45 |
4 |
| 82.45 |
6 |
| 93.12 |
8 |
| 84.45 |
10 |
| 81.24 |
12 |
3.1.2. Effect of cross-linker
The cross-linker of polymers also plays an important role in the preparation of MIPs of high affinity and selectivity.8 In this work, the amounts of BSA and AMPS were fixed at 1 and 8 mmol, respectively, and that of the cross-linker was varied. In traditional molecular imprinting, the MIPs have high percentage (>90%) of crosslinker in order to reduce the swelling and improve the specificity of the imprinted cavity.9 This procedure is only effective for small template molecules. For large proteins, the degree of crosslinking has to be optimized because small pore sizes of highly crosslinked polymers will limit the access of high molecular weight proteins towards the imprinted sites. The imprinting efficiency (IE), calculated by taking the ratio of equilibrium adsorption capacity of MIPs to equilibrium adsorption capacity of NIPs; were low when the crosslinking density was 5.0% and 10.0% because the MIP matrix was too soft to form effective imprinting sites. IE reached maximum at 20.0% crosslinking density, when crosslinking density >20.0%, IE began to decrease. On the other hand, IE increased with the increase of crosslinking density because high crosslinking density is helpful to maintaining the shape of the imprinted cavity. But over-crosslinking on the polymer matrix decreases the pore radii and leads to the inaccessibility of some binding sites, so when crosslinking density >20.0%, IE began to decrease.
3.1.3.
Porogen optimization
Porogenic solvent plays an important role in the formation of the porous structure of MIPs, which are a subset of a larger class known as macroporous polymers.10 It is known that the nature and level of porogenic solvents determines the strength of non-covalent interactions and influences polymer morphology which, obviously, directly affects the performance of MIP. Firstly, template molecule, initiator, monomer and cross-linker have to be soluble in the porogenic solvents. Secondly, the porogenic solvents should produce large pores, in order to assure good flow-through properties of the resulting polymer. Thirdly, the porogenic solvents should be relatively low polarity, in order to reduce the interferences during complex formation between the imprint molecule and the monomer, as the latter is very important to obtain high selectivity MIP. Porogenic solvents with low solubility phase separate early and tend to form materials with larger pores and lower surface areas. Conversely, porogenic solvents with higher solubility phase separate later in the polymerization provide materials with smaller pore size distributions and greater surface area. More specifically, the use of a thermodynamically good solvent tends to produce polymers with well developed pore structures and high specific surface areas, while the use of a thermodynamically poor solvent tends to produce polymers with poorly developed pore structures and low specific surface areas.
Fig. 2 shows the SEM images of molecularly imprinted polymers synthesized under the same conditions but with different porogens (chloroform, dimethyl sulfoxide and acetonitrile). The results showed that MIP synthesized with chloroform exhibits a larger quantity of well-distributed macropore shapes than that of MIP synthesized with others solvents such as dimethyl sulfoxide and acetonitrile. It is well known that, in order to facilitate the transfer of macromolecules, such as proteins, the hydrogel microsphere should have macroporous structure.11
The binding and selectivity in MIPs do not appear to be dependent on a particular porosity. In the non-covalent imprinting approach, the selectivity and affinity of MIPs are closely related with the polarity of the porogens used in polymerization. Generally, the weaker the polarity of the porogen is, the stronger the selectivity and affinity of MIP are. In this work, MIPs were prepared in chloroform, acetonitrile and dimethyl sulfoxide separately and their effects on the affinity and selectivity of MIPs were investigated. The results are shown in Fig. 3. From the figure, it is clear that when chloroform is used as a solvent, MIP shows highest adsorption of BSA. These results can be explained as follows. The polarity of chloroform is lower than that of acetonitrile and dimethyl sulfoxide, chloroform is thermodynamically good solvent and chloroform shows low solubility phase separate early and tend to form larger pores than that of formed by acetonitrile and dimethyl sulfoxide.12 Owing to the low polarity of chloroform, it hardly suppresses hydrogen bonding and this is more favorable to form stable complexes between BSA and AMPS during polymerization. Therefore, MIP should exhibit higher affinity and selectivity for BSA. Acetonitrile and dimethyl sulfoxide have a great difference in polarity and solvation properties compared with chloroform and are more favorable for the interaction between recognition sites and imprinting molecules by hydrogen bonding and this would weaken the memory ability of BSA by changing the morphology of the polymer network, and thus, reduce its affinity and selectivity. In the following experiments, chloroform was chosen as the porogen in the preparation of MIP.
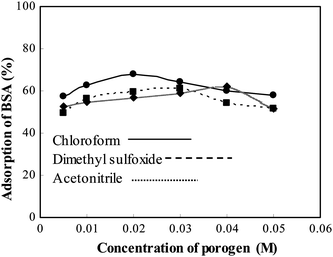 |
| | Fig. 3 Effect of porogen on MIP for the adsorption of BSA. | |
3.2. Characterization
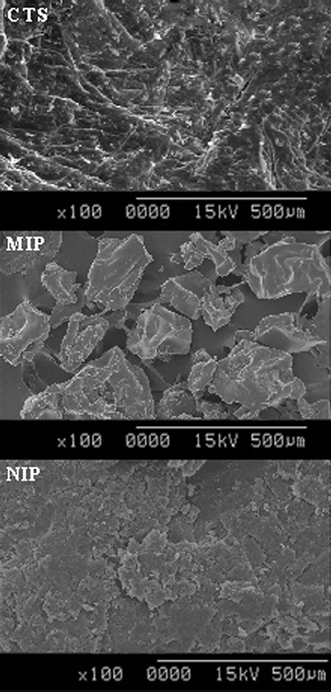
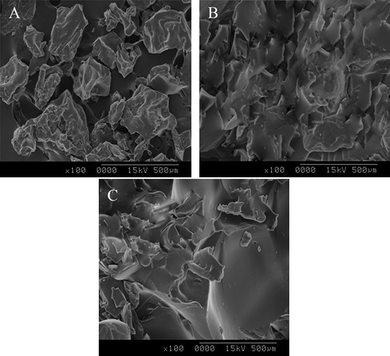
In order to investigate the morphology of the obtained samples, comparison between the SEM images of CTS, MIP and NIP is illustrated in Fig. 4. It can be seen that CTS surface is fibrous with some lamellar structure on the surface. However after modification, its surface morphology changed dramatically. The surface of MIP is irregular, rough and porous whereas the surface of NIP is regular, uniform and smooth. The change in surface morphology and the formation of pores in MIP supported the occurrence of the molecular imprinting process. The regular structure of the non-imprinted polymer was due to the fact that no specific binding site has been created for the specific recognition of BSA. The cavities in the MIP were caused by the structure of the template molecule.
 |
| | Fig. 4
SEM images of CTS, MIP and NIP. | |
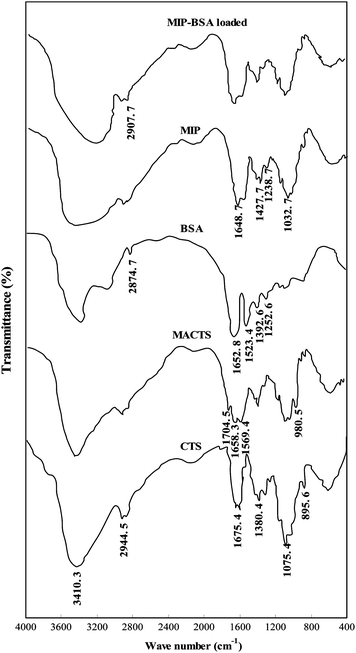
The FTIR spectra of CTS, MACTS, BSA, MIP and BSA loaded MIP are shown in Fig. 5. In the FTIR spectrum of CTS the broad peak observed at the wave number 3410.3 cm−1 corresponds to the associated –OH stretching vibration of the hydroxyl group and N–H shielding vibration from –NH2groups. The peak at 2944.5 cm−1 is the typical C–H stretching vibration. The peak at 1675.4 cm−1 corresponds to the –NH deformation from –NH2groups. The peak at 1380.4 cm −1 indicates the coupling of –OH in plane bending.
 |
| | Fig. 5
FTIR spectra of CTS, MACTS, BSA, MIP and BSA loaded MIP. | |
The FTIR spectrum of MACTS showed new peaks at 1704.5, 1658.3, 1569.4 and 980.5 cm−1, which were attributed to the MAH that reacts with CTS. The peak at 1569.4 cm−1 was indicative of carbon–carbon double bonds. The carbonyl and carboxylic group were confirmed by the adsorption peaks at 1658.3 and 1704.5 cm−1, respectively. The peak observed at 985.5 cm−1 indicates the presence of the –C![[double bond, length as m-dash]](https://www.rsc.org/images/entities/char_e001.gif) C– of the vinyl monomers.13
C– of the vinyl monomers.13
The FTIR spectrum of BSA shows four characteristic peaks. The peak at 2874.7 cm−1 is the typical C–H stretching vibration, the protein amide I (C![[double bond, length as m-dash]](https://www.rsc.org/images/entities/char_e001.gif) O stretching) was observed as a strong band at 1652.8 cm−1, while amide II (N–H bending and C–N stretching) appeared at 1523.4 cm−1. The presence of the amide I absorption at 1652.8 cm−1 as strong feature of the spectrum is indicative of the BSA molecule being mainly in the α-helix conformation. The peak at 1032.7 cm−1 indicates the presence of symmetric and asymmetric stretching of –C–O–C–.14
O stretching) was observed as a strong band at 1652.8 cm−1, while amide II (N–H bending and C–N stretching) appeared at 1523.4 cm−1. The presence of the amide I absorption at 1652.8 cm−1 as strong feature of the spectrum is indicative of the BSA molecule being mainly in the α-helix conformation. The peak at 1032.7 cm−1 indicates the presence of symmetric and asymmetric stretching of –C–O–C–.14
In FTIR spectrum of MIP, the band at 1648.7 cm −1 results from the –C![[double bond, length as m-dash]](https://www.rsc.org/images/entities/char_e001.gif) O stretching vibration of amide group (amide I). The band at 1565 cm−1 is likely due to the bending vibration of N–H bond (amide II). The bands at 1427.7 cm−1 and 1032.7/1238.7 cm−1 are assigned to the stretching of C–N bond (amide III) and asymmetric/symmetric stretching of –SO2group, respectively.15,16BSA loaded MIP shows all the characteristic peak of BSA and these peaks are slightly shifted. From this it was concluded that the BSA was encapsulated on to the polymer matrix.
O stretching vibration of amide group (amide I). The band at 1565 cm−1 is likely due to the bending vibration of N–H bond (amide II). The bands at 1427.7 cm−1 and 1032.7/1238.7 cm−1 are assigned to the stretching of C–N bond (amide III) and asymmetric/symmetric stretching of –SO2group, respectively.15,16BSA loaded MIP shows all the characteristic peak of BSA and these peaks are slightly shifted. From this it was concluded that the BSA was encapsulated on to the polymer matrix.
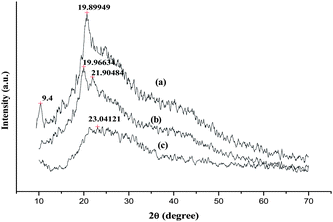
The XRD patterns of CTS, MACTS and MIP are illustrated in Fig. 6. CTS and MACTS exhibit certain degree of crystallinity. In XRD patterns of CTS, the diffraction maxima at 2θ = 9.4 and 19.89° can be attributed to its irregular crystalline nature [a, b]. The peak at 9.4° disappeared and a new peak was observed at 21.9°, indicating that CTS reacts with MAH. Compared with MACTS, it can be found that the peak at 21.9° disappeared, and the characteristic peak at 19.8° weakened obviously in the pattern of MIP. This indicates the decrease in crystallinity of the polymer matrix. The decrease in crystallinity may be due to incorporation of BSA within the MIP polymer network, which in turn increases intermolecular hydrogen bonding.
 |
| | Fig. 6
XRD Patterns of (a) CTS, (b) MACTS and (c) MIP. | |
The pH of point of zero charge (pHPZC) is defined as the pH at which zeta potential is zero. The values of zeta potential as a function of pH at 0.1 M, 0.01 M and 0.001 M NaCl for MIP were determined by using zeta potential analysis. The points of intersection of zeta potential versus pH plots (figure not shown) yield the pHPZC value of 3.2 for MIP. With the increase in pH beyond 3.2, the MIP's surface becomes more negative and this facilitates electrostatic interaction with positively charged BSA molecules (since the isoelectric point of BSA is 4.7).
3.3. Effect of pH on BSA adsorption on MIP
The initial pH of the solution is the most important parameter influencing the rate of loading of proteins in the polymer matrix. The electrostatic attraction and repulsion between the adsorbent and adsorbate depend on the surface of both entities. Adsorption of BSA on MIP was carried out at different pH values ranging from 2.0 to 7.0 using different initial BSA concentrations of 100.0 and 150.0 mg L−1. Results indicated that the adsorption had been pH dependent, and the sorption of BSA increased with increasing solution pH upto 4.5 and thereafter adsorption decreased. A maximum adsorption of 96.0% and 93.0% was observed at an initial concentration of 100.0 and 150.0 mg L−1, respectively at pH 4.5. The BSA has a negative value above the isoelectric point (4.7) and a positive value below the isoelectric point. MIP matrix carries a negative charge above pHpzc (3.2). When loading pH < pI, the positively charged BSA molecule was encapsulated on the polymer matrix due to the presence of charge–charge interactions. At loading pH approached to the pI value electrostatic repulsion between BSA and polymer matrix would be minimized. On the other hand near the pI value more binding sites are available for the BSA molecule in the polymer matrix. This would result in a higher loading capacity at pH 4.5. When pH > 5.0, fewer negatively charged BSA molecules (pH > pI) are loaded on the polymer matrix due to the presence of the negative charge on the polymer matrix. It appeared that the electrostatic repulsion contributed significantly to the decrease of loading capacity at higher pH values. Based on the experimental results the strong electrostatic interaction may be involved between MIP matrix and BSA at loading pH < pI.17
3.4. Effect of ionic strength
The effect of ionic strength on BSA adsorption was studied, which indicates that the adsorption capacity decreases with increasing ionic strength of the binding buffer. The adsorption of BSA decreased from 108.4 to 65.0 mg g−1 as the NaCl concentration changes from 0.02 to 0.1M. This decrease could be attributed to the competition of Na+ ions with BSA cation for the same reaction sites form the adsorbent surface. Compared to positively charged BSA cations, the size of the Na+ ions is small so its mobility in aqueous media is higher than BSA cations. Therefore Na+ cations get adsorbed earlier, which further obstructs the approach of positively charged BSA cations (since like charges repel).
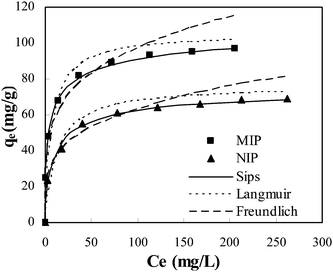
The adsorption isotherm studies are of fundamental importance in determining the adsorption capacity of BSA onto MIP and it diagnoses the nature of adsorption. The Langmuir, Freundlich and Sips isotherm models were used to interpret the experimental equilibrium isotherm data (Fig. 7). The Langmuir isotherm is based upon an assumption of monolayer adsorption onto a surface containing a finite number of adsorption sites of uniform energies of adsorption with no transmigration of adsorbate in the plane of the surface. The Langmuir isotherm is governed by the following equation:| |  | (1) |
where qe and Ce are the equilibrium concentration of BSA on adsorbent and in solution respectively. Q0and b are Langmuir constants related to adsorption capacity and energy of adsorption respectively.
The Freundlich isotherm model assumes heterogeneous surface energies in which the energy term in Langmuir equation varies as a function of surface coverage. The Freundlich isotherm equation is used in the general form.
where
KFand 1/
n are Freundlich isotherm constants related to
adsorption capacity and intensity of
adsorption respectively.
Sips or Langmuir–Freundlich isotherm18 has the following form:
| |  | (3) |
where
KS is the Sips constant related with affinity (mg L
−1)
−1/n and
Q0 is the Sips maximum
adsorption capacity (mg g
−1). The isotherm constants of all isotherm equations are very useful parameters for predicting
adsorption capacities. The values of all the isotherm constants were calculated from the slope and intercept of the plots using regression analysis and are shown in
Table 2. The validity of the isotherm models is tested by comparing the experimental and calculated data. Based on correlation coefficients (
R2) and
χ2 values it is noted that Sips equation gives a best fit over the entire range of concentrations. The Sips isotherm behavior is the same as that of the Freundlich equation with the exception of possessing a finite saturation limit when the concentration is sufficiently high. When exponent ‘
n’ is equal to one, the Sips isotherm is reduced into a Langmuir model. At low adsorbate concentrations this model effectively reduces to the Freundlich isotherm and thus does not obey Henry's law. At high adsorbate concentrations, it predicts a monolayer sorption capacity characteristic of the Langmuir isotherm.
19 The results obtained show that ‘
n’ values were above unity. It means that BSA
sorption data obtained in this study is more in the Langmuir form rather than that of Freundlich.
Table 2 Adsorption isotherm parameters for the adsorption of BSA onto MIP
| Isotherm model |
Parameter |
R
2
|
χ
2
|
| Langmuir |
| MIP |

|
0.986 |
8.45 |
| NIP |

|
0.976 |
10.45 |
| Freundlich |
| MIP |

|
0.983 |
8.94 |
| NIP |

|
0.976 |
9.41 |
| Sips |
| MIP |

|
0.995 |
3.749 |
| NIP |

|
0.991 |
2.644 |
The kinetic parameters for the adsorption of BSA onto MIP were evaluated. The kinetics of adsorption is described by the solute uptake which determines the residence required for the completion of sorption reaction. The effect of contact time on BSA adsorption is shown in Fig. 8. It can be seen that adsorption is a rapid process at the beginning followed by a much slower second step. After 180 min, the change in adsorption capacity for BSA did not show much effect. At the initial step, BSA molecules were easily able to reach the surface cavities. With the saturation on the external cavities BSA begins to diffuse towards the internal cavities; the sorption process could be divided into two steps, a quick step and a slow one. In the first step, the adsorption rate was fast, the contact time to nearly reach equilibrium was 30 min. In the subsequent step, adsorption was slow to reach equilibrium. In conclusion, higher adsorption efficiency was realized in a shorter time. This indicates that the molecular imprinting process had resulted in the formation of specific recognition sites on the surface of MIP, which are beneficial for BSA to bind with the recognition sites.
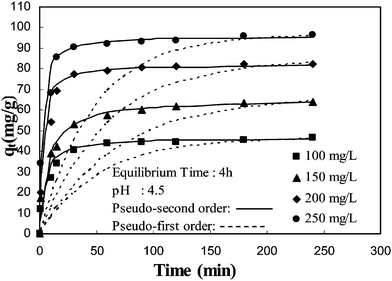 |
| | Fig. 8 Time course of BSA loading onto MIP. | |
To evaluate the adsorption kinetics of BSA, two kinetic models were used. A sample kinetics analysis of adsorption is the pseudo-first-order equation in the form:
| |  | (4) |
Where
qt and
qe are the amounts of BSA adsorbed at time
t and at equilibrium (mg g
−1), respectively, and
k1 is the rate constant of pseudo first-order
adsorption process (min
−1).
Table 3 shows the first-order kinetic parameters for the adsorption of BSA onto MIP.
Table 3 Kinetic parameters for the adsorption of BSA onto MIP
| Concentration (mg L−1) |
Pseudo-first order |
Pseudo-second order |
|
q
e(exp.) (mg g−1) |
k
1(min−1) × 10−2 |
q
cal (mg g−1) |
R
2
|
k
2 (g mg−1 min−1) × 10−2 |
q
cal (mg g−1) |
R
2
|
χ
2
|
| 100 |
46.56 |
1.86 |
16.86 |
0.923 |
5.94 |
47.26 |
0.999 |
2.13 |
| 150 |
66.33 |
1.44 |
29.16 |
0.947 |
5.44 |
65.60 |
0.997 |
3.14 |
| 200 |
84.10 |
1.69 |
23.60 |
0.843 |
4.96 |
84.4 |
0.999 |
2.26 |
| 250 |
96.26 |
2.11 |
23.19 |
0.919 |
4.74 |
97.1 |
0.999 |
2.54 |
The rate constants were calculated by using pseudo-second order model is given as
| |  | (5) |
Where
k2 (g mg
−1 min
−1) is the second-order rate constant. The values of second-order rate constant were used to calculate the initial sorption rate as given by:
The values of k2, qe and h were calculated from the slope and intercepts of the straight line and are given in Table 3. The values of qe were found to increase from 47.266 and 97.10 mg g−1, with an increase in the initial BSA concentration from 100.0 to 250.0 mg L−1. The values of R2 and χ2 given in Table 3 indicated that the pseudo-second order equation is the most suitable. These results imply that a chemisorption mechanism may play an important role in the adsorption of BSA on to MIP.
3.7. Recognition specificity of MIP
The selectivity tests of MIP were carried out under equilibrium binding conditions by using BSA, hemoglobin, lysozyme and cytochrome c as contrasting substrates. The equilibrium adsorption capacity (Qm) and the distribution coefficients (KD) of the selected substrates between solution and MIP are listed in Table 4. KD is defined as| |  | (7) |
where CP(mg g−1) is the concentration of substrate on MIP and CS (mg L−1) is the substrate concentration in the solution. Results showed that (Table 4) the adsorbed quantity of BSA onto the MIP was much higher than that of contrastive proteins. The values of KD gave the same results. MIP exhibited better recognition properties for templates compared to all the other substrates. On the other hand, NIP similarly showed low Qm and KD for all the substrates. These results indicate that the imprinting process created some imprinting cavities, which could selectively adsorb the template proteins. Contrastive proteins did no have not complementary shape or structure with the imprinting cavities and multiple hydrogen bonds could not be formed in the cavities, which resulted in the low binding capacity.
Table 4
Q
m and KD of substrates on MIP and NIP under equilibrium binding conditions
| Substrate |
Q
m for MIP (mg g−1) |
Q
m for NIP (mg g−1) |
K
D for MIP (ml g−1) |
K
D for NIP (ml g−1) |
| BSA |
89.01 |
64.04 |
1.24 |
0.525 |
|
Hemoglobin
|
41.75 |
44.31 |
0.250 |
0.274 |
|
Lysozyme
|
33.61 |
31.25 |
0.183 |
0.166 |
| Cyctochrome c |
35.54 |
37.06 |
0.198 |
0.211 |
3.8. Controlled release of BSA
Controlled release behavior of both MIP and NIP was studied. It can be seen (in Fig. 9) that MIP and NIP show greater difference in their controlled delivery of BSA molecules, MIP delivers BSA molecules in a controlled manner. In the case of MIP, because the adsorbed BSA molecules entered the interior cavities of imprinted sites in addition to the exterior surfaces, BSA molecules were released by diffusion due to the concentration gradient, which was much slower than that of the BSA present at the surface. In the case of NIP, a large fraction of adsorbed BSA molecules were localized at the surface because there are no imprinted cavities, resulted in serious burst effect and uncontrolled release.
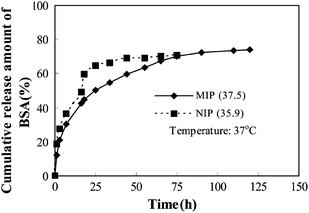 |
| | Fig. 9 Controlled release behavior of MIP and NIP. | |
3.9.
Drug release mechanism of MIP
To investigate more precisely the release behavior of BSA from MIP, the fraction of drug (BSA as a model) released data during controlled release of BSA process were normalized to fit to the Peppa's potential equation:20| |  | (8) |
where Mt and M∞ are the amount of drug released cumulatively at time t and that of drug released completely, respectively. k is the apparent release rate and n is the diffusion exponent, which characterizes the diffusion mechanism. A value of n = 0.43 signifies the Fickian diffusion mechanism. In this case the diffusion of drug molecules plays an important role during release process.21 A value of n = 0.85 indicates a swelling-controlled release mechanism. That is to say, the release process of drug is limited by the expanding of the polymer segment to accommodate penetration, i.e., the viscoelastic properties of polymer matrix become important.22 In the case of 0.43 < n < 0.85, the diffusion mechanism is non-Fickian, where both drug diffusion and polymer relaxation control the overall rate of drug release. Plots of ln(Mt/M∞) against ln(t) are shown in Fig. 10 for the MIP obtained under optimum conditions. The profile is linear in the early stage (R2 = 0.997; R, correlation coefficient), and the slope of this line is 0.72, assigned to the diffusion exponent, n, which shows that the BSA release from MIP is a mechanism of combined diffusion of BSA with relaxation of polymer matrix.23 The drug release kinetics of the controlled release matrix can be determined by the diffusion process of drug partially through the water-filled pores and channels in the polymer network, as well as the erosion of CTS matrix.
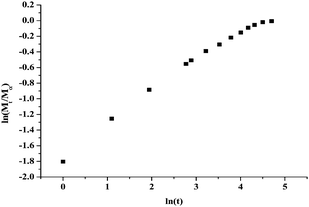 |
| | Fig. 10 ln(Mt/M∞) versusln(t) plots for MIP. | |
3. Conclusions
In the present study, a novel protein-imprinted N-maleoylchitosan grafted 2-acrylamido-2-methylpropanesulfonic acid polymer was prepared by using BSA as a template. A visible porous and rough structure in the polymer matrices, which would makes it easy for protein to diffuse in the polymer network, was observed in SEM photographs. Compared with the non-imprinted polymers, the MIP matrix demonstrated much higher adsorption capacity. We speculate that the imprinting effect was caused by multiple hydrogen bonds and electrostatic interaction between the functional group present in the imprinting cavities of MIP and template protein. The effect of different porogenic agents on improving the pore size of MIP was determined, owing to the lowest polarity of chloroform, it hardly suppresses hydrogen bonding and this is more favorable for forming stable complexes between BSA and AMPS during polymerization. Therefore, MIP should exhibit higher affinity and selectivity for BSA. Influence of crosslink density on imprinting efficiency plays a major role for BSA; the degree of crosslinking has to be optimized because small pore sizes of highly crosslinked polymers will limit the access of high molecular weight proteins like BSA towards the imprinted sites. MIP and NIP shows greater difference in their controlled delivery of BSA molecules, MIP deliver BSA molecules in a controlled manner. The adsorption kinetics closely followed the pseudo-second-order kinetic model. The experimental adsorption isotherm data were well fitted with the Sips model. Drug release mechanism MIP was studied by fitting the amounts of drug released into Peppa's potential equation which shows that the BSA release from MIP is controlled by a mechanism of combined diffusion of BSA with relaxation of polymer matrix.
References
- K. Haupt and K. Mosbach, Molecularly Imprinted Polymers and Their Use in Biomimetic Sensors, Chem. Rev., 2000, 100, 2495–2504 CrossRef CAS.
- J. D. Marty and M. Mauzac, Molecular imprinting: state of the art and perspective, Adv. Polym. Sci., 2005, 172, 1–35 Search PubMed.
- D. Dilip, P. K. Annamalai and P. S. Raj, Cell proliferation and controlled drug release studies of nanohybrids based on chitosan-g-lactic acid and montmorillonite, Acta Biomater., 2009, 5, 93–100 CrossRef CAS.
- L. Ma, C. Gao, Z. Mao, J. Zhou, J. Shen and X. Hu,
et al., Collagen/chitosan porous scaffolds with improved biostability for skin tissue engineering, Biomaterials, 2003, 24, 4833–4841 CrossRef CAS.
- Z. Aiping, L. Yan, P. Yingnan, D. Sheng and W. Hao, Self-assembly of N-maleoylchitosan in aqueous media. Colloids and Surfaces B, Colloids Surf., B, 2010, 76, 221–225 CrossRef CAS.
- Y. Boonsongrit, H. Abe, K. Sato, M. Naito, M. Yoshimura and H. Ichikawa,
et al., Controlled release of bovine serum albumin from hydroxyapatite microspheres for protein delivery system, Mater. Sci. Eng., B, 2008, 148, 162–165 Search PubMed.
- H. S. Andersson, J. G. Karlsson, S. A. Piletsky, A. K. Schmidt, K. Mosbach and I. A. Nicholls, Study of the nature of recognition in molecularly imprinted polymers, II: Influence of monomer–template ratio and sample load on retention and selectivity, J. Chromatogr., A, 1999, 848, 39–49 CrossRef CAS.
- Q. Z. Zhu, K. Haupt, D. Knopp and R. Niessner, Molecularly imprinted polymer for metsulfuron-methyl and its binding characteristics for sulfonylurea herbicides, Anal. Chim. Acta, 2002, 468, 217–227 CrossRef CAS.
- M. Glad, P. Reinholdsson and K. Mosbach, Molecularly imprinted composite polymers based on trimethylolpropane trimethacrylate (TRIM) particles for efficient enantiomeric separations, React. Polym., 1995, 25, 47–54 CrossRef CAS.
-
A. Guyot, in Synthesis and Separations Using Functional Polymers, ed. D. C. Sherrington and P. Hodge, John Wiley & Sons, New York, 1989, pp. 1–36 Search PubMed.
- P. Xingshou, C. Guoxiang, Z. Yihua and L. Shulai, Soft-wet polyacrylamide gel beads with the imprinting of bovine serum albumin, React. Funct. Polym., 2006, 66, 1182–1188 Search PubMed.
-
M. Komiyama, T. Toshifumi, T. Mukawa, H. Asanuma, Molecular Imprinting: From Fundamentals to Application, Wiley-VCHMorlenbach, Germany, 2003 Search PubMed.
- T. Y. Guo, Y. Q. Xia, J. Wang, M. D. Song and B. H. Zhang, Chitosan beads as a molecularly imprinted polymer matrix for selective separation of proteins, Biomaterials, 2005, 26, 5737–5745 CrossRef CAS.
- F. Rosa, J. Bordado and M. Casquilho, Hydrosoluble copolymer of acrylamide-(2-acrylamido-2-methylpropanesulphonic acid) synthesis and characterization by spectroscopy and viscometry, J. Appl. Polym. Sci., 2003, 87, 192–198 Search PubMed.
- S. Cavus and G. Gurdag, Competitive heavy metal removal by poly(2- acrylamido-2-methylpropanesulphonic acid-co-itaconic acid), Polym. Adv. Technol., 2008, 19, 1209–1217 Search PubMed.
- W. Duan, C. Shen, H. Fang and G. H. Li, Synthesis of dihydroabietic acid-modified chitosan and its drug release behavior, Carbohydr. Res., 2009, 34, 9–13 Search PubMed.
- Y. Q. Xia, T. Y. Guo, M. D. Song, B. H. Zhang and B. L. Zhang, Selctive separation of quercetin by molecular imprinting using chitosan beads as functional matrix, React. Funct. Polym., 2006, 66, 1734–1740 CrossRef CAS.
- R. Sips, On the structure of a catalyst surface, J. Chem. Phys., 1948, 16, 490–495 CrossRef CAS.
- M. Sathishkumar, A. R. Binupriya, K. Vijayaraghavan and S. I. Yun, Two and three-parameter isothermal modeling for liquid-phase sorption of Procion Blue H-B by inactive mycelial biomass of Panus fulvus, J. Chem. Technol. Biotechnol., 2007, 82, 350–359 Search PubMed.
- Z. Xuejiao,
et al., A hydrotropic b-cyclodextrin grafted hyperbranched polyglycerol co-polymer for hydrophobic drug delivery, Acta Biomater., 2011, 7, 585–592 Search PubMed.
- B. Falk, S. Garramone and S. Shivkumar, Diffusion coefficient of paracetamol in a chitosan hydrogel, Mater. Lett., 2004, 58, 3261 CrossRef CAS.
- I. Hopkinson, R. A. L. Jones, S. Black, D. M. Lane and P. J. McDonald, Fickian and Case II diffusion of water into amylose: A stray field NMR study, Carbohydr. Polym., 1997, 34, 39 Search PubMed.
- D. Kanjickal, S. Lopina, M. M. Evancho-Chapman, S. Schmidt, D. Donovan and S. Springhetti, Polymeric sustained local drug delivery system for the prevention of vascular intimal hyperplasia, J. Biomed. Mater. Res., 2004, 68A, 489–495 Search PubMed.
|
| This journal is © The Royal Society of Chemistry 2011 |
Click here to see how this site uses Cookies. View our privacy policy here. 


![[double bond, length as m-dash]](https://www.rsc.org/images/entities/char_e001.gif) C– of the vinyl monomers.13
C– of the vinyl monomers.13![[double bond, length as m-dash]](https://www.rsc.org/images/entities/char_e001.gif) O stretching) was observed as a strong band at 1652.8 cm−1, while amide II (N–H bending and C–N stretching) appeared at 1523.4 cm−1. The presence of the amide I absorption at 1652.8 cm−1 as strong feature of the spectrum is indicative of the BSA molecule being mainly in the α-helix conformation. The peak at 1032.7 cm−1 indicates the presence of symmetric and asymmetric stretching of –C–O–C–.14
O stretching) was observed as a strong band at 1652.8 cm−1, while amide II (N–H bending and C–N stretching) appeared at 1523.4 cm−1. The presence of the amide I absorption at 1652.8 cm−1 as strong feature of the spectrum is indicative of the BSA molecule being mainly in the α-helix conformation. The peak at 1032.7 cm−1 indicates the presence of symmetric and asymmetric stretching of –C–O–C–.14![[double bond, length as m-dash]](https://www.rsc.org/images/entities/char_e001.gif) O stretching vibration of amide group (amide I). The band at 1565 cm−1 is likely due to the bending vibration of N–H bond (amide II). The bands at 1427.7 cm−1 and 1032.7/1238.7 cm−1 are assigned to the stretching of C–N bond (amide III) and asymmetric/symmetric stretching of –SO2group, respectively.15,16BSA loaded MIP shows all the characteristic peak of BSA and these peaks are slightly shifted. From this it was concluded that the BSA was encapsulated on to the polymer matrix.
O stretching vibration of amide group (amide I). The band at 1565 cm−1 is likely due to the bending vibration of N–H bond (amide II). The bands at 1427.7 cm−1 and 1032.7/1238.7 cm−1 are assigned to the stretching of C–N bond (amide III) and asymmetric/symmetric stretching of –SO2group, respectively.15,16BSA loaded MIP shows all the characteristic peak of BSA and these peaks are slightly shifted. From this it was concluded that the BSA was encapsulated on to the polymer matrix.

