Peptide-based lipid mimetics with tunable core properties viathiol–alkyne chemistry†
Jacob G.
Ray
,
Jack T.
Ly
and
Daniel A.
Savin
*
The University of Southern Mississippi, School of Polymers and High Performance Materials, 118 College Drive #5050, Hattiesburg, MS 39406, USA. E-mail: daniel.savin@usm.edu; Fax: +1-601-266-5504; Tel: +1-601-266-5395
First published on 8th March 2011
Abstract
Thiol–alkyne chemistry is utilized to produce peptide-based A2B star polymers. This topography resembles a phospholipid where the polypeptide B block represents a functional, polar head group and the A blocks represent lipophilic units. We utilize a convergent, modular approach to produce lipid mimetics through conjugation of poly(L-glutamic acid) with three different lipophilic moieties (octadecane, cholesterol and polyhedral oligomeric silsesquioxane). All samples are shown to self-assemble in aqueous solution into pH-responsive vesicles. The self-assembly and pH-responsiveness were characterized using circular dichroism spectroscopy and light scattering. Detailed light scattering experiments determined that the aggregation number of the vesicles remains nearly constant as a function of pH, suggesting that the pH-responsiveness is a result of both the helix–coil transition as well as a change in chain packing at the vesicle interface.
Introduction
Cell membranes contain a variety of exposed proteins which are responsible for signaling and transport. Synthetic lipid bilayers (liposomes) based on lipid-like small-molecule amphiphiles have been extensively studied.1–4 These systems, however, lack functionality in terms of a true mimic of cell surface interactions. The use of click chemistry has been seminal in terms of producing bioconjugates that combine the physical properties of polymers and the specific functionality of peptides and proteins.5–12 Of particular interest are systems that self-assemble while retaining protein function at the interface. Our interest is in creating polymer vesicles (polymersomes) with surface functional, responsive peptides. Polypeptide-based polymersomes are a useful class of materials whereby well-defined secondary structure changes lead to pH and/or temperature responsive, biocompatible structures.13–19Typically, polymersomes are composed of diblock copolymers where the equilibrium morphology is dictated by the relative volumes of the hydrophobic and hydrophilic blocks.20–24 In a previous paper, we explored the use of thiol–alkyne chemistry to produce peptide-based lipid-mimetic A2B polymers that self-assemble into polymersomes.25 The utility of the proposed A2B motif ensures that the hydrophobic (A) volume is maximized, favoring bilayer formation while leaving the functional peptide (B) at the vesicle interface.26
Herein, we extend this previous study to report the synthesis and pH-responsive self-assembly for a class of A2B lipid mimetic molecules with varying lipophilic A groups. We utilize thiol–yne chemistry to conjugate poly(glutamic acid) peptides of varying molecular weights with typical lipophilic moieties observed in cell membranes (i.e., octadecane and cholesterol) as well as a low surface energy moiety (polyhedral oligomeric silsesquioxane). All samples were shown to spontaneously self-assemble into vesicles thereby illustrating the versatility of this chemistry to produce complex amphiphilic molecules with tailored hydrophobic core properties. Using this modular synthetic approach, we envision the ability to tailor the core properties as being a viable way to study membrane transport in various chemical/physical environments as well as creating drug delivery vehicles with various release profiles.
Experimental
Convergent synthesis of A2B polymers
The general scheme to produce pH-responsive A2B polymers is shown in Fig. 1. Briefly, propargylamine (PA) was used to initiate the ring opening polymerization (ROP) of benzyl-L-glutamateN-carboxyanhydride (BLG-NCA). Acetylene-functionalized poly(benzyl-L-glutamate) (PBLG) was then reacted with 4 eq. of thiolviathiol–yne chemistry. Octadecanethiol (ODT), thiocholesterol (Chol), and mercaptopropylisobutyl polyhedral silsesquioxane (POSS) were the three thiols reacted with acetylene-functionalized PBLG. The resulting star polymers, ODT2PBLGn, Chol2PBLGn, and POSS2PBLGn, were then deprotected and purified to yield pH-responsive R2-poly(L-glutamic acid) (R2PEn) star polymers.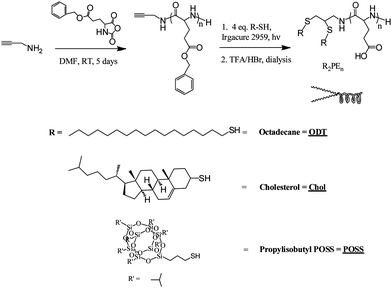 | ||
| Fig. 1 Synthesis of A2B pH-responsive lipid mimetic molecules; different R groups were used to demonstrate the versatility of the chemistry and to achieve vesicles with various hydrophobic core properties. | ||
Materials
Dimethylformamide (DMF) and tetrahydrofuran (THF) were purchased from Sigma-Aldrich, purified and degassed by a Pure Solv MD-3 solvent purification system before use. Deionized water (DI H2O) was collected from a Barnstead NANOPure reverse osmosis/filtration unit (resistivity of 18.0 MΩ). H-Glu(oBzl)-OH was purchased from Sigma-Aldrich, and its corresponding N-carboxyanhydride (NCA) was prepared by a method described below.17,27Triphosgene (Acros), propargylamine (Acros), trifluoroacetic acid (Acros), HBr in acetic acid (30 wt%, Acros), 1-octadecanethiol (Sigma-Aldrich), thiocholesterol (Sigma-Aldrich), and 1-[4-(2-hydroxyethoxy)-phenyl]-2-hydroxy-2-methyl-1-propane-1-one (Irgacure 2959) (Ciba Specialty Chemicals) were used as received. Mercaptopropylisobutyl polyoxahedral silsesquioxane (POSS®) was generously donated by Hybrid Plastics™ and used as received.Synthesis of Glu(oBzl)-NCA
H-Glu(oBzl)-OH (10 g, 42.1 mmol) was added to a flame-dried flask and dissolved in THF to a final concentration of ∼0.1 g mL−1. The slurry was stirred under nitrogen for 20 min at 65 °C. Triphosgene (6 g, 20.2 mmol) dissolved in 10 mL of THF was added to the mixture under a nitrogen atmosphere, and a drying tube was attached to the reaction flask. The reaction proceeded for ∼1 h, as THF slowly evaporated to give a final volume of ∼20 to 30 mL. Upon cooling, precipitation was performed by adding the mixture to hexanes and cooling overnight. The recovered precipitate was then redissolved in THF, and 2–3 g of decolorizing charcoal was added and stirred overnight to remove the residual hydrochloric acid. The mixture was then passed through a Celite column to remove charcoal, reprecipitated into hexanes, and cooled overnight. The resulting white powder was collected and dried under vacuum overnight to produce pure Glu(oBzl)-NCA, with standard yields between 75 and 85%.Synthesis of acetylene terminated PBLGs
Propargylamine, (81 μL, 1.27 mmol), (49 μL, 0.76 mmol), and (24.3 μL, 0.38 mmol), was added to solutions of Glu(oBzl)-NCA (4 g, 15.2 mmol) in DMF at 25 °C, thereby targeting DPs of 12, 20, and 40 respectively. The reaction was stirred under N2 gas for 5 days. The reaction mixtures were then precipitated into ether and dried under vacuum at room temperature for 48 h. Standard yields were between 50 and 60%.Synthesis of R2-PBLG using a convergent approach
Solutions of acetylene-functional PBLG (1 eq. in THF, 8 wt%) in scintillation vials equipped with stir bars were mixed with R-thiols (4 eq.). The thiol–yne click reaction was carried out in the presence of Irgacure 2959, 2 wt% of combined amount of PBLG and thiol, under UV light (365 nm) for 4 h at atmospheric conditions; the reaction mixture was then concentrated, resuspended in chloroform, and precipitated in ether to remove any unreacted thiol. The three thiols used were mercaptoisobutyl POSS, thiocholesterol, and 1-octadecanethiol, thereby reacting the acetylene-functional polypeptide with three distinctly different compounds of varying physical properties.Deprotection chemistry
Benzyl protecting groups were removed through hydrolyzation by stirring in a 50![[thin space (1/6-em)]](https://www.rsc.org/images/entities/char_2009.gif) :
:![[thin space (1/6-em)]](https://www.rsc.org/images/entities/char_2009.gif) 50 mixture of trifluoroacetic acid (TFA) and 30 wt% HBr in glacial acetic acid for 2 hours at room temperature. The resulting slurry was then diluted with deionized water, neutralized with 6 M NaOH, and dialyzed against water using 3500 MW cut-off membrane for 48 hours.
50 mixture of trifluoroacetic acid (TFA) and 30 wt% HBr in glacial acetic acid for 2 hours at room temperature. The resulting slurry was then diluted with deionized water, neutralized with 6 M NaOH, and dialyzed against water using 3500 MW cut-off membrane for 48 hours.
Characterization
1H and 13C NMR spectra were obtained using a Varian Mercury 300 (300 MHz) spectrometer using CDCl3 with 1% v/v TMS as a solvent. The DP of the polypeptide blocks and the resulting Mn were determined by peak integration analysis of the methylene proton signal (3.9 ppm) of the propargylamine and the methylene proton signal (5.1 ppm) of the PBLG. 13C NMR was used to confirm the presence of bis-1,2-addition products (35–45 ppm) for the coupling reactions. Molecular weight distributions (MWDs) of the polypeptides were verified using size exclusion chromatography (GPC) with a Viscotek TDA 302, equipped with two low molecular weight columns connected in series. DMF with 0.02 M lithium bromide was used as eluent at a flow rate of 1 mL min−1 operating at 35 °C. TEM images of the aggregates were acquired using a TEM JEOL Ltd. JEM-2100 LaB6 operating under ultra high vacuum with an acceleration voltage of 200 kV. Polymer solutions (0.025 wt%) were placed onto silicon monoxide-coated copper grids, allowed to sit for 15 min, and wicked dry at room temperature. The samples were then stained with a cesium hydroxide (CsOH) solution, with the exception of Chol2PE which had sufficient contrast without staining. Images were taken between 15![[thin space (1/6-em)]](https://www.rsc.org/images/entities/char_2009.gif) 000× and 40
000× and 40![[thin space (1/6-em)]](https://www.rsc.org/images/entities/char_2009.gif) 000× magnification. Circular dichroism (CD) spectra were taken using an Olis DSM 1000 spectrometer fitted with a circular quartz cell (path length = 0.25 mm). Solutions of 0.05 wt% polymer were prepared, and the average of eight scans over the wavelength range 190–350 nm was compared against a water blank for each sample studied.
000× magnification. Circular dichroism (CD) spectra were taken using an Olis DSM 1000 spectrometer fitted with a circular quartz cell (path length = 0.25 mm). Solutions of 0.05 wt% polymer were prepared, and the average of eight scans over the wavelength range 190–350 nm was compared against a water blank for each sample studied.
Dynamic and static light scattering
Variable-angle DLS and SLS measurements were made using incident light at 633 nm from a Spectra Physics Model 127 HeNe laser operating at 40 mW. The angular dependence of the autocorrelation functions was measured using a Brookhaven Instruments BI-200SM goniometer with an avalanche photodiode detector and a TurboCorr correlator. For DLS, fluctuations in scattering intensity were analyzed via the intensity autocorrelation function (g(2)(τ)). Apparent diffusion coefficients (Dapp) were calculated based on the relation| Γ = Dappq2 |
where η is the solution viscosity and kB is Boltzmann's constant. SLS measurements were also performed on aqueous polymer solutions using the same instrument described above. The angular dependence of the inverse excess scattering intensity (Iex) was analyzed via Zimm/Berry analysis by plotting Iex−1versus q2, thereby determining the radius of gyration (Rg) from the slope, and molecular weight of the aggregates from the intercept. Deprotected copolymers were dissolved in DI water (0.025 wt% solutions) and pH values were carefully adjusted using 0.1 M HCl and NaOH solutions. The solutions were sonicated for 15 minutes and then filtered through a 0.45 μm Millipore filter (PVDF) directly into scattering cells. Samples were allowed to equilibrate for one day before measurements were performed.
Results and discussion
Fig. 2 shows 1H NMR spectra for PBLG (DPn = 16) and the resulting A2B star polymer products from the three thiols. The absence of peaks in the region δ = 0–1.9 ppm for PBLG provides a useful diagnostic for comparison with the conjugates, and the disappearance of the alkyne resonance at δ = 3.9 ppm indicates a successful reaction. In comparing ODT2PBLG16 with PBLG, it is clear that the appearance of resonances at δ = 0.9 and 1.2 ppm corresponds to aliphatic groups in the ODT chain. The degree of conjugation can then be estimated by comparing the integration of the aliphatic groups with the protecting groups of PBLG assuming the DPn of PBLG calculated previously. The ratio of these integrations confirms nearly 100% of the bis 1,2-addition of ODT to the PBLG. Similarly, for POSS2PBLG16 (Fig. 2, top) it is clear that the resonances at δ = 0.8 and 1.0 ppm correspond to pendant isobutyl groups on the POSS cage. The degree of conjugation is then estimated to be 73%, corresponding to a ca. 50/50 mixture of mono- and bis-substituted chains. Finally, for Chol2PBLG16 the complex set of resonances between δ = 0.8 and 1.7 ppm confirm conjugation with Chol, although it is problematic to estimate degree of conjugation because of the lack of clearly resolved peaks. Nonetheless, we do not expect complete bis-addition for sterically bulky Chol groups, similar to what was observed for POSS. For these latter two systems, 13C NMR spectra suggest the conjugation is higher than that estimated by 1H NMR; the resonances corresponding to the mono-addition are absent, and the resonances corresponding to the bis-addition are present. Additionally, there is no evidence in the 1H NMR of the mono-addition product (expected at δ = 5.4 ppm).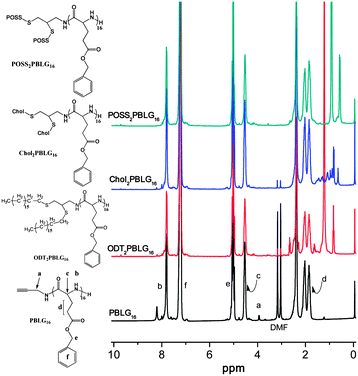 | ||
| Fig. 2 1H NMR for acetylene-functional poly(benzyl L-glutamate)16 (PBLG16) and convergent thiol–yne synthesis products. | ||
Solution characterization and pH-responsiveness of A2B polymers
Upon deprotection, all of the synthesized polymers self-assemble in aqueous solution. The solution self-assembly and pH-responsiveness were characterized using dynamic (DLS) and static (SLS) light scattering techniques, as well as transmission electron microscopy (TEM) and circular dichroism (CD) spectroscopy. Solutions were dissolved directly into deionized water to a concentration of 0.025 wt%. The hydrodynamic radius (Rh) was calculated using the Stokes–Einstein relation, where the diffusion coefficient was determined from the slope of the average decay rate of the DLS autocorrelation function (from the second cumulant) as a function of the square of the scattering vector q (ESI†). The radius of gyration (Rg) was calculated from the angular dependence in the scattering intensity according to the Zimm/Berry formalism, and the ratio ρ = Rg/Rh is used as an indicator of morphology.Fig. 3 shows Rh as a function of pH for five of the systems studied. For all of the systems at neutral pH, Rh is much larger than the contour length of the molecule, and the ratio ρ = Rg/Rh was between 1.02 and 1.07, close to the theoretical value of 1.0 for a vesicle morphology. In Fig. 3 (top) ODT2PE16 shows a change in Rh of ca. 30 nm going from 74 nm at pH = 4 to 103 nm at pH = 10. TEM images (inset, taken at pH 6.5) indicate the presence of vesicles with sizes consistent with DLS. Fig. 3 (middle) shows dimension changes for Chol2PE11 (red circles) and Chol2PE16 (black squares). Again, both samples show an increase in Rh with pH, although in this case the dimension change is only approximately 15 nm when going from low to high pH. TEM images again show well-defined vesicles with size consistent with DLS. In the case of Chol2PE11, there was sufficient electron contrast to obtain TEM images without stain. This is presumably because of the liquid crystal packing within the membrane. Indeed, these vesicles have a well defined membrane with thickness ca. 5 nm. Fig. 3 (bottom) shows the pH responsiveness of POSS2PE16 (black squares) and POSS2PE36 (blue triangles). As for the previously discussed samples, these samples once again show an increase in Rh of 22 and 36 nm respectively as the pH is increased. Finally, the TEM images for POSS2PE36 suggest the presence of the expected assembly motif, vesicles, with sizes consistent with DLS results.
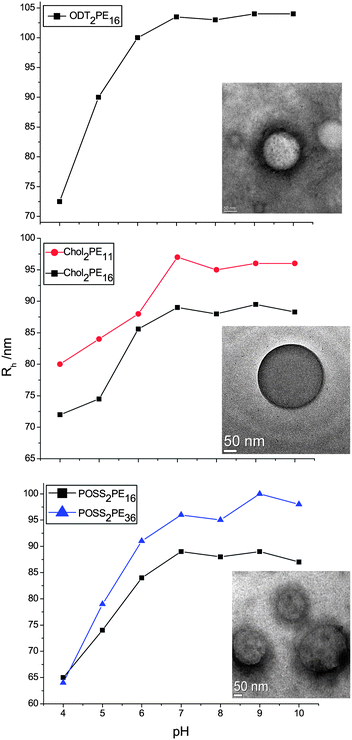 | ||
| Fig. 3 R h versus pH plots for ODT2PE16 (top) (inset is TEM image at pH 6.5), Chol2PE11 and Chol2PE16 (middle) (inset is TEM image for Chol2PE16 at pH 6.5), and POSS2PE16 and POSS2PE36 (bottom) (inset is TEM image for POSS2PE36 at pH 7.2). TEM scale bars 50 nm. | ||
CD spectra of Chol2PE16 at varying pH are shown in Fig. 4. The spectra indicate an α-helical secondary structure for PE at pH 4.3; this is indicated by the negative minima at 208 and 222 nm. As expected, a random coil conformation, indicated by the positive maximum at 218 nm, is adopted for PE as the pH is increased above the pKa. At pH 6.6 PE exists as a random coil and the maximum at 218 nm increases slightly at the higher pH values of 8.1 and 10.1. The pH-responsiveness of these vesicles is clearly a result of the helix–coil transition of the PE chain. Interestingly, the size changes that all of the self-assembled samples display is larger than expected based simply on the change in dimensions (rise per unit) of an α-helix (0.15 nm) compared with a random coil (0.37 nm). Given the DPn of PE = 11, 16 and 36, expected dimension changes would be 2.4, 3.5, and 8 nm respectively. As indicated by Schlaad, an explanation for this occurrence lies in the changes in surface density as a function of pH.19 That is, when the peptide chains become charged at high pH, the corona chains require more room to avoid crowding and electrostatic repulsions. Therefore, the chain density at the vesicle interface likely decreases as the corona chains become longer and more charged at high pH. This idea is supported by the fact that the assemblies actually have the highest scattering counts at pH 4–5 despite the smaller aggregate sizes, indicating the presence of higher order assemblies with greater chain density.
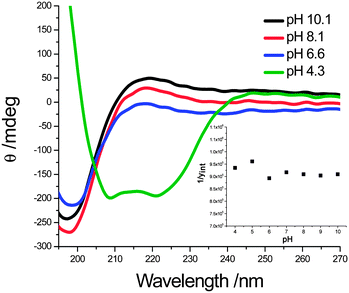 | ||
| Fig. 4 CD plot for Chol2PE16 at varying pH. The helix–coil transition is apparent, and there exists an isodichroistic point at 205 nm. (Inset) Effective molecular weight (hence aggregation number) as a function of pH (quantified by the intercept of the I−1vs. q2 plot). | ||
This idea of changes in chain density can be explored in more detail by considering the angular dependence of the static light scattering from the vesicle samples. In the Zimm formalism, the inverse scattering intensity is directly related to the inverse of the molecular weight of the scattering species in the limit as q → 0 and c → 0. Fig. 5 presents the hydrodynamic size as a function of concentration for three of the vesicle samples (ODT2PE16, POSS2PE16 and Chol2PE16), and it is clear from these data that the radius is invariant to concentration over the range of study, which suggests a closed association condition. Coincidentally, increasing the concentration much above 1 mg mL−1 renders the sample too opaque for meaningful light scattering. We can then define an effective molecular weight of the assembly, which is the inverse of the y-intercept in the I−1vs. q2 plot. This representation does not require knowledge of the refractive index increment (dn/dc), and direct comparisons can be made for the effective molecular weight of the assembly as a function of pH if we choose a common solution concentration.
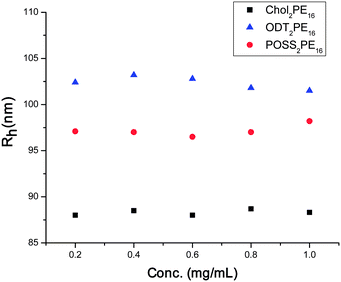 | ||
| Fig. 5 R h vs. concentration for ODT2PE16, POSS2PE16 and Chol2PE16. These data suggest that the hydrodynamic size is invariant to concentration over the range used. | ||
Fig. 6 shows the I−1vs. q2 plot for POSS2PE16 at three different pH values. The common intercept in all three of these plots suggests that the effective molecular weight (hence effective aggregation number) of the aggregates does not change with pH. The insets of Fig. 4 and 6 show the changes in the reciprocal of the y-intercept of the I−1vs. q2 plot (hence effective aggregation number) for Chol2PE16 and POSS2PE16, respectively, as a function of pH. These data suggest that the aggregation number does not deviate for these vesicles as pH changes, except possibly slight deviations in the helix–coil transition region (pH 5–6). In addition, the kinetics of the morphology transition is extremely fast. A measurement of the scattered intensity versus time for ODT2PE16 is discontinuous upon a pH perturbation (rapid addition of NaOH), suggesting that the assemblies immediately adopt their new morphology (ESI†). There is no addition of chains into the vesicle, the kinetics are too fast to suggest any chain exchange, therefore changes in chain packing must account for the dramatic morphology changes with pH.
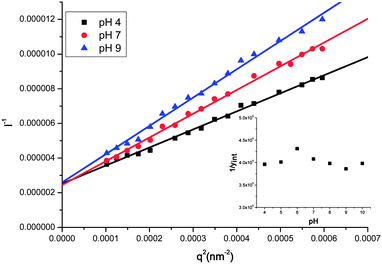 | ||
| Fig. 6 I −1 vs. q 2 plots for POSS2PE16 at different pH values. According to the Zimm formalism, the intercept in this plot is proportional to the inverse molecular weight of the assembly. The common intercept as a function of pH suggests that the aggregation number does not change with pH. (Inset) Effective molecular weight (hence aggregation number) as a function of pH (quantified by the intercept of the I−1vs. q2 plot). | ||
As seen above, all aggregates exhibit self-assembly into vesicles with radii of ∼80 to 100 nm and ρ ≈ 1. However, the breadth of the size distribution varied for the samples studied. The polydispersity in the DLS correlation function (quantified as the normalized second cumulant) was on the order of 0.17–0.25 for ODT2PE16 and POSS2PEn assemblies. These polydispersities are on the order of what may be expected from vesicles. In contrast, both Chol2PE11 and Chol2PE16 exhibited size dispersities as low as 0.05 with much higher excess scattering intensities. This suggests that cholesterol-based amphiphiles offer highly ordered, equilibrated assembly characteristics which may be due to core crystallization, as cholesterol is a well-known liquid crystal former.
Conclusions
In summary, we have shown thiol–alkyne chemistry to be a fast, effective way to produce peptide-based A2B star polymer amphiphiles. In a convergent, modular approach, these lipid-mimetic molecules were synthesized by conjugating various thiol-functional lipophilic moieties to an acetylene-terminated polypeptide. All samples were shown to assemble into vesicles in aqueous media, thus this chemistry offers the ability to efficiently produce bilayer assemblies with tailored hydrophobic core properties. These tailored properties could offer the ability to study membrane transport in various chemical/physical environments as well as creating drug delivery vehicles with various release profiles.Acknowledgements
The authors would like to thank Joel Flores and Prof. Charles McCormick (USM) for assistance with GPC, Dr William Jarrett for help with quantitative 13C NMR, Prof. Janan Jayawickrramarajah (Tulane Univ) for use of his CD spectrometer, and Dr Andreas Plagge (USM) for assistance with TEM. Funding was provided by USM startup funds and by the NSF DMR MRI-0421406 for the purchase of the JEOL JEM-2100 electron microscope. JGR was supported by a fellowship from the National Science Foundation GK-12 program “Connections in the Classroom: Molecules to Muscles”, Award #0947944 through the University of Southern Mississippi.References
- M. G. Elferink, J. G. de Wit, R. Demel, A. J. Driessen and W. N. Konings, J. Biol. Chem., 1992, 267, 1375–1381 CAS.
- M. T. Paternostre, M. Roux and J. L. Rigaud, Biochemistry, 1988, 27, 2668–2677 CrossRef CAS.
- A. M. Seddon, P. Curnow and P. J. Booth, Biochim. Biophys. Acta, Biomembr., 2004, 1666, 105–117 CrossRef CAS.
- J. Watanabe, Y. Asaka, K. Mino and S. Kanamura, J. Electron Microsc., 1996, 45, 171–176 CAS.
- A. Aimetti, K. Feaver and K. Anseth, Chem. Commun., 2010, 46, 5781–5783 RSC.
- A. Aimetti, R. Shoemaker, C. Lin and K. Anseth, Chem. Commun., 2010, 46, 4061–4063 RSC.
- B. D. Fairbanks, M. P. Schwartz, A. E. Halevi, C. R. Nuttelman, C. N. Bowman and K. S. Anseth, Adv. Mater., 2009, 21, 5005–5010 CrossRef CAS.
- M. Li, P. De, S. R. Gondi and B. S. Sumerlin, Macromol. Rapid Commun., 2008, 29, 1172–1176 CrossRef CAS.
- M. Li, P. De, H. Li and B. S. Sumerlin, Polym. Chem., 2010, 1, 854–859 RSC.
- M. Lo Conte, S. Pacifico, A. Chambery, A. Marra and A. Dondoni, J. Org. Chem., 2010, 75, 4644–4647 CrossRef CAS.
- B. D. Polizzotti, B. D. Fairbanks and K. S. Anseth, Biomacromolecules, 2008, 9, 1084–1087 CrossRef CAS.
- J. Sun and H. Schlaad, Macromolecules, 2010, 43, 4445–4448 CrossRef CAS.
- J. Babin, J. Rodriguez-Hernandez, S. Lecommandoux, H.-A. Klok and M.-F. Achard, Faraday Discuss., 2005, 128, 179–192 RSC.
- A. Bertin, F. Hermes and H. Schlaad, in Advances in Polymer Science, ed. W. P. meier and W. Knoll, 2010, pp. 167–195 Search PubMed.
- A. Carlsen and S. Lecommandoux, Curr. Opin. Colloid Interface Sci., 2009, 14, 329–339 CrossRef CAS.
- F. Checot, S. Lecommandoux, Y. Gnanou and H.-A. Klok, Angew. Chem., Int. Ed., 2002, 41, 1339–1343 CrossRef CAS.
- K. E. Gebhardt, S. Ahn, G. Venkatachalam and D. A. Savin, Curr. Opin. Colloid Interface Sci., 2008, 317, 70–76 CAS.
- H. Kukula, H. Schlaad, M. Antonietti and S. Foerster, J. Am. Chem. Soc., 2002, 124, 1658–1663 CrossRef CAS.
- R. Sigel, M. Losik and H. Schlaad, Langmuir, 2007, 23, 7196–7199 CrossRef CAS.
- B. M. Discher, D. A. Hammer, F. S. Bates and D. E. Discher, Curr. Opin. Colloid Interface Sci., 2000, 5, 125–131 CrossRef CAS.
- B. M. Discher, Y.-Y. Won, D. S. Ege, J. C. M. Lee, F. S. Bates, D. E. Discher and D. A. Hammer, Science, 1999, 284, 1143–1146 CrossRef.
- J. C. M. Lee, H. Bermudez, B. M. Discher, M. A. Sheehan, Y.-Y. Won, F. S. Bates and D. E. Discher, Biotechnol. Bioeng., 2001, 73, 135–145 CrossRef CAS.
- W. Meier, C. Nardin and M. Winterhalter, Angew. Chem., Int. Ed., 2000, 39, 4599–4602 CrossRef.
- A. Taubert, A. Napoli and W. Meier, Curr. Opin. Chem. Biol., 2004, 8, 598–603 CrossRef CAS.
- S. S. Naik, J. W. Chan, C. Comer, C. E. Hoyle and D. A. Savin, Polym. Chem., 2011, 2, 303–305 RSC.
- I. V. Dimitrov, I. V. Berlinova, P. V. Iliev and N. G. Vladimirov, Macromolecules, 2008, 41, 1045–1049 CrossRef CAS.
- K. E. Gebhardt, S. Ahn, G. Venkatachalam and D. A. Savin, Langmuir, 2007, 23, 2851–2856 CrossRef CAS.
Footnote |
| † Electronic supplementary information (ESI) available: Synthetic protocols, DLS and GPC data. See DOI: 10.1039/c1py00003a |
| This journal is © The Royal Society of Chemistry 2011 |

