DOI:
10.1039/C0PY00376J
(Paper)
Polym. Chem., 2011,
2, 885-891
Effect of PEG content on the properties of biodegradable amphiphilic multiblock poly(ε-caprolactone urethane)s
Received
18th November 2010
, Accepted 4th January 2011
First published on 20th January 2011
Abstract
We have recently developed a new group of cationic biodegradable multiblock poly(ε-caprolactone urethane)s bearing gemini quaternary ammonium pendant groups and methoxyl-poly(ethylene glycol) (m-PEG) end chains. In this study, to endow polyurethane with attractive amphiphilicity and good biocompatibility, and to achieve a fundamental understanding on the structure-property relationship of these polyurethanes in favor of designing and preparing new generation of polyurethanes with more attractive amphiphilicity and better biocompatibility, varying amounts of m-PEG were introduced into the polyurethane chains and the effect of PEG content on the polymer bulk properties was investigated in detail by using Fourier transform infrared (FTIR) spectra, differential scanning calorimetry (DSC), water contact angle (WCA) measurements, polarizing light microscopy (PLM) and in vitrodegradation studies. It was found that the incorporation of PEG has direct effects on the phase behaviors, thermal properties, hydrophilicity and degradable ability of poly(ε-caprolactone urethane)s. Moreover, these polyurethanes exhibit good cytocompatibility, which are promising biodegradable carrier materials in drug delivery and interesting candidates for further study.
Introduction
Over the past decade, amphiphilic block copolymers (ABCs) have attracted great interest because of their unique physicochemical properties and potential applications as promising vehicles for drug delivery and matrices in tissue engineering.1 In this context, a large variety of biodegradable copolymers composed of diverse hydrophilic and hydrophobic segments have been widely developed, and their self-assembly behaviors in aqueous media to form polymeric micelles have been intensively studied in recent years.2 Normally, the hydrophobic segments such as biodegradable poly(ε-caprolactone) (PCL),3 poly(lactic acid) (PLA)4 and some other aliphatic polyester blocks form the micellar core due to their safety profiles and solubilization capacity for poorly water-soluble drugs.5 While the hydrophilic shells used to ensure the water solubility of the micelles are usually comprised of poly(ethylene glycol) (PEG), which is a well-established nonimmunogenic and nontoxic water-soluble polymer used also to prevent interactions with proteins.2,6 As great strides have been made in the development of various amphiphilic block copolymers, the significance of polymer structure-property relationships has gradually been realized and emphasized.7 Up to now, most studies have concentrated on conventional diblock and triblock copolymers, e.g. PLA-PEG,8 PCL-PEG,9PEG-PCL-PEG,10etc. Recently, however, nonlinear multiblock copolymers are gaining more attention, as they have shown enlarged structural diversity, additional chemical functionality, and improved properties as drug carriers, in comparison with traditional linear block copolymers.11 For example, many kinds of ABCs with special structures, such as dendritic,12 star-shaped,13 brushlike14 and hyperbranched15copolymers have been extensively reported for drug delivery applications, and the influence of macromolecular architecture on the performance of polymers has also been reviewed.7,16
Among the actively investigated ABCs, multiblock polyurethane is particularly interesting because it combines facile preparation, desirable mechanical properties, good biocompatibility, and excellent molecular tailorability.17,18 Nevertheless, only a handful of studies have reported the potential use of amphiphilic polyurethanes in drug delivery applications.19 Recently, we have developed a new generation of cationic biodegradable multiblock poly(ε-caprolactone urethane)s containing both gemini quaternary ammonium groups in the hard segments and methoxyl-poly(ethylene glycol) (m-PEG) attached to the chain end.20,21 Our work demonstrated that these polyurethanes exhibited gemini-dependent degradation rates and PEG-mediated controllable micellization behaviors. However, the role of molecular structure on polymer properties is complicated and still poorly understood in such a multi-component system. In this study, to achieve a fundamental understanding of the structure-property relationships of these polyurethanes, varying amounts of m-PEG were introduced into the polyurethane chains. The PEG segment was found to play an important role in tailoring the polymer performance, which is helpful for the exploration of multiblock copolymers with good biocompatibility and biodegradability, as well as attractive nontoxic, amphiphilic and micellization properties.
Experimental
Materials
L-Lysine ethyl ester diisocyanate (LDI) and gemini ammonium salts with two primary amine groups (GA8) were prepared in our laboratory according to references and our previous report.20,22 Biodegradable multiblock poly(ε-caprolactone urethane)s were prepared from LDI, PCL (MW 2000, Dow Chemical), 1,4-butanediol (BDO), GA8 and m-PEG (MW 550, Acros Organics). The detailed synthetic procedure was described in a previous study20 and the feed ratios are shown in Table 1.
Table 1 Molecular characteristics of poly(ε-caprolactone urethane)s
| Samplesa |
Feed ratio (mol) |
Molecular Weightsb |
|
LDI
|
PCL
|
m-PEG
|
GA8
|
BDO
|
M
n(g mol−1) |
M
w(g mol−1) |
M
w/Mn |
|
Poly(ε-caprolactone urethane)s are denoted as GPUXE, where G is for GA8, E is for m-PEG, and X is for the molar content of m-PEG in the soft segment.
Determined by GPC.
|
|
PCLU
|
2 |
1 |
0 |
0 |
1 |
15100 |
21400 |
1.42 |
|
GPU0E
|
2 |
1 |
0 |
0.3 |
0.7 |
9000 |
11600 |
1.29 |
|
GPU5E
|
2 |
0.95 |
0.1 |
0.3 |
0.7 |
8800 |
12500 |
1.42 |
|
GPU10E
|
2 |
0.9 |
0.2 |
0.3 |
0.7 |
20700 |
29300 |
1.42 |
|
GPU20E
|
2 |
0.8 |
0.4 |
0.3 |
0.7 |
11700 |
14700 |
1.26 |
Molecular characterization
Proton nuclear magnetic resonance (1H NMR) spectroscopy (400 MHz) was recorded on a Bruker AV II-400 MHz spectrometer using tetramethylsilane (TMS) as an internal standard in DMSO-d6.
Fourier transform infrared (FTIR) spectra were obtained on a Nicolet 6700 spectrometer (Thermo Electron Corporation) between 4000 and 600 cm−1 at a resolution of 4 cm−1.
Gel Permeation Chromatography (GPC) was performed by a PL-GPC 220 (Polymer Laboratory Ltd., England) using N,N-dimethyl-formamide (DMF)/LiBr as an eluent and polymethyl methacrylate (PMMA) as a reference. The sample concentration was 1.000 mg mL−1, and the flow rate was 1.000 mL/min.
Thermal analysis
Differential scanning calorimetry (DSC) analysis was carried out on a Netzsch STA 449C Jupiter (Germany) protected by nitrogen atmosphere at a heating rate of 10 °C min−1 in the range of −100 to 100 °C. All the samples had identical processing histories prior to measurement. Data were collected from the first and second heating runs. Glass transition temperature (Tg) was taken as the midpoint of the stepwise change on the heat flow trace observed during the second heating run. Melting point (Tm) was determined as peak maxima. Morphological observations of crystallite were carried out using a Leica DMIP polarizing light microscopy (PLM).
Water contact angle measurement
Water contact angle (WCA) was measured with a Drop Shape Analysis System DSA 100 (Kruss, Hamburg, Germany). Samples were cast from solutions of 5 w/v% polyurethanes in DMAc, and dried at 40 °C for 24 h, 50 °C for 12 h, and 60 °C for 3 days under vacuum. The measurements of stationary, advancing, and receding contact angles were performed at both 25 °C and 60 °C, and all the samples were kept for 10 min at set temperatures before experiments.
Degradation study
Degradation study was conducted in phosphate buffer solution (PBS, 100 mM, pH 7.4) and a solution mixture including 13.3 mL of PBS, 3.3 mL of 0.1 wt% MgCl2 and 3.3 mL of Lipase AK (10 mg ml−1, Amano Pharmaceutical Industry Co. Ltd., Japan), respectively, for hydrolytic and enzymatic degradation. Lipase AK was chosen for its high lipolytic activity (no less than 20,000 U/g) and well-documented ability to significantly accelerate the degradation of PCL.23,24 The precast polyurethane membranes with typical dimensions of 15 (length) × 15 (width) × 1 (thickness) mm were weighed and placed into the vials containing degradation solutions, which were incubated with shaking at 52.5 °C (an optimum temperature for Lipase AK24). At preset time points, the samples were removed, washed thoroughly with deionized water, dried at 25 °C to remove traces of water and weighed for mass loss determination. Morphology of degradation was observed under PLM.
Cytotoxicity assay
The relative cytotoxicity of polyurethane extracts was assessed using the methyl tetrazolium (MTT) assay according to a previous study.203T3 mouse fibroblasts were cultivated in Dulbecco's modified Eagle's medium (DMEM, Gibco Life, Grand Island, NY, USA) supplemented with 10% fetal bovine serum (FBS, Hyclone, Logan, UT), 2 mM L-glutamine and 1% antibiotics mixture (Gibco). Taking GPU10E as an example, sterilized polyurethane discs were immersed into the complete culture medium (polymer concentration 100 mg mL−1) and incubated for 24 h. Commercially available biomedical-grade Texin®PUR (Bayer MaterialScience AG, Germany) and inherently cytotoxic latex rubber (Microflex Corp., Sparks, NV) were used as negative and positive controls, respectively. The extraction media was filtered through a 0.22 μm pore-sized syringe filter (Millipore, Carrigtwohill, Co. Cork, Ireland) and individually diluted 10, 50 and 100 times with culture medium. The various concentrations of extracts were added into the cultured 3T3 fibroblast cells (100 μL/well), and incubated at 37 °C for 48–96 h. All experiments were run in sextuplicate for each concentration and time point. The extraction media was removed and 20 μL of MTT solution (5 mg mL−1) was added to each well. After incubating the cells for 4 h, the MTT solution was removed and the insoluble formazan crystals were dissolved in 150 μL dimethyl sulfoxide (DMSO). The absorbance was measured at a wavelength of 490 nm. The cell viability was normalized to that of cells cultured in the negative control. The cell morphology was observed by the Optimas 5.2 image analysis system (Optimas Ltd., USA) attached to an IX2-SL inverted phase contrast microscope (Olympus Ltd, Japan) via a Nikon digital camera.
Statistical analysis
Statistical comparison was carried out utilizing the Statistical Package for the Social Sciences (SPSS, version 17.0) software at 95% confidence levels. Data were expressed as means ± standard deviations.
Results and discussion
Synthesis and characterization of multiblock poly(ε-caprolactone urethane)s
Biodegradable poly(ε-caprolactone urethane)s with gemini cationic pendant groups and various amounts of terminal PEG oligomers were prepared using LDI, PCL, BDO, GA8 and m-PEG in accordance with our reported procedure.20 The obtained polyurethanes are denoted as GPUXE, where G is for GA8, E is for m-PEG, and X is for the molar content of m-PEG in the soft segment. Poly(ε-caprolactone urethane) without both GA8 and PEG groups, namely PCLU, was also prepared for comparison. Fig. 1 illustrates a typical structure of the multiblock polyurethane. By varying the ratio of PCL/m-PEG, the content of PEG oligomers attached to the polymer chain end could be controlled, and the hydrophobic-hydrophilic balance of the polymers was adjusted as well (Table 1).
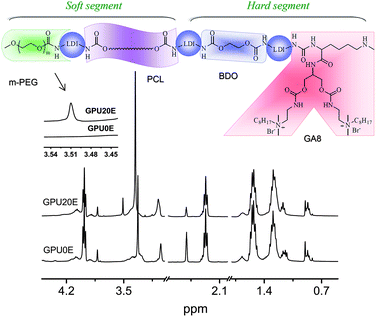 |
| | Fig. 1 A typical structure of multiblock poly(ε-caprolactone urethane) and 1H NMR spectra (400 MHz) of GPU0E and GPU20E in DMSO-d6. | |
Fig. 1 depicts the 1H NMR spectra of GPU0E and GPU20E, where all characteristic peaks for PCL, LDI and GA8 can be found. The peaks at 3.98 (–CH2O–), 2.27 (–CH2COO–), 1.53 (–CH2CH2CH2–) and 1.29 (–CH2CH2CH2–) ppm are assigned to the methylene protons of the PCL units. The chemical shifts of methylene and methyl protons in ethoxyl group of LDI units are at 4.07 (–CH2OCO–) and 1.17 (–CH3) ppm. Peaks at 3.05 (–N(CH3)2), 1.67 (–CH2–) and 0.85 (–CH3) ppm, are ascribed to methyl group of quaternary aminomethyl, methylene and terminal methyl group of octyl group, respectively, showing that the gemini group with two primary amine groups is copolymerized into the chains of polyurethanes. However, peaks at 3.51 ppm (–CH2CH2O–), which are derived from the methylene groups of m-PEG, could be observed only in GPU20E (Fig. 1), thus indicating that corresponding polyurethanes are terminated by m-PEG. All the polyurethanes containing GA8 have moderate molecular weights and quite narrow molecular weight distributions (Table 1), which are consistent with the retention times from Fig. 2. However, it appears that PCLU as a control exhibits a shorter retention time but a lower molecular weight compared with GPU10E (Fig. 2 and Table 1). In fact, similar contradiction has also been observed in our study for other systems with and without gemini quaternary ammonium groups. This may be due to the nonlinear architecture of gemini polyurethanes and the strong interaction between GA8 polar groups and GPC column notwithstanding LiBr employed to weaken the interaction, which leading to the deformation or peak-tailing of retention peaks and thus affecting the calibration and calculation of molecular weights. Hence, more work is needed to fully understand this unusual phenomenon.
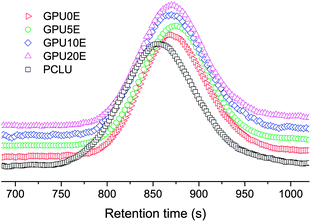 |
| | Fig. 2
GPC traces of poly(ε-caprolactone urethane)s. | |
Phase behavior and thermal properties
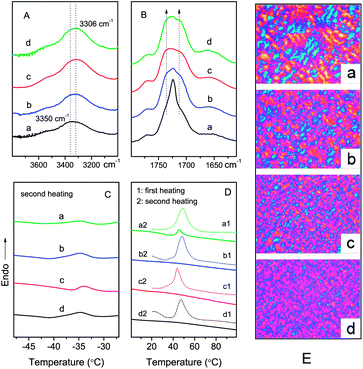
Infrared spectroscopy has been widely used to study the hydrogen bonding and microphase separation in segmented polyurethanes.25–29 Herein, FTIR spectra corresponding to the carbonyl region and amine region for poly(ε-caprolactone urethane)s with different PEG contents are presented in Fig. 3. One can see that with PEG content increasing, a single stretching band at 3300–3350 cm−1, corresponding to the hydrogen-bonded N–H stretching vibration,26,30,31 is shifted to lower frequencies due to an increased hydrogen bonding strength (Fig. 3A).30 While the C![[double bond, length as m-dash]](https://www.rsc.org/images/entities/char_e001.gif) O stretching band is largely broadened because of the absorbance assigned to the free carbonyl groups of PCL soft segments (1725–1733 cm−1) 17,32,33 and hydrogen-bonded carbonyl of urethane groups (1706 cm−1)30,34 gradually increased (Fig. 3B). These results suggest that the hydrogen bonding within hard segments is strengthened and the microphase separation is thus enhanced in the polyurethanes with higher PEG content.25,29
O stretching band is largely broadened because of the absorbance assigned to the free carbonyl groups of PCL soft segments (1725–1733 cm−1) 17,32,33 and hydrogen-bonded carbonyl of urethane groups (1706 cm−1)30,34 gradually increased (Fig. 3B). These results suggest that the hydrogen bonding within hard segments is strengthened and the microphase separation is thus enhanced in the polyurethanes with higher PEG content.25,29
 |
| | Fig. 3
FTIR spectra in the (A) NH and (B) CO stretching regions, DSC thermograms (C, D) and PLM images (E) of poly(ε-caprolactone urethane)s (500×): (a) GPU0E, (b) GPU5E, (c) GPU10E and (d) GPU20E. | |
To further understand the phase behavior, DSC and PLM results are depicted in Table 2 and Fig. 3. Evidently, a slightly decreased Tg is observed as more PEG groups are incorporated (Fig. 3C, Table 2), demonstrating an improved microphase separation between hard and soft segments in the polyurethanes after introducing PEG segments into the polymer chain end.35 The relults are in agreement with FTIR analysis. However, it is also noticed that the Tg of GPU10E is relatively higher than other samples. This is understandable since GPU10E possesses the highest molecular weight among all the polyurethanes, which is in favor of phase mixing between soft and hard segments.36 The endotherm around 50 °C is attributed to the melting temperatures (Tm) of the PCL soft segments (Fig. 3D). Utilizing the area under the endotherm, percent crystallinity of the soft segment can be calculated (Table 2). The results show that all the polyurethanes are semi-crystalline, with crystallinity lower than 50%. Since PEG segments are amorphous under the experimental condition, only PCL contributes to the soft segment crystallinity. However, PEG does have a direct effect on the crystallization of PCL, such as a decreased Tm and a diminished crystallinity degree of PCL from 46.3% to ∼35% occurred in the samples containing more PEG (Table 2). As stated above, the hydrogen bonding within the hard segments is enhanced with an increase of PEG concentration, leading to a higher degree of phase separation and higher purity of the hard segment domains, which may push the PEG chains into the soft microphase. Hence, the crystallization of PCL segments is hindered owing to the PEG segment mixed in the soft segment phase,37 resulting in the disappearance of melting feature after eliminating the heat history at 100 °C (Fig. 3D). The conclusion is intuitively supported by the PLM micrographs, where the crystalline size of PCL soft segments is reduced by PEG moieties (Fig. 3E).
Table 2 Thermal properties of poly(ε-caprolactone urethane)s
| Sample |
T
g (°C) |
ΔTga (°C) |
T
m (°C) [ΔHm (J g−1)] |
X
c
b(%) |
|
ΔTg = Tg, terminal − Tg, onset.
Crystallinity of PCL is calculated from the equation: Xc = ΔHm/(ΔHm0fw) × 100%, where ΔHm is the melting enthalpy determined by DSC, ΔHm0 (136 J g−1) is the melting enthalpy for 100% crystalline PCL, and fw is the weight fraction of PCL component in the polymers.
|
|
GPU0E
|
−36.6 |
2.6 |
48.9 [45.5] |
46.3 |
|
GPU5E
|
−37.8 |
4.2 |
48.3 [42.0] |
44.3 |
|
GPU10E
|
−36.0 |
3.3 |
46.9 [31.4] |
34.4 |
|
GPU20E
|
−38.1 |
6.2 |
47.5 [29.9] |
35.6 |
Water contact angle
To characterize the relative hydrophilicity of multiblock polyurethanes, WCA measurements were carried out, and the results are shown in Fig. 4. One observes a dramatic decrease in contact angles of water on the surfaces of polymers containing GA8, indicating significantly enhanced hydrophilicity in the presence of these hydrophilic groups. On the other hand, it is generally recognized that incorporation of PEG into copolymers can enhance the hydrophilicity and reduce the WCAs of polymer bulk.38 In this study, water contact angles are surprisingly found to increase slightly with increasing PEG content at room temperature (Fig. 4). This is difficult to explain simply since the surface properties are also affected by many other factors such as chemical heterogeneity, surface restructuring and roughness.39 To better understand this interesting phenomenon, the WCA measurements were also performed at 60 °C, a temperature above Tm, where the crystallization structures of polyurethanes are disturbed. As a result, much higher stationary, advancing, and receding contact angles as well as hysteresis are observed on the molten membranes at 60 °C than those at 25 °C, except for PCL and PCLU. Furthermore, the polymers with higher PEG content exhibit lower contact angle values as expected (Fig. 4), which is contrary to that observed at room temperature, revealing that the overall hydrophilicity of the polyurethanes was actually improved by PEG segments. This interesting phenomenon could be explained by chain arrangement and phase separation induced by soft segment crystallization. The schematic mechanism for WCA variation is presented in Fig. 5. At room temperature, PCL soft segments are regularly folded and GA8 chains are constrained to stay between the crystal lamellae, while only the terminal PEG groups are most likely to appear on the film surface due to their motility, resulting in the improved hydrophilicity and decreased contact angles and hysteresis (Fig. 5A). With an increase of PEG content, the soft segment crystallization is slightly inhibited and the long hydrophobic hydrocarbon chains of GA8 can migrate to the surface, thus leading to a mild increase of WCAs, though the surface PEG concentration is higher (Fig. 5B). The significantly higher contact angle values obtained at 60 °C are caused by much more hydrophobic alkyl chains existing on the molten polymer surface (Fig. 5A′), and these values can be further decreased by more PEG incorporated (Fig. 5B′). In addition, the hysteresis at 60 °C is relatively higher than that at 25 °C, which is attributed to the enhance of surface mobility and surface rearrangement occurred upon heating.40 Even so, further studies are necessary for better understanding of this interesting phenomenon.
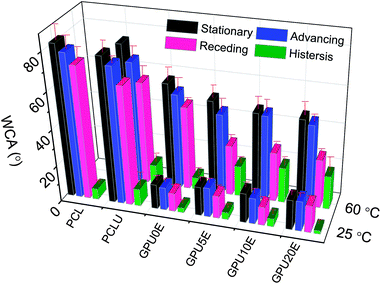 |
| | Fig. 4
Water contact angle measurement results for poly(ε-caprolactone urethane) membrane surfaces. | |
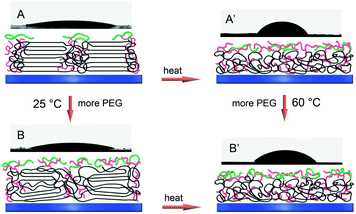 |
| | Fig. 5 Schematic mechanism for the variation of water contact angle values. A and A′ represent samples with lower PEG content, while B and B′ indicate those with higher PEG content. | |
Hydrolytic and enzymatic degradation
Degradable biomaterials for controlled drug release should feature both excellent biocompatibility and well-controlled kinetics of degradation. For multiblock poly(ε-caprolactone urethane), a gemini-dependent degradation rate has been demonstrated in a previous study.20 Herein, we focus on the effect of PEG content on the degradation behaviors. As depicted in Fig. 6, PCL displays a rapid weight loss due to its relatively low molecular weight, while PCLU exhibits the slowest degradation. However, samples containing gemini or m-PEG are degraded considerably faster than PCLU, and the degradation rates increase slightly with PEG contents, owning to the further enhanced hydrophilicity, reduced crystallinity and lowered melting points with the incorporation of PEG (Table 2).41–46 Moreover, it is also noticeable in Fig. 6 that the hydrolysis rates increase in the presence of Lipase AK, as has been well documented for other kinds of biodegradable polymers.47 The morphology of polyurethane during degradation was captured by PLM, a convenient and economical technique approach for morphological observation, which does not necessitate high vacuum or gold coating and can also prevent artifacts.20 As shown in Fig. 6, cracky and porous structures appear on the polyurethane surfaces during the degradation. As the accessible amorphous regions on the polymer surfaces are preferentially degraded, the crystalline domains remain in the pore (Fig. 6F). Further morpological observation and sturctural analysis of degradation products are needed and ongoing to investigate the degradation mechanism.
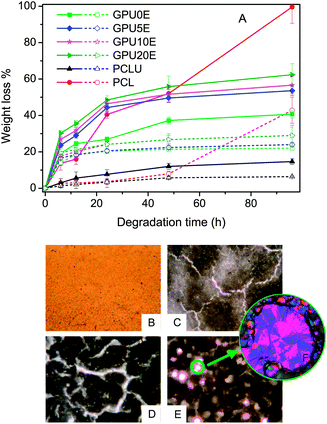 |
| | Fig. 6 (A) In vitrodegradation profile of poly(ε-caprolactone urethane)s, where weight loss is shown as a function of degradation time for different samples. Short dash lines and open symbols represent data for hydrolysis in the absence of enzymes, while solid lines and symbols represent data for enzymatic hydrolysis. Error bars represent means ± standard deviation for n = 3. (B–F) PLM images of polyurethane films after hydrolysis for 0 h (B), 6 h (C), 24 h (D) and 96 h (E) (50 ×). (F) Enlarged image of (E) (500 ×). | |
Cytotoxicity
For most cationic carriers, cytotoxicity is known as a big challenge, as they can disturb the membrane integrity, decrease the metabolic activity or activate the intracellular signal transduction pathways after interaction with cells.48 However, it is also well recognized that reduced amount of charged groups incorporated and low concentrations of the cationic polymers used, as well as their biodegradable properties can be helpful for improving the material biocompatibility, thus would be more advantageous to be safe in clinical applications.49,50 In this study, the cytocompatibility of multiblock poly(ε-caprolactone urethane)s against 3T3 mouse fibroblasts was studied by using the MTT assay. Fig. 7A represents the original morphology of fibroblasts before exposure to polymer extracts, while Fig. 7B–D show the cell proliferation after 48 h of incubation with undiluted extracts media. Evidently, the poly(ε-caprolactone urethane)s studied do not show any inhibition effect on cell proliferation in comparison with positive controls. The cell viabilities quantified by MTT assay are in good agreement with cell morphology observation, where 26% and 12% cell viabilities are observed for positive controls, and over 96% cell viabilities are retained for GPU10E after incubation for 48 and 96 h, respectively, suggesting that this material is biocompatible as well (Fig. 7E). Moreover, we have recently demonstrated that the degradation products of these polyurethanes with higher concentration of cationic groups are nontoxic at a high concentration (10 mg mL−1).20 Additionally, our ongoing work has also proved that micellar solutions of these polyurethane exhibit good cytocompatibility, and the incorporation of PEG can improve the biocompatibility of cationic micelles.
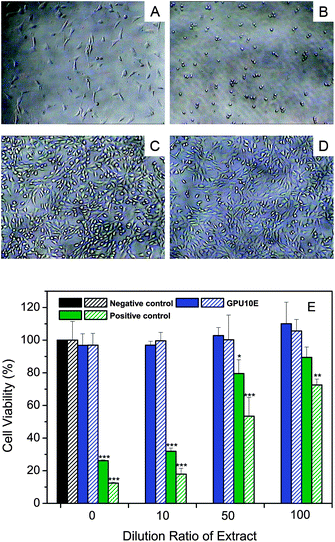 |
| | Fig. 7 (A) Light microscopy images of 3T3 cells before incubation with polymer extracts, compared with those of cells incubated with undiluted extracts (100 mg mL−1) of (B) positive control (latex rubber), (C) negative control (Texin®PUR) and (D) GPU10E for 48 h (100×). (E) Cell viability measured by MTT assay after 48 h (filled bars) and 96 h (patterned bars) of incubation with different dilutions of polymer extracts. Statistical significance: *p < 0.05; **p < 0.01; ***p < 0.005. | |
Conclusions
In summary, a series of biodegradable multiblock poly(ε-caprolactone urethane) amphiphiles, capped by various amounts of PEG, were successfully prepared and characterized. The incorporation of PEG restraines the PCL segment crystallization, affects the chain arrangement and microphase separation, and thus leads to interesting variation of water contact angles in response to temperature changes. The polyurethanes exhibit moderately enhanced hydrolytic and enzymatic degradation rates, due to the decreased crystallinity and improved hydrophilicity in the presence of PEG end groups. In addition, the extracts of polyurethanes manifest good cytocompatibility against fibroblasts. Our work offers a deep understanding of the relationship between structure and property of these polyurethanes, which is valuable for the design and further optimization of multiblock polyurethanes with good biocompatibility, adjustable biodegradability and desirable amphiphilicity.
Acknowledgements
Financial supports from National Natural Science Foundation of China (20774061) and National 863 project (2008AA03Z304) are acknowledged. We thank Prof. Yong Wang from Key Laboratory of Advanced Technologies of Materials, School of Materials Science & Engineering, Southwest Jiaotong University, for DSC measurements.
References
- K. Kataoka, A. Harada and Y. Nagasaki, Adv. Drug Delivery Rev., 2001, 47, 113 CrossRef CAS.
- G. Gaucher, M. Dufresne, V. P. Sant, N. Kang, D. Maysinger and J. Leroux, J. Controlled Release, 2005, 109, 169 CrossRef CAS.
- R. Savić, L. Luo, A. Eisenberg and D. Maysinger, Science, 2003, 300, 615 CrossRef CAS; V. Darcos, S. El Habnouni, B. Nottelet, A. El Ghzaoui and J. Coudane, Polym. Chem., 2010, 1, 280 RSC.
- L. Yang, X. Wu, F. Liu, Y. Duan and S. Li, Pharm. Res., 2009, 26, 2332 CAS; C. Zhan, B. Gu, C. Xie, J. Li, Y. Liu and W. Lu, J. Controlled Release, 2010, 143, 136 CrossRef CAS.
- G. Gaucher, R. H. Marchessault and J. Leroux, J. Controlled Release, 2010, 143, 2 CrossRef CAS.
- L. van Vlerken, T. Vyas and M. Amiji, Pharm. Res., 2007, 24, 1405 CrossRef CAS.
- L. Qiu and Y. Bae, Pharm. Res., 2006, 23, 1 CrossRef CAS.
- T. Riley, C. R. Heald, S. Stolnik, M. C. Garnett, L. Illum, S. S. Davis, S. M. King, R. K. Heenan, S. C. Purkiss, R. J. Barlow, P. R. Gellert and C. Washington, Langmuir, 2003, 19, 8428 CrossRef CAS.
- M. Forrest, J. Yáñez, C. Remsberg, Y. Ohgami, G. Kwon and N. Davies, Pharm. Res., 2008, 25, 194 CrossRef CAS; A. S. Mikhail and C. Allen, Biomacromolecules, 2010, 11, 1273 CrossRef CAS.
- Y. Zhang and R. X. Zhuo, Biomaterials, 2005, 26, 6736 CrossRef CAS.
- T. Zou, S. Li, X. Zhang, X. Wu, S. Cheng and R. Zhuo, J. Polym. Sci., Part A: Polym. Chem., 2007, 45, 5256 CrossRef CAS.
- P. Lundberg, M. V. Walter, M. I. Montanez, D. Hult, A. Hult, A. Nystrom and M. Malkoch, Polym. Chem., 2011 10.1039/c0py00258e.
- P. Gou, W. Zhu and Z. Shen, Biomacromolecules, 2010, 11, 934 CrossRef CAS; L. Y. Qiu, R. J. Wang, C. Zheng, Y. Jin and L. Q. Jin, Nanomedicine, 2010, 5, 193 CrossRef CAS.
- J. Du, L. Tang, W. Song, Y. Shi and J. Wang, Biomacromolecules, 2009, 10, 2169 CrossRef CAS; W. Zhang, Y. Li, L. Liu, Q. Sun, X. Shuai, W. Zhu and Y. Chen, Biomacromolecules, 2010, 11, 1331 CrossRef CAS.
- M. Prabaharan, J. J. Grailer, S. Pilla, D. A. Steeber and S. Gong, Biomaterials, 2009, 30, 3009 CrossRef CAS; J. Liu, Y. Pang, W. Huang, X. Zhu, Y. Zhou and D. Yan, Biomaterials, 2010, 31, 1334 CrossRef CAS.
- K. Khanna, S. Varshney and A. Kakkar, Polym. Chem., 2010, 1, 1171 RSC.
- J. Guan, M. S. Sacks, E. J. Beckman and W. R. Wagner, J. Biomed. Mater. Res., 2002, 61, 493 CrossRef CAS.
- Y. Hong, J. Guan, K. L. Fujimoto, R. Hashizume, A. L. Pelinescu and W. R. Wagner, Biomaterials, 2010, 31, 4249 CrossRef CAS.
- X. J. Loh, S. H. Goh and J. Li, Biomaterials, 2007, 28, 4113 CrossRef CAS; J. Zhang, M. Wu, J. Yang, Q. Wu and Z. Jin, Colloids Surf., A, 2009, 337, 200 CrossRef CAS.
- M. Ding, J. Li, X. Fu, J. Zhou, H. Tan, Q. Gu and Q. Fu, Biomacromolecules, 2009, 10, 2857 CrossRef CAS.
- M. Ding, L. Zhou, X. Fu, H. Tan, J. Li and Q. Fu, Soft Matter, 2010, 6, 2087 RSC.
- Y. Zhang and R. Zhuo, Biomaterials, 2005, 26, 6736 CrossRef CAS.
- D. Darwis, H. Mitomo, T. Enjoji, F. Yoshii and K. Makuuchi, Polym. Degrad. Stab., 1998, 62, 259 CrossRef CAS.
- H. A. Abdel-Rehim, F. Yoshii and T. Kume, Polym. Degrad. Stab., 2004, 85, 689 CrossRef CAS.
- R. Hernandez, J. Weksler, A. Padsalgikar, T. Choi, E. Angelo, J. S. Lin, L. Xu, C. A. Siedlecki and J. Runt, Macromolecules, 2008, 41, 9767 CrossRef CAS.
- M. van der Schuur, B. Noordover and R. J. Gaymans, Polymer, 2006, 47, 1091 CrossRef CAS.
- N. Luo, D. Wang and S. Ying, Macromolecules, 1997, 30, 4405 CrossRef CAS.
- E. Yilgör, E. Yurtsever and I. Yilgör, Polymer, 2002, 43, 6561 CrossRef CAS.
- G. Lligadas, J. C. Ronda, M. Galia and V. Cadiz, Biomacromolecules, 2007, 8, 1858 CrossRef CAS.
- H. Tan, J. Li, M. Guo, R. Du, X. Xie, Y. Zhong and Q. Fu, Polymer, 2005, 46, 7230 CrossRef CAS.
- A. Marcos-Fernández, G. A. Abraham, J. L. Valentín and J. S. Román, Polymer, 2006, 47, 785 CrossRef CAS.
- G. A. Skarja and K. A. Woodhouse, J. Appl. Polym. Sci., 2000, 75, 1522 CrossRef CAS.
- X. J. Loh, K. B. Colin Sng and J. Li, Biomaterials, 2008, 29, 3185 CrossRef CAS.
- I. Yilgor, E. Yilgor, S. Das and G. L. Wilkes, J. Polym. Sci., Part B: Polym. Phys., 2009, 47, 471 CrossRef CAS.
- C. B. Wang and S. L. Cooper, Macromolecules, 1983, 16, 775 CrossRef.
- Y. Zhu, J. L. Hu, K. W. Yeung, Y. Q. Liu and H. M. Liem, J. Appl. Polym. Sci., 2006, 100, 4603 CrossRef CAS.
- H. M. Jeong, B. K. Ahn and B. K. Kim, Polym. Int., 2000, 49, 1714 CrossRef CAS.
- J. K. Tessmar and A. M. Göpferich, Macromol. Biosci., 2007, 7, 23 CrossRef CAS.
- M. Taniguchi, J. P. Pieracci and G. Belfort, Langmuir, 2001, 17, 4312 CrossRef CAS; M. Taniguchi and G. Belfort, Langmuir, 2002, 18, 6465 CrossRef CAS.
- J. A. Grapski and S. L. Cooper, Biomaterials, 2001, 22, 2239 CrossRef CAS.
- G. Seretoudi, D. Bikiaris and C. Panayiotou, Polymer, 2002, 43, 5405 CrossRef CAS.
- J. H. Hong, H. J. Jeon, J. H. Yoo, W. Yu and J. H. Youk, Polym. Degrad. Stab., 2007, 92, 1186 CrossRef CAS.
- H. Yeganeh and P. Hojati-Talemi, Polym. Degrad. Stab., 2007, 92, 480 CrossRef CAS.
- S. Li, M. Pignol, F. Gasc and M. Vert, Macromolecules, 2004, 37, 9798 CrossRef CAS.
- J. Guan, M. S. Sacks, E. J. Beckman and W. R. Wagner, Biomaterials, 2004, 25, 85 CrossRef CAS.
- G. Z. Papageorgiou and D. N. Bikiaris, Biomacromolecules, 2007, 8, 2437 CrossRef CAS.
- G. Z. Papageorgiou, A. A. Vassiliou, V. D. Karavelidis, A. Koumbis and D. N. Bikiaris, Macromolecules, 2008, 41, 1675 CrossRef CAS.
- D. Fischer, Y. Li, B. Ahlemeyer, J. Krieglstein and T. Kissel, Biomaterials, 2003, 24, 1121 CrossRef CAS.
- E. Kohli, H. Han, A. D. Zeman and S. V. Vinogradov, J. Controlled Release, 2007, 121, 19 CrossRef CAS.
- G. Lu, D. Wu and R. Fu, React. Funct. Polym., 2007, 67, 355 CrossRef CAS.
|
| This journal is © The Royal Society of Chemistry 2011 |
Click here to see how this site uses Cookies. View our privacy policy here.