Synergistic temperature and pH effects on glass (Tg) and stimuli-responsive (TSR) transitions in poly(N-acryloyl-N′-propylpiperazine-co-2-ethoxyethyl methacrylate) copolymers†
Fang
Liu
,
William L.
Jarrett
and
Marek W.
Urban
*
Shelby F. Thames Polymer Science Research Center, School of Polymers and High Performance Materials, The University of Southern Mississippi, Hattiesburg, Mississippi 39406, USA
First published on 1st February 2011
Abstract
N-Acryloyl-N′-propylpiperazine (AcrNPP) and 2-ethoxyethyl methacrylate (EEMA) monomers were copolymerized to form random stimuli-responsive p(AcrNPP/EEMA) copolymers in a form of colloidal dispersions which upon coalesce form uniform films. The presence of AcrNPP units facilitates temperature and pH responsiveness, thus resulting in composition-dependent and pH–temperature sensitive endothermic transitions: the glass (Tg) and stimuli-responsive (TSR) transitions. These studies show that the relationship between the newly discovered TSR and known Tg relaxations can be predicted by the following formula: 1/TSR = [Tg1 × Tg2 × (Tbinary − T)]/[Tbinary × T × (Tg1 − Tg2) × Tg] + (Tg1 × T − Tbinary × Tg2)/[Tbinary × T × (Tg1 − Tg2)], where TSR is the stimuli-responsive transition temperature, Tg is the glass transition temperature of the copolymer; Tbinary is the temperature of stimuli-responsive homopolymer in a binary polymer–water equilibrium, Tg1 and Tg2 are the glass transition temperatures of stimuli-responsive and non-stimuli-responsive homopolymers, respectively, and T is the film formation temperature. Experimental spectroscopic and differential scanning calorimetry (DSC) evidence showed that dipole–dipole interactions are responsible for the molecular changes at the TSR for a non-protonated state, and the shift of the TSR under protonated conditions is attributed to the synergistic pH and temperature effects associated with H-bonding and conformational backbone and side chain rearrangements. Computer simulations also showed that the buckling of the copolymer backbone and collapse of propylpiperazine groups occur above TSR. The total energies (ΔEtotal) of the TSR transitions for protonated and non-protonated states are 159 and 132 kcal mol−1, respectively, and are in good agreement with the energy values determined experimentally (DSC).
Introduction
Continuous interest in stimuli-responsive polymers results from an ongoing quest for materials capable of adapting to new environments induced by physical, chemical, or biological stimuli.1,2 While Mother Nature offers abundance of examples ranging from molecular recognitions to autonomous healing, most synthetic efforts focused on temperature and pH responsive polymeric solutions. A common approach3–9 to achieve simultaneous temperature and pH-responsiveness is to copolymerize temperature- and pH-sensitive monomers within the same polymer backbone. While stimuli-responsiveness is relatively easily obtainable in a solution state, the main challenges are in soft matter solids. After all, one would like to maintain their solid state properties and, at the same time, achieve stimuli-responsiveness. One approach in generating these attributes is to tune macromolecular chains by incorporating functional and responsive components at a copolymer level.2 Recent studies have shown that new endothermic stimuli-responsive transitions (TSR) are detected in copolymer films that consist of copolymerized stimuli-responsive and low Tg components.10 Recent studies11 have also shown that the semi-empirical relationship 1/TSR = w1/Tbinary + w2/T may serve to predict the TSR transition in stimuli responsive copolymers as a function of their composition. This can be also expressed as log(V1/V2) = (P1 × (TSR − Tg))/(P2 + (TSR − Tg)), where V1 and V2 are the copolymer total volumes below and above the TSR, respectively, Tg is the glass transition temperature of the copolymer, and P1 and P2 are the fraction of the free volume (ffree) at Tg (P1) and ((Tg midpoint − TSR)50/50) for each random copolymer (P2), respectively. This is the first study that expanded the Fox equation, thus allowing predictions of the total volume changes as a function of copolymer compositions in stimuli-responsive copolymers. If one assumes that P1 ≈ ffree, the P2 values can be approximated to the temperature difference between the Tg midpoint and TSR ((Tg midpoint − TSR)50/50) for random copolymers with the 50![[thin space (1/6-em)]](https://www.rsc.org/images/entities/char_2009.gif) :
:![[thin space (1/6-em)]](https://www.rsc.org/images/entities/char_2009.gif) 50 ratio. However, as copolymer network shrinks at the TSR, the copolymer density will change (M = ρ × V, where M is the total mass, ρ is the density, and V is the total volume), and V1 and V2 can be substituted by copolymer densities ρa and ρb below and above the TSR. Thus, the density changes as a function of the (TSR − Tg) for different copolymer compositions can be determined. Although the observed TSR transitions typically arise from localized and often orchestrated polymer backbone buckling as well as the side group rearrangements of stimuli-responsive components facilitated by low Tg components, other structural changes cannot be ruled out. The overall effect is macroscopic, where the low Tg copolymerized monomers facilitate sufficient free volume, thus satisfying spatial macromolecular rearrangements and energetic requirements. In view of these considerations these studies attempt to establish the relationship between the TSR and the Tg for pH and temperature responsive poly(N-acryloyl-N′-propylpiperazine/2-ethoxyethyl methacrylate) p(AcrNPP/EEMA) random copolymers as a function of the monomer composition.
50 ratio. However, as copolymer network shrinks at the TSR, the copolymer density will change (M = ρ × V, where M is the total mass, ρ is the density, and V is the total volume), and V1 and V2 can be substituted by copolymer densities ρa and ρb below and above the TSR. Thus, the density changes as a function of the (TSR − Tg) for different copolymer compositions can be determined. Although the observed TSR transitions typically arise from localized and often orchestrated polymer backbone buckling as well as the side group rearrangements of stimuli-responsive components facilitated by low Tg components, other structural changes cannot be ruled out. The overall effect is macroscopic, where the low Tg copolymerized monomers facilitate sufficient free volume, thus satisfying spatial macromolecular rearrangements and energetic requirements. In view of these considerations these studies attempt to establish the relationship between the TSR and the Tg for pH and temperature responsive poly(N-acryloyl-N′-propylpiperazine/2-ethoxyethyl methacrylate) p(AcrNPP/EEMA) random copolymers as a function of the monomer composition.
Experimental section
N-Acryloyl-N′-propylpiperazine (AcrNPP) (99%) was purchased from Eastern Systems, Inc. Hexadecyltrimethylammonium chloride (HTAC) solution (25 wt% in H2O) was purchased from Fluka Chemical Co. 2,2′-Azobisisobutyronitrile (AIBN) (98%), 2-ethoxyethyl methacrylate (EEMA) (99%), and 0.1 N volumetric standard solutions of sodium hydroxide (NaOH) and hydrochloride acid (HCl) were purchased from Aldrich Chemical Co.p(AcrNPP/EEMA) copolymers were synthesized using the semicontinuous emulsion polymerization process outlined elsewhere12 which was adapted for a small scale polymerization. The reaction flask was immersed in a water bath preheated to 75 °C and purged continuously with N2 gas. The reactor was first charged with 27 mL of double deionized (DDI) water, and after purging N2 for 30 min, the content was stirred at 300 rpm. At this point, pre-emulsion (DDI, 25 mL; HTAc, 0.62 g; weight-rationed monomers, 5.6 g; and oil-soluble initiator AIBN, 0.1 g) was fed at 0.156 mL min−1 into the vessel over a period of 3 h. After completion of feeding pre-emulsion the reaction was continued for extra 3 h. The resulting colloidal dispersion was filtered after cooling to ambient temperature, and the pH value determined by potentiometric titration of the resulting original colloidal dispersion is approximately 8.5.
Potentiometric titrations were performed at 22 °C using Orion pH meter Model 350 with a glass combination electrode (Orion 9202 BN). Autocalibration against standard buffer solutions was done before titration. HCl and NaOH standards were utilized to adjust pH values of p(AcrNPP/EEMA) aqueous dispersions.
Molecular weight was determined using gel permeation chromatography (Waters, Inc.) equipped with a 515 HPLC pump and a 2414 model refractive index detector. Each sample was precipitated in tetrahydrofuran (THF) and eluted through a 5 µm Mixed-C column. Elution times were referenced against polystyrene standards, and molecular weights of p(AcrNPP/EEMA) copolymers are within 1.41–1.77 × 10⁵ g mol−1. Morphologies of colloidal particles were determined using a Zeiss EM 109-transmission electron microscope (TEM) in which colloidal dispersions were diluted to a 20![[thin space (1/6-em)]](https://www.rsc.org/images/entities/char_2009.gif) :
:![[thin space (1/6-em)]](https://www.rsc.org/images/entities/char_2009.gif) 1 volume ratio and deposited on a Formvar coated copper TEM grid (Ted Pella).
1 volume ratio and deposited on a Formvar coated copper TEM grid (Ted Pella).
Polymeric films were prepared by casting colloidal dispersions onto a poly(tetrafluoroethylene) (PTFE) substrate and allowed to coalescence at 65% relative humidity (RH) for 72 h at 22 °C in an environmental chamber. In a typical experiment, approximately 200 µm thick films were obtained. Differential scanning calorimetry (DSC) measurements were performed on a TA Instruments DSC Q 100 using a scanning rate of 3 °C min−1 from −45 to 80 °C under a N2 atmosphere. Multiple DSC thermal cycles were conducted using the following heating–cooling schedule: the p(AcrNPP/EEMA) specimen was equilibrated at −45 °C for 5 min, followed by heating at 3 °C min−1 to 80 °C, equilibrating at 80 °C for 5 min, and cooling down at 3 °C min−1 to −45 °C. The same cycle was repeated several times. The resulting data were analyzed using TA Universal Analysis software.
Proton NMR (1H NMR) spectra were acquired using a Varian Mercury 300 MHz NMR spectrometer. Typical measurement conditions involved 45° pulse, relaxation delay 1 s, and acquisition time of 1.998 s. The spectrum represents co-addition of 256 scans. In 1H NMR measurements, 3.23% w/v of p(AcrNPP/EEMA) copolymer was dissolved in deuterated chloroform (CDCl3).
Microscopic attenuated total reflectance Fourier transform infrared (ATR FT-IR) spectra were collected on a Bio-Rad FTS-6000 FT-IR single-beam spectrometer set at 4 cm−1 resolution equipped with a deuterated triglycine sulfate (DTGS) detector. A 2 mm Ge crystal with a 45° face angle maintaining constant contact pressure between the crystal and the specimens was used. Each spectrum was collected on the film interface with attached heating elements and represented 100 co-added scans ratioed to 100 scans collected on an empty ATR cell. All spectra were corrected for spectral distortions by Q-ATR software using the Urban–Huang algorithm.13
Quantum mechanical semi-empirical calculations were conducted using Material Studio software (Accelrys Inc., Version 4.1). Computer modeling simulations were performed using a classical (Newtonian) molecular dynamics theory combined with the COMPASS force field conditions. In the first step, we created infinite polymer long chains containing AcrNPP and EEMA monomer units using 3D periodic boundary conditions, such that the local thermo-induced flux was set proportional to the local atom density changes and local thermodynamic driving forces of the chemical potential. In an effort to determine thermodynamic responses of molecular segments, a 24 × 24 × 24 Å3 periodic unit cell containing 5 polymer chains and 1410 atoms (1410 asymmetric units) was constructed and temperature was the control parameter to simulate the heat exchange with the environment. This method involves computing NVT (constant number, volume, and temperature) molecular dynamics at a set temperature using 25![[thin space (1/6-em)]](https://www.rsc.org/images/entities/char_2009.gif) 000 steps and 25 picosecond (ps) (dynamic times), followed by another NPT (constant number, pressure, and temperature) molecular dynamics with 5 × 10⁴ steps and dynamic times 50 ps, then NVE (constant number, volume, and energy) molecular dynamics with 100
000 steps and 25 picosecond (ps) (dynamic times), followed by another NPT (constant number, pressure, and temperature) molecular dynamics with 5 × 10⁴ steps and dynamic times 50 ps, then NVE (constant number, volume, and energy) molecular dynamics with 100![[thin space (1/6-em)]](https://www.rsc.org/images/entities/char_2009.gif) 000 steps and 100 ps. The purpose of this 3-step process is to simulate energy, volume, and conformational changes at different temperatures. The same unit cell was constructed and same 3-step molecular dynamics process was utilized for the protonation simulation, but the valence state of amine functional groups was the control parameter.
000 steps and 100 ps. The purpose of this 3-step process is to simulate energy, volume, and conformational changes at different temperatures. The same unit cell was constructed and same 3-step molecular dynamics process was utilized for the protonation simulation, but the valence state of amine functional groups was the control parameter.
Results and discussion
To determine the effect of pH and temperature responsiveness on the TSR, we synthesized p(AcrNPP/EEMA) colloidal particles, which were coalesced to form continuous films. While the ESI† provides detailed chemical, structural, and compositional analysis as well as colloidal particle morphologies of the copolymer, Fig. 1A illustrates DSC thermograms of p(AcrNPP/EEMA) coalesced films as a function of temperature. As seen, two endothermic transitions at ∼17 and 30 °C are observed. While the 17 °C transition is due to the Tg of the copolymer, the endothermic transition with a minimum at 30 °C is attributed to the TSR transition.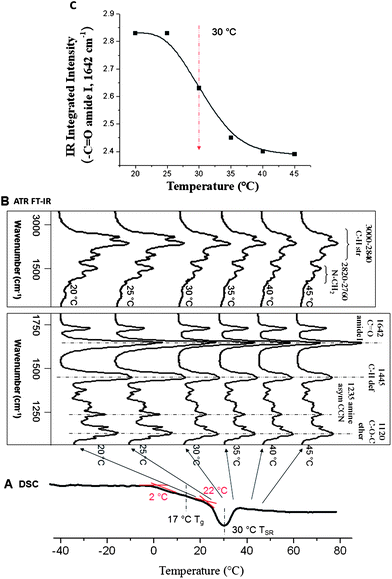 | ||
Fig. 1
DSC curves (A) and ATR FT-IR spectra (B) of p(AcrNPP/EEMA) copolymer films (weight ratio = 1![[thin space (1/6-em)]](https://www.rsc.org/images/entities/char_2009.gif) : :![[thin space (1/6-em)]](https://www.rsc.org/images/entities/char_2009.gif) 1). (C) Integrated area of –C 1). (C) Integrated area of –C![[double bond, length as m-dash]](https://www.rsc.org/images/entities/char_e001.gif) O amide group at 1642 cm−1 plotted as a function of temperature. O amide group at 1642 cm−1 plotted as a function of temperature. | ||
In an effort to determine copolymer composition and molecular mobility of p(AcrNPP/EEMA) films at different temperatures, ATR FT-IR spectra were collected at 20, 25, 30, 35, 40, and 45 °C. Analysis of the series of spectra illustrated in Fig. 1B shows characteristic bands14–19 at 3000–2840 (C–H str), 2820–2760 (>N–CH2), 1642 (C![[double bond, length as m-dash]](https://www.rsc.org/images/entities/char_e001.gif) O amide I), 1445 (C–H def), and 1235 (asym CCN) cm−1, which decrease at elevated temperatures. As expected, the copolymer undergoes transition from extended to collapsed states, which consequently reduces the molecular mobility, and results in the decrease of IR band intensities at higher temperatures. Spectroscopic analysis also indicates that the main molecular entities responding to temperature changes are the C–H vibrations of the backbone/side groups as well as amide and propylpiperazine groups of the AcrNPP component. As an example, Fig. 1C illustrates the integrated area of the –C
O amide I), 1445 (C–H def), and 1235 (asym CCN) cm−1, which decrease at elevated temperatures. As expected, the copolymer undergoes transition from extended to collapsed states, which consequently reduces the molecular mobility, and results in the decrease of IR band intensities at higher temperatures. Spectroscopic analysis also indicates that the main molecular entities responding to temperature changes are the C–H vibrations of the backbone/side groups as well as amide and propylpiperazine groups of the AcrNPP component. As an example, Fig. 1C illustrates the integrated area of the –C![[double bond, length as m-dash]](https://www.rsc.org/images/entities/char_e001.gif) O amide I vibrations at 1642 cm−1 plotted as a function of temperature. The intensity of this band decreases gradually with the increasing temperature, with the middle point of the transition at 30 °C, which corresponds to the TSR transition minimum detected in the DSC measurements. This remarkable agreement indicates that at TSR, there are composition-dependent molecular rearrangements within the side chains or backbone segments, resulting from the inter- and intra-molecular interactions, causing dipole moment changes reflected in IR band intensity alternations. For example, for amide linkages at 1642 cm−1, there are no new bands detected as a function of temperature, but the intensity of this band decreases, suggesting that H-bonding does not occur,13,19 but dipole moment interactions of –C
O amide I vibrations at 1642 cm−1 plotted as a function of temperature. The intensity of this band decreases gradually with the increasing temperature, with the middle point of the transition at 30 °C, which corresponds to the TSR transition minimum detected in the DSC measurements. This remarkable agreement indicates that at TSR, there are composition-dependent molecular rearrangements within the side chains or backbone segments, resulting from the inter- and intra-molecular interactions, causing dipole moment changes reflected in IR band intensity alternations. For example, for amide linkages at 1642 cm−1, there are no new bands detected as a function of temperature, but the intensity of this band decreases, suggesting that H-bonding does not occur,13,19 but dipole moment interactions of –C![[double bond, length as m-dash]](https://www.rsc.org/images/entities/char_e001.gif) O amide in AcrNPP and –C–O–C ether in EEMA groups lead to the simultaneous decrease of the bands at 1642 and 1120 cm−1. As will be seen later for the protonated state, H-bonding interactions will dominate the TSR transitions.
O amide in AcrNPP and –C–O–C ether in EEMA groups lead to the simultaneous decrease of the bands at 1642 and 1120 cm−1. As will be seen later for the protonated state, H-bonding interactions will dominate the TSR transitions.
To illustrate the reversibility of the TSR transitions, Fig. 2A shows DSC heating–cooling–heating cycles of p(AcrNPP/EEMA) coalesced films under alkaline conditions. As observed, upon the first heating cycle, endothermic Tg and TSR transitions are detected at 17 (midpoint) and 30 °C, respectively. The same transitions are detected at exactly the same positions during the second heating cycle, but upon cooling, only Tg is detected. This is attributed to the slower chain mobilities and longer relaxation times required for chain expansions to occur upon cooling. The same phenomenon was observed for other stimuli-responsive copolymer films.10,11
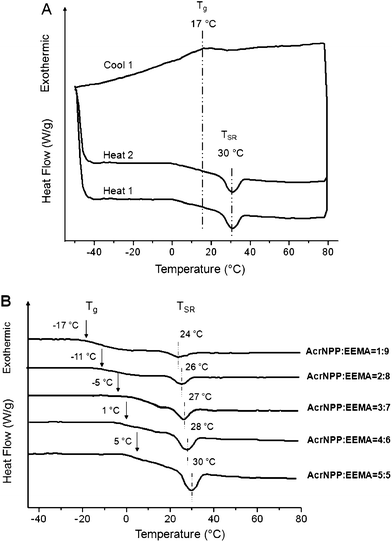 | ||
Fig. 2 (A) Multiple DSC cycles conducted on p(AcrNPP/EEMA) (weight ratio = 1![[thin space (1/6-em)]](https://www.rsc.org/images/entities/char_2009.gif) : :![[thin space (1/6-em)]](https://www.rsc.org/images/entities/char_2009.gif) 1); (B) series DSC thermograms of p(AcrNPP/EEMA) copolymer films recorded for different weight ratios. 1); (B) series DSC thermograms of p(AcrNPP/EEMA) copolymer films recorded for different weight ratios. | ||
In order to determine how AcrNPP/EEMA copolymer ratio affects the TSR transitions in the coalesced films, DSC thermograms were recorded as a function of the copolymer composition. The results are illustrated in Fig. 2B. As seen, the Tg and TSR transitions shift to higher temperatures as the ratio of the stimuli-responsive AcrNPP component increases, reflected by the increased transition energy represented by the area. Previous studies10,11 have also shown that the TSR and the weight fraction of stimuli-responsive random copolymers follow eqn (1):
 | (1) |
First, let us examine the validity of this relationship for p(AcrNPP/EEMA) copolymers films by comparing the DSC experimental data with the calculated TSR values obtained from eqn (1). As shown in Fig. 3A, solid cubic (■) points represent the DSC experimental data, whereas lines a–k represent the values predicted from eqn (1) for different film formation temperatures (T). All lines converge at the same point, when w2 = 0, at which 1/TSR = 1/Tbinary and TSR = 310 K, and the line f that corresponds to T = 296 K exhibits the best fit, which is in agreement with the DSC data (±0.15), thus validating eqn (1).
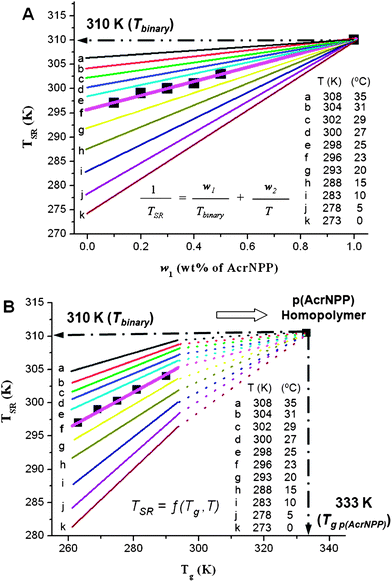 | ||
| Fig. 3 Experimental (DSC) and predicted TSR using eqn (1) (A) and eqn (2) (B) for different film formation temperature (T) values plotted as a function of weight fraction (w1). | ||
By substituting the Fox equation for two copolymers (1/Tg = 1/Tg1 + 1/Tg2) the relationship between TSR and Tg transitions is obtained:
 | (2) |
While the above discussion addressed the influence of temperature on TSR transitions, the presence of amine functionality in AcrNPP also provides pH responsiveness. Fig. 4 illustrates a series DSC thermograms of p(AcrNPP/EEMA) films coalesced from basic (pH = 8–12) (Trace A), neutral (pH = 6–7) (Trace B), and acidic (pH = 2–6) (Trace C) dispersions. Analysis of Traces A, B and C shows that the Tg transition slightly shifts which, as will be seen in the spectroscopic analysis, is attributed to the formation of H-bonding between protonated amine and ester/amide linkages upon protonation. More pronounced changes are detected for the TSR transitions, where the endotherm levels off at 30 °C during protonation, and the transition minimum shifts from 30 °C for pH = 8–12 to 32 °C (pH = 6–7) and to 35 °C for pH = 2–6. If a collapse of unprotonated stimuli-responsive components10,20,21 is responsible for the TSR transition (30 °C) at pH = 8–12, two endotherms detected at 30 and 32 °C for a partially protonated state with pH = 6–7 correspond to the collapse of unprotonated and protonated portions of the chain, respectively. For the fully protonated state (pH = 2–6), the copolymer backbone may begin buckling at 30 °C, as manifested by the shoulder in Trace C, or collapse of the fully protonated responsive components at 35 °C. It is also noted that the amount of transition energy increases from 93 kcal mol−1 at pH = 8–12 to 100 and 112 kcal mol−1 at pH = 6–7 and 2–6, respectively, indicating that the enthalpic component of the TSR transition increases when undergoing from unprotonated to protonated states.
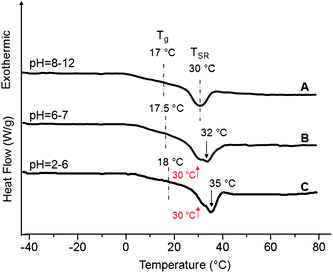 | ||
Fig. 4
DSC thermograms of p(AcrNPP/EEMA) copolymer films (weight ratio = 1![[thin space (1/6-em)]](https://www.rsc.org/images/entities/char_2009.gif) : :![[thin space (1/6-em)]](https://www.rsc.org/images/entities/char_2009.gif) 1) recorded as a function of pH; Trace A—pH = 8–12; B—pH = 6–7; C—pH = 2–6. 1) recorded as a function of pH; Trace A—pH = 8–12; B—pH = 6–7; C—pH = 2–6. | ||
In an effort to determine which molecular entities and interactions are primarily responsible for thermal responses at different pH conditions ATR FT-IR analysis was utilized. Fig. 5A illustrates ATR FT-IR spectra of p(AcrNPP/EEMA) copolymer films as a function of pH at 22 °C, where Traces A, B, and C correspond to basic (pH = 8–12), neutral (pH = 6–7), and acidic (pH = 2–6) conditions, respectively. As seen, the bands at 2596, 2525, and 2456 (NH+ str) cm−1 due to the quaternary amine salts are detected under neutral and acidic conditions, confirming that partially or fully protonated reactions generate positively charged quaternary amine groups. Moreover, the bands at 2961 (CH3 asym str), 2931 (CH2 asym str), 2820–2760 (>N–CH2), and 998 cm−1 (ring asym str) cm−1 due to propylpiperazine functional groups of the AcrNPP units decrease as pH changes. These observations indicate that molecular vibrations associated with propylpiperazine groups become symmetric as the tertiary amine groups undergo transitions from none to fully protonated states, which is attributed to the change of the overall polarity of the side groups as the lone pair of electrons is replaced by H.
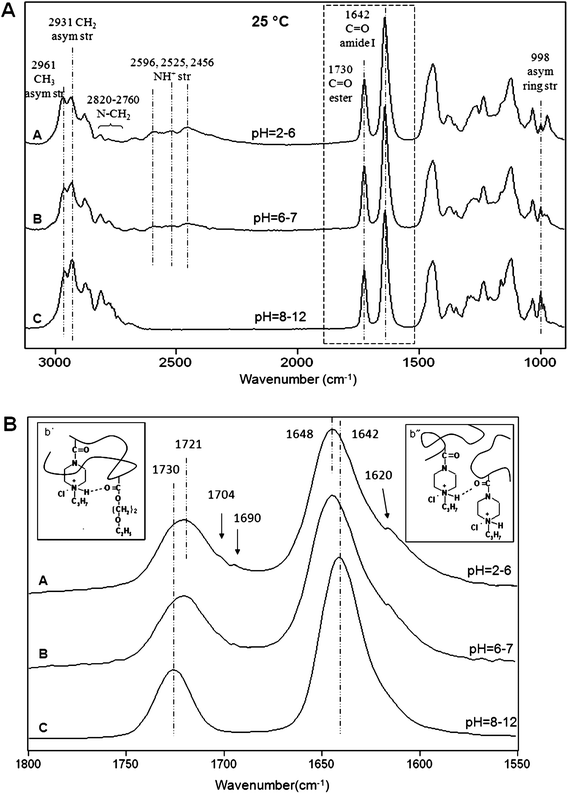 | ||
Fig. 5
ATR FT-IR spectra of p(AcrNPP/EEMA) copolymer films (weight ratio = 1![[thin space (1/6-em)]](https://www.rsc.org/images/entities/char_2009.gif) : :![[thin space (1/6-em)]](https://www.rsc.org/images/entities/char_2009.gif) 1): (A) 950–3120 cm−1 and (B) 1550–1800 cm−1 regions recorded as a function of pH at 22 °C; Trace A—pH = 2–6; B—pH = 6–7; C—pH = 8–12. 1): (A) 950–3120 cm−1 and (B) 1550–1800 cm−1 regions recorded as a function of pH at 22 °C; Trace A—pH = 2–6; B—pH = 6–7; C—pH = 8–12. | ||
Fig. 5B illustrates ATR FT-IR spectra in the 1550–1800 cm−1 region. As seen, the bands at 1730 and 1642 cm−1 due to C![[double bond, length as m-dash]](https://www.rsc.org/images/entities/char_e001.gif) O ester and amide I linkages decrease as pH changes from basic to acidic. At the same time, selected bands shift from 1730 to 1721 and from 1642 to 1648 cm−1, respectively, which reflect molecular rearrangements of ester and amide linkages upon protonation. Furthermore, as indicated above, the H-bonding manifested by the intensity increase of the bands at 1704 (associated C
O ester and amide I linkages decrease as pH changes from basic to acidic. At the same time, selected bands shift from 1730 to 1721 and from 1642 to 1648 cm−1, respectively, which reflect molecular rearrangements of ester and amide linkages upon protonation. Furthermore, as indicated above, the H-bonding manifested by the intensity increase of the bands at 1704 (associated C![[double bond, length as m-dash]](https://www.rsc.org/images/entities/char_e001.gif) O)22 and 1690 cm−1 (intra H-bond)22 of esters as well as the 1620 cm−1 band (inter H-bond)23,24 of amide I linkages are observed, indicating the formation of intra- and inter-molecular H-bonding between protonated amine and ester/amide groups. The corresponding structural features responsible for spectroscopic changes are illustrated in the insets b′ (intra-molecular H-bonding) and b″ (inter-molecular H-bonding) of Fig. 5B. Compared to the unprotonated state, rearrangements and collapse of protonated AcrNPP component at the TSR will disrupt H-bonding interactions due to the formation of H-bonding under acidic conditions. Consequently, a larger amount of thermal energy or elevated temperatures are required, which is precisely what the DSC measurements showed. As we recall, the TSR transition energy at pH = 2–6 increases to 112 kcal mol−1, and the transition minimum shifts to 35 °C.
O)22 and 1690 cm−1 (intra H-bond)22 of esters as well as the 1620 cm−1 band (inter H-bond)23,24 of amide I linkages are observed, indicating the formation of intra- and inter-molecular H-bonding between protonated amine and ester/amide groups. The corresponding structural features responsible for spectroscopic changes are illustrated in the insets b′ (intra-molecular H-bonding) and b″ (inter-molecular H-bonding) of Fig. 5B. Compared to the unprotonated state, rearrangements and collapse of protonated AcrNPP component at the TSR will disrupt H-bonding interactions due to the formation of H-bonding under acidic conditions. Consequently, a larger amount of thermal energy or elevated temperatures are required, which is precisely what the DSC measurements showed. As we recall, the TSR transition energy at pH = 2–6 increases to 112 kcal mol−1, and the transition minimum shifts to 35 °C.
To correlate molecular changes observed in spectroscopic measurements with energetic requirements, computer modeling experiments using molecular thermodynamics simulations were employed. To simulate the network, infinitely long polymer chains were created by packing energy minimized AcrNPP/EEMA units (50![[thin space (1/6-em)]](https://www.rsc.org/images/entities/char_2009.gif) :
:![[thin space (1/6-em)]](https://www.rsc.org/images/entities/char_2009.gif) 50 ratio) under 3D periodic boundary conditions. While details of the computational analysis were provided in the Experimental section, visualization of the results is depicted in Fig. 6. The calculated ΔEtot of the TSR transition for the unprotonated state is 132 kcal mol−1, which is smaller than the ΔEtot (169 kcal mol−1) for the protonated system. The energies required for the TSR transitions obtained from the DSC analysis also increase from 93 (unprotonated) to 112 kcal mol−1 (protonated). Thus, experimental and theoretical results for the protonated states are in agreement, indicating that a higher amount of energy is required for the TSR transitions, and the difference between the theoretical and experimental ΔEtot values is attributed to the inclusion of entropic components in the ΔEtot calculations.
50 ratio) under 3D periodic boundary conditions. While details of the computational analysis were provided in the Experimental section, visualization of the results is depicted in Fig. 6. The calculated ΔEtot of the TSR transition for the unprotonated state is 132 kcal mol−1, which is smaller than the ΔEtot (169 kcal mol−1) for the protonated system. The energies required for the TSR transitions obtained from the DSC analysis also increase from 93 (unprotonated) to 112 kcal mol−1 (protonated). Thus, experimental and theoretical results for the protonated states are in agreement, indicating that a higher amount of energy is required for the TSR transitions, and the difference between the theoretical and experimental ΔEtot values is attributed to the inclusion of entropic components in the ΔEtot calculations.
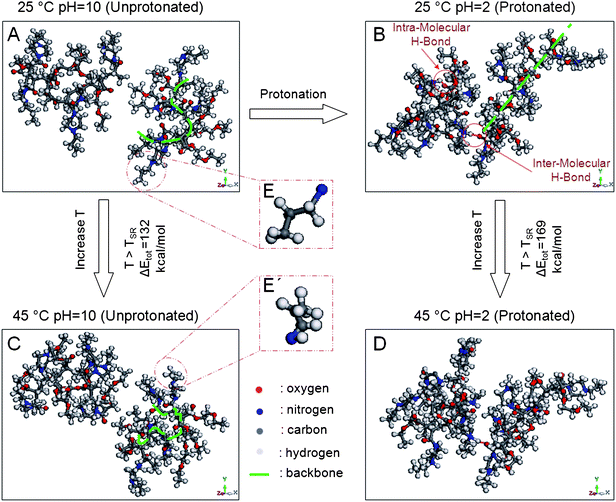 | ||
| Fig. 6 Computer simulation results representing molecular conformational and interaction changes as a function of temperature and protonation state: (A) 25 °C, pH = 10 (unprotonated state); (B) 25 °C, pH = 2 (protonated state); (C) 45 °C, pH = 10 (unprotonated state); (D) 45 °C, pH = 2 (protonated state); (E) extended and (E′) collapsed states of N′-propyl groups. | ||
In order to examine combined effects of protonation and temperature on molecular conformations, Fig. 6 illustrates two neighboring chains of the corresponding unit cells that were equilibrated at 25 (Fig. 6A and B) and 45 °C (Fig. 6C and D) under unprotonated (Fig. 6A and C) and protonated conditions (Fig. 6B and D). These simulations show that the unprotonated state of the copolymer backbone (Fig. 6A and C) becomes extended upon protonation (Fig. 6B and D) and the side groups repelling each other. This is attributed to the protonation of the amine functionality forcing the backbone to expand, thus minimizing the repulsion around the positively charged center.17,25 For the protonated states, the formation of intra- and inter-molecular H-bonding between the protonated amine and ester/amide groups is also observed and when temperature increases from 25 (Fig. 6B) to 45 °C (Fig. 6C), the copolymer backbone becomes twisted and buckles inwards. At the same time, N′-propyl groups collapse and form bulky spheres. Magnified insets E and E′ of Fig. 6 illustrate these changes. Similar phenomenon is observed for protonated chains equilibrated at 45 °C (Fig. 6D). These theoretical results are in agreement with the experimental data and indicate that the collapse of propylpiperazine functionalities and buckling of the copolymer backbone are the main contributors to the TSR transitions, whereas the shift of the TSR for unprotonated and protonated states is attributed to the synergistic effects of pH and temperature, thus inducing H-bonding and conformation changes.
Conclusions
New p(AcrNPP/EEMA) colloidal dispersions were prepared which upon coalescence form solid films that exhibit temperature and pH responsiveness. Thermal relaxations of p(AcrNPP/EEMA) copolymers exhibit composition-dependent endothermic transitions: Tg and TSR. The TSR follows the relationship: 1/TSR = w1/Tbinary + w2/T, which is a function of the copolymerTg as well as coalescence conditions T (TSR = f(Tg, T)). The relationship between the Tg and TSR relaxations for copolymers can be predicted by the following formula: 1/TSR = [Tg1 × Tg2 × (Tbinary − T)]/[Tbinary × T × (Tg1 − Tg2) × Tg] + (Tg1 × T − Tbinary × Tg2)/[Tbinary × T × (Tg1 − Tg2)].Spectroscopic analysis showed that for the unprotonated state, interactions of dipoles from neighboring bonds of the stimuli-responsive entities change at TSR. In the protonated state, the formation of inter/intra-molecular H-bonding between protonated amide and C![[double bond, length as m-dash]](https://www.rsc.org/images/entities/char_e001.gif) O ester/amide groups is responsible for the shift of TSR as well as the increase of enthalpy at the TSR. The synergistic pH and temperature effects result in the copolymer backbone buckling and the collapse of stimuli-responsive AcrNPP units.
O ester/amide groups is responsible for the shift of TSR as well as the increase of enthalpy at the TSR. The synergistic pH and temperature effects result in the copolymer backbone buckling and the collapse of stimuli-responsive AcrNPP units.
Acknowledgements
This work was primarily supported by the MRSEC Program of the National Science Foundation under Award no. DMR 0213883 and partially by Award no. DMR 0215873 Major Research Instrumentation (MRI) Program.References
- M. A. C. Stuart, W. T. S. Huck, J. Genzer, M. Müller, C. Ober, M. Stamm, G. B. Sukhorukov, I. Szleifer, V. V. Tsukruk, M. W. Urban, F. Winnik, S. Zauscher, I. Luzinov and S. Minko, Nat. Mater., 2010, 9, 101 CrossRef.
- M. W. Urban, Prog. Polym. Sci., 2009, 34, 679 CrossRef CAS.
- C. D. Jones and L. A. Lyon, Macromolecules, 2000, 33, 8301 CrossRef CAS.
- J. Gohy, B. Lohmeijer, S. Varshney, B. Decamps, E. Leroy, S. Boileau and U. Schubert, Macromolecules, 2002, 35, 9748 CrossRef CAS.
- X. Li, J. Zuo, Y. Guo and X. Yuan, Macromolecules, 2004, 37, 10042 CrossRef CAS.
- K. Kratz, T. Hellweg and W. Eimer, Colloids Surf., A, 2000, 170, 137 CrossRef CAS.
- V. T. Pinkrah, M. J. Snowden, J. C. Mitchell, J. Seidel, B. Z. Chowdhry and G. R. Fern, Langmuir, 2003, 19, 585 CrossRef CAS.
- W. Zhang, L. Shi, R. Ma, Y. An, Y. Xu and K. Wu, Macromolecules, 2005, 38, 8850 CrossRef CAS.
- N. Chourdakis, G. Bokias and G. Staikos, J. Appl. Polym. Sci., 2004, 92, 3466 CrossRef CAS.
- F. Liu and M. W. Urban, Macromolecules, 2009, 42, 2161 CrossRef CAS.
- F. Liu and M. W. Urban, Macromolecules, 2010, 43, 5330–5337 CrossRef CAS.
- D. Lestage and M. W. Urban, Langmuir, 2005, 21, 2150 CrossRef CAS.
- M. W. Urban, Attenuated Total Reflectance Spectroscopy of Polymers, Theory and Practice, Washington, DC, 1989 Search PubMed.
- C. S. Sanmathi, S. Prasannakumar and S. Sherigara, Bull. Mater. Sci., 2004, 27, 243 Search PubMed.
- D. Lin-Vien, N. B. Colthup, W. G. Fateley and J. G. Grasselli, The Handbook of Infrared and Raman Characteristic Frequencies of Organic Molecules, Academic Press, San Diego, 1991 Search PubMed.
- E. Pretsch, P. Buhlmann and C. Affolter, Structure Determination of Organic Compound: Tables of Spectral Data, Springer, New York, 3rd edn, 2000 Search PubMed.
- L. H. Gan, Y. Y. Gan and R. Deen, Macromolecules, 2000, 33, 7893 CrossRef CAS.
- L. Chang, X. Kong, F. Wang, L. Wang and J. Shen, Thin Solid Films, 2008, 516, 2125 CrossRef CAS.
- G. Socrates, Infrared and Raman Characteristic Group Frequencies, Tables and Charts, John Wiley and Sons Ltd., New York, 3rd edn, 2001 Search PubMed.
- F. Liu and M. W. Urban, Macromolecules, 2008, 41, 352 CrossRef CAS.
- F. Liu and M. W. Urban, Macromolecules, 2008, 41, 6531 CrossRef CAS.
- A. S. Hadj-Hamou and S. Djadoun, J. Appl. Polym. Sci., 2007, 103, 1011 CrossRef CAS.
- A. Percot, X. X. Zhu and M. Lafleur, J. Polym. Sci., Part B: Polym. Phys., 2000, 38, 907 CrossRef CAS.
- Y. Maeda, T. Higuchi and I. Ikeda, Langmuir, 2001, 17, 7535 CrossRef CAS.
- G. R. Deen and L. H. Gan, J. Dispersion Sci. Technol., 2008, 29, 431 CrossRef CAS.
Footnote |
| † Electronic supplementary information (ESI) available. See DOI: 10.1039/c0py00366b |
| This journal is © The Royal Society of Chemistry 2011 |
