Chemical modification of pectin: environmental friendly process for new potential material development
Luca
Monfregola
a,
Marilisa
Leone
a,
Vittoria
Vittoria
b,
Pietro
Amodeo
c and
Stefania
De Luca
*a
aInstitute of Biostructures and Bioimages, National Research Council, 80138, Naples, Italy. E-mail: stefania.deluca@cnr.it; Fax: +39 0812536642; Tel: +39 0812536643
bDepartment of Chemical and Food Engineering, University of Salerno, 84084, Fisciano (SA), Italy
cInstitute of Biomolecular Chemistry, National Research Council, 80078, Pozzuoli (NA), Italy
First published on 14th February 2011
Abstract
Chemical modification of pectin was successfully accomplished as a solvent free process. It involved acylation of alcoholic functions of the polysaccharide by using several fatty acid anhydrides. The reaction was performed by simply mixing the reagents with a catalytic amount of the inorganic base potassium carbonate and heating the obtained mixture at a temperature of 160 °C. The desired esters were fully characterized by NMR and FT-IR spectroscopy.
Naturally occurring polymers, derived from renewable resources, are strongly recommended to be used for the development of novel materials, that may result useful in various applications.1–3
On the other hand, one of the major problems related to the preparation of new materials, by chemical modification, concerns the amount of solvent needed, particularly when the time for the scale up of its production comes. In general, industrial chemical processes are designed by taking into account the recovery, reuse and recycling of the solvent. However, the energy required for recovering and recycling the solvent must be also accounted for, and it has been estimated that the consume of this energy is about 50% of the total one used in chemical processes.4
Since the beginning of the “green chemistry” movement, one of the major faced issue has been the need for alternatives to volatile organic solvents widely employed in chemical reactions. However, the ideal approach would be carrying out reactions in the absence of solvents, thus gaining great advantages such as low environmental impact, low costs, reduced energy, low toxicity and hazard in handling.5
Among the naturally occurring polymers, pectins are important polysaccharides widely available because they are extracted from cell walls of most plants. Apple pomace and orange peel represent the two major sources of commercial pectin. They have applications in food, pharmaceutical and medical industries, in drug delivery, as paper substitute, foams and plasticizers, etc.6 From a structural point of view, pectins are anionic polysaccharides consisting primarily of 1,4-α-D-galacturonosyl units and their methyl esters, interrupted in places by 1,2-α-L-rhamnopyranosyl units.7
In literature, several solvent free processes, implemented to esterify fatty acids with different polysaccharides, like cellulose8 and starch,9 have been described.
Recently, it has also been reported a solvent free method to acylate cellulose.10 Herein we describe a solvent-free synthetic strategy to chemically modify pectin from apple. Our goal has been to generate, through an environmentally friendly process, pectin-derived materials, in order to investigate their potential new properties. In particular, we decided to perform acylation of the pectin alcoholic functions by using several fatty acid anhydrides. Indeed, water absorption and diffusion strongly depend on the morphology and microstructure of the multi-phase systems we should obtain by modifying the pectin, and therefore these factors are expected to play a very important role in determining the tunable water transport phenomena. In our systems a hydrophilic part (the pectin backbone) is linked to hydrophobic moieties (the fatty acid chains), determining a water transport phenomenon which is strongly dependent on both the two different phases concentration and distribution.
Oleic acid, linoleic acid and hydroxyl-oleic acid were used to functionalize the polysaccharide pectin. In our protocols, all the employed starting materials are provided by natural resources, being the above mentioned fatty acids components of the naturally occurring oils.
The hydration of the oleic acid necessary to generate the pectin hydroxyl-oleate derivative was carried out by treating it with concentrate sulfuric acid, followed by water addition.11
All esterification reactions were carried out by mechanical milling of the polysaccharide with the appropriate fatty acid anhydrides in the presence of a catalytic amount of base K2CO3 (Scheme 1). The obtained mixture was heated at the temperature of 160 °C for 10–15 min (sample 2a–c), and then, after cooling, washed with chloroform in order to remove all organic by-products. The obtained solid was titrated with 0.5 N HCl until a neutral pH was reached and the resultant salt KCl was removed by dialysis in Milli-Q water.9 After lyophilization, the final products were fully characterized by NMR and FT-IR spectroscopy, and their yields were found in the range 75–90%.11
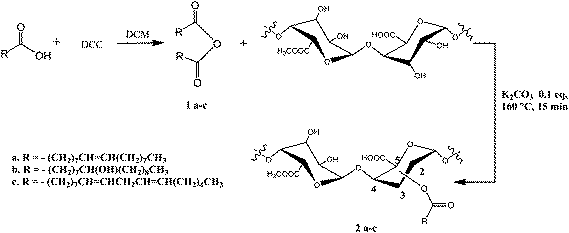 | ||
| Scheme 1 Synthetic strategy of pectin functionalization. | ||
First, mono-dimensional proton spectra of pectin and its derivatives dissolved in 99.8% D2O were recorded at 400 MHz and 25 °C. The quality of NMR spectra is rather good under these experimental conditions, although some broadening of the resonances, due to the fast relaxation of pectin and/or aggregation processes induced by the fatty acid chains in water, is evident. Comparison of NMR spectra of pectin and its analogues (Fig. 1) clearly demonstrates pectin chemical modification. In fact, NMR spectra of functionalized pectin samples are characterized by broad signals belonging to the fatty acid chain (i.e.: CH2 and CH3 groups) in the region between 0 and 2.5 ppm (Fig. 1). Additional signals from the fatty acid chains could not be unambiguously assigned due to overlaps with resonances from pectin protons.12
Next, we performed bi-dimensional Nuclear Overhauser Effect (NOE)-based experiments. As an example in Fig. 2, the 2D [1H, 1H] NOESY spectrum of the oleic acid in water (99.8% D2O) has been compared with that of pectin-oleate under the same experimental conditions. The different conformational properties and improved solubility of the fatty acid chain when bound to the pectin give rise to strong negative NOEs.12,13 For the pectin-oleate we also recorded a 2D [1H, 13C] heteronuclear multiple bond correlation (HMBC) experiment (data not shown), from which many cross-peaks belonging to the acyl chain could be easily identified.14
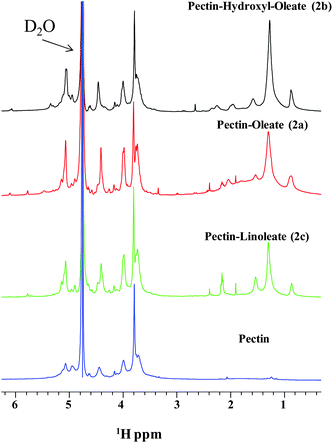 | ||
| Fig. 1 1D proton NMR spectra of pectin and its derivatives. | ||
![Comparison of 2D [1H, 1H] NOESY spectra (mixing time 200 ms) of oleic acid (a) and pectin-oleate (b).](/image/article/2011/PY/c0py00341g/c0py00341g-f2.gif) | ||
| Fig. 2 Comparison of 2D [1H, 1H] NOESY spectra (mixing time 200 ms) of oleic acid (a) and pectin-oleate (b). | ||
Generally, the degree of substitution for polysaccharides is expressed as moles of substituents per one mole of the corresponding monomer. In our case the degree of substitution (DS) was determined by 1H-NMR spectroscopy by comparing the amount of fatty acid linked to pectin with respect to the total amount of pectin proton H-3 (Fig. 3). In major details, we analyzed the ratio between the areas under the NMR peaks (NMR integrals) belonging to the methyl group of the bound fatty acid chain (ICH3) and to the pectin proton 3 (IH-3):
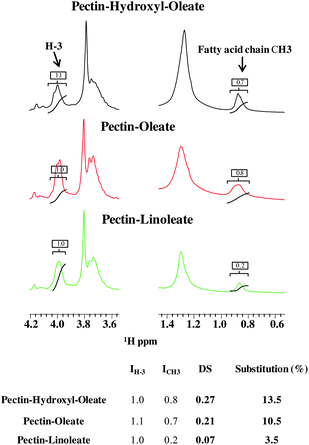 | ||
| Fig. 3 (Upper panel) Expansion of the two regions of the 1D 1H spectrum of pectin-derivatives showing the peak integrals used for DS estimation. (Lower panel) Table containing the DS values, the percentage of substitution and the peak integrals. | ||
Inspection of 1H-NMR spectra, as well as FT-IR spectra (see the discussion below), indicates a certain decrease of the degree of methylation (DM) in the new compounds with respect to the non-functionalized pectin (2a–c). In particular, we could quantify the DM again by 1H-NMR spectroscopy, using a procedure similar to the one proposed to evaluate the DS. We analyzed the ratio between the areas under the NMR peaks (Fig. 4) belonging to the pectinmethyl-ester group (ICOOCH3) and the total amount of proton H-3 (IH-3). Due to spectral overlaps, it was not possible to precisely estimate the value of ICOOCH3, but only the sum ICOOCH3 + IH-2 (IH-2 indicates the integral of the NMR signal corresponding to the total amount of sugar proton H-2):
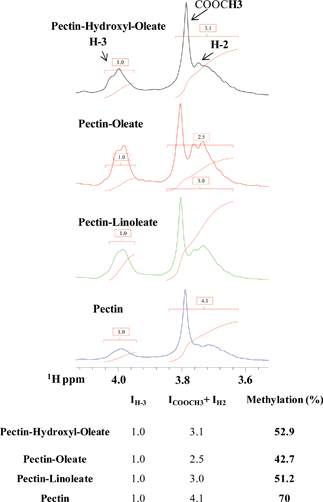 | ||
| Fig. 4 (Upper panel) Expansion of a region of the 1D 1H spectrum of pectin and its derivatives showing the peak integrals used for DM estimation. (Lower panel) Table containing peak integrals and the extent of methylation expressed as percentage. | ||
Pectin derivatives functionalized with the different fatty acid moieties were further characterized by means of FT-IR spectroscopy.15
A general view of the FT-IR spectra of pectin-oleate, pectin hydroxyl-oleate and pectin-linoleate is shown in Fig. 5. For comparison purpose a spectrum of the native pectin is also included.16
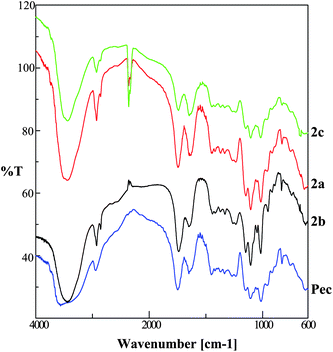 | ||
| Fig. 5 Transmittance FT-IR spectra pectin-linoleate (2c), pectin-oleate (2a), pectin-hydroxyl-oleate (2b) and pectin. | ||
The obtained spectral data were analyzed by comparing the following characteristic regions: O–H stretching (3100–3600 cm−1), C–H stretching (2800–3000 cm−1), carboxylic groups region stretching (1200–1800 cm−1)17–19 and the “fingerprint” region (under 2000 cm−1) which reflect monosaccharides composition of the analyzed pectin.20
Pectin
FT-IR spectrum shows a broad O–H stretching band at 3562 cm−1; a small intensity C–H band at 2945 cm−1; three peaks at 1747, 1649, and 1452 cm−1 in the carboxylic groups region assigned to the C![[double bond, length as m-dash]](https://www.rsc.org/images/entities/char_e001.gif) O stretching of methylated carboxyl groups, to anti-symmetric and symmetric stretching modes of COO−, respectively.16 The five bands at 1149, 1106, 1043, 1013 and 954 cm−1 correspond to skeletal C–O and C–C vibration bands of glycosidic bonds and pyranoid ring.21
O stretching of methylated carboxyl groups, to anti-symmetric and symmetric stretching modes of COO−, respectively.16 The five bands at 1149, 1106, 1043, 1013 and 954 cm−1 correspond to skeletal C–O and C–C vibration bands of glycosidic bonds and pyranoid ring.21
A careful analysis of the FT-IR spectra (Fig. 5) for each new compound reveals main changes in those regions particularly related to the structure and composition of the inserted modifications. In major details, a decrease of the O–H stretching band (in the range of 3500–3200 cm−1) accounts for the decrease of the hydroxyl pectin groups upon reaction with the fatty acid anhydrides. On the other hand, an increase in the C–H stretching region (2940–2960 cm−1) and the appearance of a new band (2857 cm−1 for pectin-oleate; 2855 cm−1 for pectin hydroxyl-oleate and for pectin-linoleate) was also observed. Indeed, the C–H stretching band intensity increases with the DS values, calculated for each of the synthesized pectin derivative. The region featuring the state of carboxylic groups (1750–1350 cm−1) is the most interesting. Indeed, the relative intensities of the C![[double bond, length as m-dash]](https://www.rsc.org/images/entities/char_e001.gif) O esterified band (1750 cm−1) and of COO− symmetric and anti-symmetric stretching bands (1600–1650 cm−1 and 1400–1450 cm−1)16 may be correlated to the degree of methylation (DM) and to the degree of substitution (DS) of each new compound (see Fig. 3 and 4).
O esterified band (1750 cm−1) and of COO− symmetric and anti-symmetric stretching bands (1600–1650 cm−1 and 1400–1450 cm−1)16 may be correlated to the degree of methylation (DM) and to the degree of substitution (DS) of each new compound (see Fig. 3 and 4).
In particular, if we compare the pectinhydroxyl-oleate spectrum with that of pectin, we can find similar intensities for the band at 1741 cm−1, this is in agreement with the estimated low degree of methyl hydrolyses and the calculated degree of substitution. Whereas, for pectin-oleate and pectin-linoleate spectra, despite we observe a degree of substitution equal to 0.21 and 0.07, respectively, both compounds are characterized by reduction of the band intensity at 1740 cm−1, this observation is in agreement with the calculated higher degree of demethylation.
Other changes are registered in the “fingerprint region”, the band in the range between 1103 and 1105 cm−1 increases while the band between 1012 and 1015 cm−1 decreases with the degree of substitution.16
In conclusion, new pectin-derived compounds have been synthesized by an experimental procedure under solvent free conditions. The performed chemical modification can be considered efficient, fast, economical and eco-friendly. The whole synthetic process uses naturally occurring starting materials and does not produce dangerous waste nor by-products. Our goal has been to develop a green procedure to functionalize pectin, by using renewable resources and thus presenting a low environmental impact. In future, we plan to synthesize, for each obtained pectin derivative, compounds characterized by different DS. Afterwards, the structural and physical properties of the new materials will be also explored, in order to evaluate the influence of the length and type of fatty acid chains on such properties as well as the extent of modification needed to modulate the pectin properties.
Acknowledgements
We are grateful to the student Enrica Calce for collaboration. We also thank Leopoldo Zona and Vincenzo Mirra for technical assistance with NMR experiments, Giosuè Sorrentino and Donato Ciccarelli for technical assistance with FT-IR experiments. A special thank to Luca De Luca for technical assistance with the figures composition.Notes and references
- H. Sashiwa, H. Yajima and S. Aiba, Biomacromolecules, 2003, 4, 1244–1249 CrossRef CAS.
- L. Junistia, A. K. Sugih, R. Manurung, F. Picchioni, L. P. B. M. Janssen and H. Heeres, Starch, 2008, 60, 667–675 Search PubMed.
- M. R. Guilherme, T. A. Moia, A. V. Reis, A. T. Paulino, A. F. Rubira, L. H. C. Mattoso, E. C. Muniz and E. B. Tambourgi, Biomacromolecules, 2009, 10, 190–196 CrossRef CAS.
- J. H. Clark and S. J. Tavner, Org. Process Res. Dev., 2007, 11, 149–155 Search PubMed.
- K. Tanaka and F. Toda, Chem. Rev., 2000, 100, 1025–1074 CrossRef CAS.
- (a) Biopolymers From Renewable Resources, ed. D. L. Kaplan, Springer-Verlag, Berlin, Heidelberg, 1998b Search PubMed; (b) B. R. Thakur, R. K. Singh, A. K. Handa and M. A. Rao, Crit. Rev. Food Sci. Nutr., 1997, 1, 47–73 CrossRef.
- (a) J. R. Mitchel, S. E. Hill and D. A. Ledward, Functional Properties of Food Macromolecules, Aspen Publication, 2nd edn, 1998 Search PubMed; (b) H. Zaleska, S. G. Ring and P. Tomasik, Food Hydrocolloids, 2000, 14, 377–382 CrossRef CAS.
- (a) S. Thiebaud and M. E. Borredon, Bioresour. Technol., 1995, 52, 169–173 CrossRef CAS; (b) C. Vaca-Garcia and M. E. Borredon, Bioresour. Technol., 1999, 70, 135–142 CrossRef CAS.
- (a) J. Aburto, H. Hamaili, G. Mouysset-Baziard, F. Senocq, I. Alric and E. Borredon, Starch, 1999, 51, 302–307 Search PubMed; (b) J. Aburto, I. Alric and E. Borredon, Starch, 2005, 57, 145–152 Search PubMed.
- A. Biswas, R. L. Shogren and J. L. Willet, Biomacromolecules, 2005, 6, 1843–1845 CrossRef CAS.
- Materials and general synthetic procedures: the apple peel pectin was purchased from Fluka. It is a powder sample with high molar mass (30,000–100,000) and a high degree of esterification (70–75%) on a dry basis. The fatty acids and all solvents were purchased from Sigma-Aldrich. Synthesis of fatty acid anhydrides (1a–c): the fatty acid (10 mmol) was dissolved in dichloromethane (2 mL), then the solution was cooled in an ice-water bath and stirred vigorously with a magnetic stirrer under argon atmosphere. The dicyclohexylcarbodiimide (5 mmol), previously dissolved in the minimum volume of dichloromethane, was added and stirring was continued at ice bath temperature for 2 h. The white solid N,N′-dicyclohexylurea was removed by filtration and the solvent was evaporated in vacuo to give the final anhydride. Synthesis of 10-hydroxyoctadecanoic acid (hydroxyl-oleic acid): 0.78 mmol of oleic acid were dissolved in 75% aqueous solution of H2SO4. The mixture was stirred and cooled in an ice-water bath for 20 min. Then, equal volumes (10 mL) of water and ethyl acetate were added and, after several extractions with fresh water in order to separate the acid, the organic layer was concentrated to dryness to obtain the desired product. Synthesis of fatty acid esters (2a–c): the typical esterification procedure is as follows. 30 mg of pectin were mechanical milled with 20 mg of fatty acid anhydride in the presence of K2CO3 (0.1 eq.) by using an agate mortar. The obtained reaction mixture was heated in an oil bath at 160 °C for 15–25 min. After cooling at room temperature, the final crude product was washed with chloroform. The obtained solid was dissolved in water and 0.5 N HCl was dropped into the final solution until a neutral pH was reached. This solution was then dialyzed for 1 day in Milli-Q water and finally lyophilized to give the desired products (yields: 2a = 80%; 2b = 90%; 2c = 75%).
-
NMR
characterization: NMR spectra were recorded on a Varian Unity Inova 400 MHz NMR spectrometer equipped with z-axis pulsed-field gradients and a triple resonance probe. NMR samples consisted of pectin or pectin-derivatives dissolved in 99.8% D2O (Armar Chemicals, Switzerland). NMR experiments were acquired at 25 °C. 1D proton spectra were recorded with 256 scans and a relaxation delay of 2 s. 2D [1H, 1H] NOESY experiments (2048 × 256 total data points and 64 or 128 scans pet t1 increment) were recorded with a mixing time of 200 ms. The 2D [1H, 13C] HMBC spectrum was acquired on a Bruker Avance 600 spectrometer with 2048 × 300 data points and 600 scans. No water suppression was implemented in the spectra. Proton chemical shifts were referenced to the water signal at 4.75 ppm. Spectra were processed with Varian software (vnmrj_1.1D). 2D experiments were analyzed with the program NEASY (C. Bartels, T. H. Xia, M. Billeter, P. Güntert and K. Wüthrich, J. Biomol. NMR, 1995, 5, 1) as implemented in Cara (http://www.nmr.ch/). Hydroxyl-oleic acid: 1H-NMR (ppm, DMSO-d6): 0.90 (t, J = 7.2 Hz CH3), 1.29 (broad signal, CH2), 1.43 and 1.53 (m, CH2–CHOH–CH2 and CH2–CH2COOH), 2.23 (t, J = 7.6 Hz CH2COOH), 3.24 (m, CHOH). 13C-NMR (ppm, DMSO-d6): 19.28, 27.55, 30.26, 34.45, 36.78, 39.08, 41.94, 84.73, 179.75. Pectin: 1H-NMR (ppm, D2O): 3.71 (H-2), 3.79 (OCH3), 3.99 (H-3), 4.44 (H-4), 4.94–5.06 (H-1 and H-5). Assignments for pectin are based on the ones published by Rosenbohm et al. (C. Rosenbohm, I. Lundt, T. M. I. E. Christensen and N. W. G. Young, Carbohydr. Res., 2003, 338, 637–649). Pectin-oleate (2a): 1H-NMR (ppm, D2O) pectin protons: 3.75, 3.80, 3.99, 4.41, 4.90, 4.95, 5.08; fatty acid chain: 0.88 (broad, CH3), 1.30 (broad, CH2), 1.53 (broad, CH2CH2COO), 2.04 (broad, CH2CH
![[double bond, length as m-dash]](https://www.rsc.org/images/entities/char_e001.gif) CHCH2), 2.16 (m, CH2COO), 5.46 (CH
CHCH2), 2.16 (m, CH2COO), 5.46 (CH![[double bond, length as m-dash]](https://www.rsc.org/images/entities/char_e001.gif) CH). Pectin-hydroxyl-oleate (2b): 1H-NMR (ppm, D2O) pectin protons: 3.74, 3.79, 4.00, 4.46, 4.95, 5.06; fatty acid chain: 0.88 (broad, CH3), 1.27 (broad, CH2), 1.58 (broad, CH2CH2COO and CH2CHOH), 1.97–2.30 (broad, CH2COO), 3.70 (overlapped, CHOH). Pectin-linoleate (2c): 1H-NMR (ppm, D2O) pectin protons: 3.73, 3.80, 3.98, 4.41, 4.90, 4.95, 5.08; fatty acid chain: 0.86 (broad, CH3), 1.30 (broad, CH2), 1.53 (broad, CH2CH2COO), 2.16 (m, CH2COO, CH
CH). Pectin-hydroxyl-oleate (2b): 1H-NMR (ppm, D2O) pectin protons: 3.74, 3.79, 4.00, 4.46, 4.95, 5.06; fatty acid chain: 0.88 (broad, CH3), 1.27 (broad, CH2), 1.58 (broad, CH2CH2COO and CH2CHOH), 1.97–2.30 (broad, CH2COO), 3.70 (overlapped, CHOH). Pectin-linoleate (2c): 1H-NMR (ppm, D2O) pectin protons: 3.73, 3.80, 3.98, 4.41, 4.90, 4.95, 5.08; fatty acid chain: 0.86 (broad, CH3), 1.30 (broad, CH2), 1.53 (broad, CH2CH2COO), 2.16 (m, CH2COO, CH![[double bond, length as m-dash]](https://www.rsc.org/images/entities/char_e001.gif) CH–CH2–CH
CH–CH2–CH![[double bond, length as m-dash]](https://www.rsc.org/images/entities/char_e001.gif) CH–CH2), 5.43 (CH
CH–CH2), 5.43 (CH![[double bond, length as m-dash]](https://www.rsc.org/images/entities/char_e001.gif) CH)..
CH).. - A. Kumar, R. R. Ernst and K. Wuthrich, Biochem. Biophys. Res. Commun., 1980, 95, 1–6 CAS.
- A. Bax and F. M. Summers, J. Am. Chem. Soc., 1986, 108, 2093–2094 CrossRef CAS.
-
FT-IR
characterization: all spectra of pectin and 2a–c were recorded on a Jasco spectrometer. Samples were ground into a fine powder using an agate mortar before being compressed into NaCl discs. The characteristic peaks of IR transmission spectra were recorded at a resolution of 4 cm−1 over a wavenumber region of 600–4000 cm−1. Pectin-oleate (2a): FT-IR (cm−1): 3437 ν (O–H), 2924 and 2857 ν (C–H), 1739 ν (C
![[double bond, length as m-dash]](https://www.rsc.org/images/entities/char_e001.gif) O ester), 1636 νas (COO−), 1442 νas (COO−), 1146 ν (COC) glycosidic bond, ring. Pectin-hydroxyl-oleate (2b): FT-IR (cm−1): 3438 ν (O–H), 2927 and 2855 ν (C–H), 1738 ν (C
O ester), 1636 νas (COO−), 1442 νas (COO−), 1146 ν (COC) glycosidic bond, ring. Pectin-hydroxyl-oleate (2b): FT-IR (cm−1): 3438 ν (O–H), 2927 and 2855 ν (C–H), 1738 ν (C![[double bond, length as m-dash]](https://www.rsc.org/images/entities/char_e001.gif) O ester), 1644 νas (COO−), 1441 νas (COO−), 1146 ν (COC) glycosidic bond, ring. Pectin-linoleate (2c): FT-IR (cm−1): 3434 ν (O–H), 2927 and 2855 ν (C–H), 1739 ν (C
O ester), 1644 νas (COO−), 1441 νas (COO−), 1146 ν (COC) glycosidic bond, ring. Pectin-linoleate (2c): FT-IR (cm−1): 3434 ν (O–H), 2927 and 2855 ν (C–H), 1739 ν (C![[double bond, length as m-dash]](https://www.rsc.org/images/entities/char_e001.gif) O ester), 1639 νas (COO−), 1445 νas (COO−), 1146 ν (COC) glycosidic bond, ring.
O ester), 1639 νas (COO−), 1445 νas (COO−), 1146 ν (COC) glycosidic bond, ring. - A. Synytsya, J. Copikova, P. Matejka and V. Machovic, Carbohydr. Polym., 2003, 54, 97–106 CrossRef CAS.
- M. P. Filippov, Food Hydrocolloids, 1992, 6, 115–142 CrossRef CAS.
- A. A. Kamnev, N. M. Ptitchkina, M. Ristic, O. G. Shkodina and V. V. Ignatov, in Spectroscopy of Biological Molecules, ed. J. C. Merlin, S. Turrell, and J. P. Huvenne, Kluwer, 1995a, Dordrecht, pp. 445–446. Search PubMed.
- R. G. Zhbankov, J. Mol. Struct., 1992, 275, 65–84 CrossRef CAS.
- (a) A. V. Matora, V. E. Korshunova, O. G. Shkodina, D. A. Zhemerichkin, N. M. Ptitchkina and E. R. Morris, Food Hydrocolloids, 1995, 9, 43–46 CrossRef CAS; (b) D. A. Zhemerichkin and N. M. Ptitchkina, Food Hydrocolloids, 1995, 9, 147–149 CrossRef CAS.
- A. Kumar and G. S. Chauhan, Carbohydr. Polym., 2010, 82, 454–459 CrossRef CAS.
| This journal is © The Royal Society of Chemistry 2011 |


