DOI:
10.1039/C0PY00270D
(Paper)
Polym. Chem., 2011,
2, 221-228
Synthesis and characterization of flexible epoxy nanocomposites reinforced with amine functionalized alumina nanoparticles: a potential encapsulant for organic devices†
Received
25th August 2010
, Accepted 19th October 2010
First published on 4th November 2010
Abstract
Research on conducting polymers, organic light emitting diodes and organic solar cells has been an exciting field for the past decade. The challenge with these organic devices is the long term stability of the active material. Organic materials are susceptible to chemical degradation in the presence of oxygen and moisture. The sensitivity of these materials towards oxygen and moisture makes it imperative to protect them by encapsulation. Polymer nanocomposites can be used as encapsulation materials in order to prevent material degradation. In the present work, amine functionalized alumina was used as a cross-linking and reinforcing material for the polymer matrix in order to fabricate the composites to be used for encapsulation of devices. Fourier transform infrared spectroscopy, X-ray photoelectron spectroscopy and Raman spectroscopy were used to elucidate the surface chemistry. Thermogravimetric analysis techniques and CHN analysis were used to quantify grafting density of amine groups over the surface of the nanoparticles. Mechanical characterizations of the composites with various loadings were carried out with dynamic mechanical analyzer. It was observed that the composites have good thermal stability and mechanical flexibility, which are important for an encapsulant. The morphology of the composites was evaluated using scanning electron microscopy and atomic force microscopy.
1. Introduction
Widespread and growing interest in organic semiconductors has increased research in the area of organic conductors.1–8 The biggest opportunities for organic displays and organic photovoltaic devices (OPVD) is when these devices are flexible, lightweight and can be fabricated in large areas compared to conventional materials. However, many of the materials used in organic devices are sensitive to the environment which limits their lifetime. The active device component degrades due to moisture and by photo oxidation by molecular oxygen.9,10 Various mechanisms have been proposed to explain the effect of moisture on organic materials, like water diffusion into the active organic layer to increase the conductivity of the sample.11,12 The adsorption of water changes the morphology of the organic thin film13 and the ions associated with water alter the electric field in the channel.14
Conjugated polymers such as poly(p-phenylene vinylene) are susceptible to photo degradation induced by oxygen.15,16 The mechanism involves the binding of singlet oxygen atoms to vinyl bonds, which breaks the conjugation and leads to the formation of carbonyl groups (two aldehyde molecules)17 and results in a decrease in refractive index and absorption coefficient.18 Usually the electrode materials chosen are aluminium and calcium that undergo oxidation on exposure to air. This leads to the formation of thin insulating oxide barriers,19 which hinders electric conduction and collection of the charge carriers. It has been shown that calcium can react with water at room temperature.20 Thus encapsulation of the active materials in order to protect them against deterrents has a wide range of possible attempted solutions.
Long operational lifetimes of solar cell devices are desirable and protection of the active component is critical. The active materials can be protected using substrates and barriers such as glass and metal, which result in a rigid device and do not satisfy the applications demanding flexible devices. Furthermore, these materials add to the cost of the devices. Plastic substrates and transparent flexible encapsulation barriers can be used, but these offer little protection to atmospheric oxygen and water. For example, polyolefines like polypropylene, polyethylene show a water vapour transmission rate (WVTR) in the range of 1–6 g m−2 day−1 and oxygen transmission rate (OTR) of 70–600 cm3m−2 day−1 whereas WVTR and OTR of 1 × 10⁻⁶ g m−2 day−1 and 1 × 10⁻³ cm3m−2 day−1 respectively has become the unofficial standard for organic devices.21,22 Therefore, there has been an intense interest in developing barrier materials like polymer nanocomposites with much lower permabilities.
Epoxy and silicone resins are the most frequently used polymeric materials for electronic, packaging, mechanical, and biological industrials due to their chemical modifiability and easy processability. The present work uses organo silane coupling methodology for developing amine functionalized alumina nanoparticles to be used as a filler in the polymer (poly(dimethylsiloxane) diglycidyl ether terminated) matrix. In this study, the polymer nanocomposites are prepared by amine functionalized γ-alumina nanoparticles that were dispersed in the epoxy polymer matrix and cured (Scheme 1).
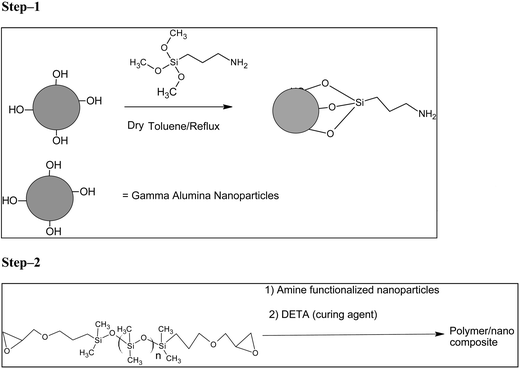 |
| | Scheme 1 (Step 1) Functionalization of the alumina surface with 3-amino propyl siloxane and (Step 2) preparation of polymer/nano composite. | |
2. Experimental section
2.1 Materials
Reagent grade aminopropyltrimethoxysilane (APTMS), diethylenetriamine (DETA), poly (dimethylsiloxane) diglycidyl ether terminated (Mn = 980, density = 0.99) and the aluminium oxide nanopowder used in this study was obtained from Sigma-Aldrich, UK. As supplied, the specifications of aluminium oxide are: gamma phase; average particle size of 40 nm; melting point of 2040 °C; and density of 3.97 g cm−3. Reagent grade toluene was obtained from local suppliers, which was distilled over pressed sodium and preserved under inert atmosphere before use.
2.2 Synthesis
2.2.1 Surface functionalization of alumina nanoparticles with aminopropyltrimethoxysilane (APTMS).
The functionalization of APTMS onto the surface of γ-alumina (average surface –OH density = 12.5 nm−2)23nanoparticles was performed according to the work of Tsubokawa et al.24 (without using any catalyst). Prior to silane modification, pristine γ-alumina nanoparticles were dried at 110 °C in a vacuum oven for 15 h to remove moisture adsorbed at the surface. 200 mg of nanoparticles were then dispersed by sonicating in dry toluene. 1 ml of APTMS was added to the mixture and was refluxed for 20 h under argon atmosphere. Dry toluene was used in order to prevent homopolycondensation of APTMS. This also promotes local hydrolysis of silane methoxy (Si–O–Me) groups to Si–OH, which then undergo condensation with Al–OH groups at the closest proximity of the nanoparticle surface. The resulting powder was then collected by ultra centrifugation and was washed several times with toluene to remove the unreacted siloxane moieties. The obtained mixture was dried under vacuum at 110 °C for 3 h to remove residual toluene.
2.2.2 Preparation of nanocomposites.
Various weight percentages (0.0238%, 0.11%, 0.18%, 0.265%, 0.4%) of amine functionalized nanoparticles was added to the epoxy matrix, and then dispersed using magnetic stirrer and further sonicated for 1 h at 40 °C. For convenience, the following nomenclature has been adopted in this work, S1 for 0.0238 wt%, S2 for 0.11 wt%, S3 for 0.18 wt%, S4 for 0.265 wt% and S5 for 0.4 wt%. Diethylenetriamine curing agent was then added to the mixture and blended using a magnetic stirrer and then sonicated for 30 min. The resulting mixture was cured under 15 mm Hg vacuum at 135 °C for 1 h.
2.2.3 Characterization.
Fourier transform infrared spectroscopy (FTIR) spectra of both neat and functionalized alumina nanoparticles were obtained to elucidate the surface chemistry using a Perkin–Elmer (Spectrum GX) spectrometer. The FTIR spectra were recorded using potassium bromide pellets of both neat and functionalized alumina powder and analyzed in the range 400 cm−1 to 4000 cm−1 with a resolution of 4 cm−1. The conjugation of APTMS was also investigated by X-ray photoelectron spectroscopy (XPS), CHN analyzer and thermogravimetric analysis (TGA) technique, Brunauer–Emmett–Teller (BET) isotherm, and Raman spectroscopy. XPS spectra of selected samples (dried) were recorded in Thermo Scientific Multilab 2000 instrument. Raman spectra were obtained using Lab Ram HR (high resolution) Raman spectrometer. The surface area of both neat and functionalized alumina was measured by BET nitrogen sorption method at 77 K with a Belsorp instrument (Japan). For the nitrogen adsorption/desorption experiments, both neat and functionalized samples were degassed at 120 °C for 5 h. TGA was carried out using a high–resolution TGA 2950 (TA instruments– STA 409PC) with a heating rate of 10° min−1 in alumina crucible to evaluate coating formation over the nanoparticles and for quantification of grafting, in addition to the thermal stability of the composites. Thermo Finnigan FLASH EA 1112 analyzer was used for elemental analysis. Differential scanning calorimetry (DSC) technique was used in order to monitor the curing reaction in Mettler Toledo (DSC 822e) instrument at a heating rate of 10 °C min−1 in argon atmosphere at a flow rate of 80 ml min−1 in hermitic aluminium pan. Mechanical properties of the composites were evaluated using dynamic mechanical analyser (DMA) in compression mode in Gabo, Explexor 500N, Germany at 10 Hz frequency at 28.5 °C. Portable Nanosurf Easy Scan–2 atomic force microscope was used for evaluating surface morphology of the composites. The morphology of the cross–sectional surface of the frozen (liquid nitrogen) fractured surfaces of the composites were observed using scanning electron microscopy (SEM), which was carried out using ESEM Quanta. Prior to the SEM analysis, samples were sputter–coated with thin film of gold. Pristine alumina powder sample was directly coated over carbon tape and was sputter coated with gold. JEOL 2000 FX–II TEM was used to observe the size and morphology of the neat alumina nanoparticles at an accelerating voltage of 200 kV. The resistances of the composites were measured with a 4155C Agilent semiconductor parametric analyzer.
3. Results and discussions
3.1 Synthesis
The surface functionalization of neat alumina was carried out with aminopropyl trimethoxy silane. Silanes are bifunctional molecules with the general chemical formula Y–(CH2)n–Si–R3, where Y represents the head group functionality (here it is –NH2), (CH2)n an alkane chain and Si–R3 the anchor group by which the silane will be grafted to the metal–oxide surface forming strong M–O–Si bond (M is the metal from the inorganic substrate).25 As the surface is functionalized with surface pendant –NH2, which helps to make the surface polar, this helps the nanoparticles to become compatible in the epoxy polymer matrix. The amine functional alumina nanoparticles can serve two purposes as reactive –NH2 is exposed at the surface. First, the nanoparticles can themselves participate in the curing reaction with the epoxy resin (See ESI Fig. S1†), by which they can be readily incorporated inside the epoxy resin and provide multiple binding sites to the epoxy matrix so that the load can be transferred to alumina nanoparticles. Secondly, the free amine hydrogens at the surface can form H-bonds with the oxygen atom of the –OH group of the cured polymer (See ESI Fig. S2†) and thus helps to increase the interfacial interaction. This increase in the interfacial interaction results in an increase in the thermal and mechanical stability of the composites. Furthermore the nanoparticles can reduce the permeability of moisture because of tortuous pathway.
3.2. Characterization
3.2.1
FTIR spectroscopy
.
The FTIR spectra of unmodified as well as amine functionalized alumina nanoparticles are shown in Fig. 1. Several peaks are present in the modified alumina, which are not present in neat alumina particles. This is due to the grafting of siloxane molecules onto the surface of the nanoparticles. In neat alumina, the broad peak at 3464 cm−1 is indicative of the presence of –OH groups on the nanoparticle surface (OH stretching–Al–OH) and peak at 1637 cm−1 is due to –OH bending. After grafting, the peak appears at 2925, 2851 cm−1 which are characteristics of asymmetric and symmetric –CH2 stretching vibrations respectively. The appearance of a band at 1490 cm−1 is due to –CH2 bending (scissoring) vibration. Bands at 1567 and 1120 cm−1 are due to N–H bending (scissoring) and C–N stretching respectively.
3.2.2
Raman spectroscopy
.
In Raman spectra (see ESI Fig. S3†), the observed bands in the region of 2820 to 3000 cm−1 are characteristic of aliphatic C–H bonds. Amines are generally characterized by the N–H band present between 3500 and 3200 cm−1, which is not observed in ESI Fig. S3,† as it is difficult to see the amine band in Raman spectra, which may be due to relatively lower concentration,26 but can be detected from XPS as discussed later. FTIR and Raman spectrum indicates successful surface modification of alumina with APTMS.
3.2.3
XPS
.
The high resolution O1s spectrum (Fig. 2) of pure alumina shows two peaks at 530.8 eV and 532.3 eV, which can be attributed to oxygen in an O–H component (exposed at the surface) of aluminium oxohydrides and to oxygen in an Al–O component of alumina respectively. After modification with APTMS, the broad shoulder for the high resolution XPS spectra of O1s spectrum exhibited an additional peak around 531.5 eV, corresponding to oxygen in Al–O–Si, suggesting chemical bonding between siloxane and aluminium oxide. In the functionalized alumina the observed peak at 399.6 eV corresponds to the free –NH2groups (See ESI Fig. S4†).
 |
| | Fig. 2
XPS spectra of oxygen (O1s) before (A) and after (B) functionalization. | |
3.2.4 BET.
The surface functionalization was further evaluated by nitrogen adsorption and desorption isotherm. The BET surface area for neat alumina was calculated to be approximately 130 m2g−1. Surface functionalization of the alumina resulted in a decrease in the surface area. For amine functionalized alumina, the surface area was found to be 26 m2 g−1. Fig. 3 shows the observed variation of nitrogen uptake as a function of relative pressure. This indicates that for both the samples, isotherms increases gradually up to P/P0 = 0.8. Beyond P/P0 > 0.8, the adsorption branches decrease sharply, but do not reach a stable state even when P/P0 ≈ 1.0. This isotherm indicates a Type–II isotherm of the six types of adsorption isotherms as depicted by IUPAC classification.27 Type II isotherms, which are generally referred to as sigmoid isotherms, are very common in the physical adsorption in powdered samples which corresponds to a multilayer formation.28 Type–II isotherm indicates either nonporous or macroporous nature of the samples. The typical hysteresis loop (H3 type) between desorption and adsorption branches indicates the macropore structure of the sample, which may arise due to agglomeration of the particles. The agglomeration is evident from the SEM image (Fig. 4) of neat alumina powder sample. After surface modification the disruption of agglomeration may also contribute to reduce the surface area. Furthermore, the decrease in C constant (the enthalpy of adsorption29) indicates the decrease in interaction between adsorbate nitrogen molecules and the particle surface after modification with siloxane ligand (Table 1). The total pore volume also decreases after functionalization but the mean pore diameter remained unchanged after functionalization.
 |
| | Fig. 3
Nitrogen
adsorption/desorption isotherm for neat (A) and functionalized alumina (B). | |
Table 1 Various parameters obtained from BET, CHN and TGA analysis for neat and functionalized alumina
| Analysis technique |
Parameters |
Neat alumina |
Functionalized alumina |
| BET |
Surface area (aBET) [m2g−1] |
130 |
26 |
| Total pore volume (P/Po = 0.99) [cm3 g−1] |
0.8618 |
0.1956 |
|
Vm [cm3(STP) g−1] |
29.7 |
6.0 |
| C |
83.9 |
30.34 |
| Mean pore Diameter/nm |
26.59 |
30.34 |
|
CHN–analysis |
Carbon (%) |
0.4069 |
6.5686 |
|
Nitrogen (%) |
— |
3.5793 |
|
Hydrogen (%) |
1.4197 |
2.23 |
| Surface grafting density/μmol m−2 |
— |
13.16 ± 1.2 |
|
TGA
|
Surface grafting density/μmol m−2 |
— |
15.3 ± 0.3 |
3.2.5
TGA
.
The attachment of APTMS on the alumina surface was also evaluated by thermal analysis. The comparative weight loss for neat and functionalized alumina between room temperature and 950 °C is shown in Fig. 5. The weight loss in case of neat alumina up to 400 °C is mainly due to desorption of physically adsorbed water and carbon dioxide. Beyond 400 °C, the weight loss is mainly due to dehydration reaction due to condensation of the –OH groups at the surface of nanoparticle.23,30 In case of functionalized alumina, the weight loss from room temperature to 150 °C is due to the loss of physically adsorbed water from the surface whereas the weight loss in the second regime of 160 to 750 °C corresponds to the decomposition of the coupling agent (APTMS). With successive surface functionalization, there is also decrease in surface area that is observed from BET, as discussed previously. The results of thermogravimetric analysis were used further to calculate the approximate grafting density of APTMS at the surface.
In case of APTMS functionalized alumina, the weight loss of 11.6% between 160 to 750 °C is due to decomposition of organic coating. Considering loss due to the organic fragment, the grafting density was calculated to be 15.3 ± 0.3 μmol m−2 (∼9.2 nm−2), using the expression,31QTGA = W/(MCF × S), where W = weight loss (∼11.6%), MCF = molecular weight of corresponding organic fragment, S = specific surface area of alumina used (130 m2 g−1 as estimated from BET). TGA analysis shows 73.6 ± 1.6% of surface coverage by the APTMS, considering average surface –OH group density23 of γ-alumina is 12.5 nm−2. The results were used further to calculate the number of APTMS molecules attached to each alumina particle. The result of this evaluation reveals that APTMS accounts for approximately 11.6% of the mass of stock alumina. Coupled with the molar mass of APTMS, each alumina particle (mean diameter as ∼40 nm) was found to contain ∼58,615 ± 845 functional sites calculated approximately according to the following expression32 (based on spherical nanoparticles),
Where
NAPTMS is the number of APTMS molecules bound to each particle,
R is the mean radius of
alumina nanoparticles,
ρ is the density of
alumina,
N is Avogadro's number,
M is the relative molecular weight of APTMS, and
w is the weight loss.
3.2.6
CHN
.
From the elemental analysis, it is observed (Table 1) that there is an increase in the carbon content and also in hydrogen content after functionalization. This indicates the attachment of organic fragment (APTMS) over the surface.
From CHN analysis, the grafting density is calculated approximately to be 13.16 ± 1.2 μmol m−2 (∼7.9 nm−2) using the expression,31QCHN = δC/ (MC × NC × SA), where δC = increase in carbon content (%) from CHN, M = atomic wt. of carbon, N = number of carbon atoms, SA = specific surface area (130 m2 g−1, as estimated from BET). CHN analysis shows 64 ± 5.5% of surface coverage of APTMS, considering average surface –OH group density of γ-alumina is 12.5 nm−2.
Though FTIR and XPS indicates attachment of APTMS on the surface of alumina, TGA and elemental analysis was also performed in order to quantify approximate grafting density of APTMS moieties attached with the alumina surface. APTMS quantification from TGA was also confirmed by elemental analysis using CHN (Table 1). TGA shows a grafting density of 15.3 μmol m−2 (73 ± 1.6% of surface coverage) which is similar to the value of 13.16 μmol m−2 (64 ± 5.5% of surface coverage) as observed from elemental analysis. These two values are the normalized values with respect to the surface area calculated from BET.
3.2.7
DSC
.
The curing reaction was studied by DSC for S1 composition. The heating program was from 0 °C to 200 °C at rate of 10 °C min−1. The sample was cooled back to 0 °C and again heated to 250 °C to check the possible reversible reactions. From the DSC thermogram (Fig. 6) it is observed that the curing reaction, indicated by an exothermic peak appears about 130 °C in the first cycle which does not reappear on second heating. From the thermogram, the curing peak onset Tonset was observed at about 114 °C and Tmidpoint at 135 °C. In the DSC curing curve the two humps are observed with the first peak occurring due to curing by the curing agent (DETA) with epoxy group of the polymer. The second peak indicating a secondary reaction due to the curing by amines, which are bound at the surface of the nanoparticles. Since it is bound to the surface having lower mobility than DETA, it reacts at a higher temperature, as observed in the DSC thermogram. The endothermic transition (∼64 Jg−1) on 1st heating at about 75 °C is due to breaking of long range and short range order/intermolecular interaction in the viscous polymer system which is analogous to melting. On second heating, due to cross-linking, a very small endothermic transition appears at the same temperature indicating breaking of the order/intermolecular interaction.
3.2.8
TGA of composites.
One of the important properties of the encapsulant is the thermal stability, as it has to withstand environmental conditions over a period of time protecting the OPV devices. The TGA thermograms for the five composites were as shown in the ESI Fig. S5.† Samples were heated up to 900 °C at a heating rate of 10 °C min−1. From the thermogram it was observed that for the S1, S2, S3 and S4 composites, 10% degradation takes place at a temperature of ∼ 305 °C. But for S5 (0.4 wt %), a drastic decrease in the decomposition temperature is observed (273 °C) which may be due to the agglomeration of the nanoparticles in the polymer matrix. Since the loadings are high, agglomeration (see ESI Fig. S7A and B†) of the nanoparticles occurs in the matrix, which results in the decrease of decomposition temperature.
3.2.9 DMA.
DMA was used in order to evaluate the mechanical property of the composites.33,34 DMA provides us important information's in terms of parameters like (1) E′, (2) E′′ and (3) E*. The storage modulus E′ represents the elastic properties of a material, which is related to stiffness of that material. The loss modulus (E′′) represents the viscous properties and tanδ (which is the ratio of loss modulus to storage modulus [E′′/E′]) represents the damping coefficient of the material E* (complex modulus) is given by the following expression, E* = E′ + E′′ and when E* is almost equal to E′, it indicates that E′′ is negligible, representing no loss, and hence the material is flexible. The DMA result indicates (Fig. 7) that with an increase in loadings up to the composition S3 (0.18 wt%) the E′ (storage modulus) and E* (complex modulus) increase and then decrease with further loading, whereas the reverse is observed for tanδ (damping coefficient). Furthermore, we can see for all the compositions, E′ is closer to E* (also higher than E′′ i.e. the loss modulus) indicating that the flexibility of the composites. The composition of S3 is the percolation threshold, which can be seen from the Fig. 8 after which E* value decreases for all the compositions and the opposite situation is observed for tanδ. E′ also follows the same trend as E*. Hence DMA results infer that this composite material at an optimum loading of S3 can be both flexible and have mechanical strength suitable for encapsulation purpose.
 |
| | Fig. 7
E*, E′ and tanδ of various composites of various composites. | |
 |
| | Fig. 8
SEM micrographs of fracture surfaces of S1, S2, S3, S4, and S5. | |
3.2.10
AFM
.
The surface topography of the composite films was studied by atomic force microscopy. AFM images (see ESI Fig. S6†) show that with an increase in nanoparticle loading, surface roughness (morphological disorderedness) of the film increases. Therefore, in the case of encapsulation, a critical loading of amine functionalized nanoparticles is important in order to get a film with a lower surface roughness as well as mechanical strength.
3.2.11 Resistance measurements.
The resistances of all the composites were found to be of the order of 2.43 to 3.39 × 10⁸ ohms. This electrical insulation behaviour of nanocomposites is very important as it avoids electrical interference of devices when they are encapsulated.
3.2.12
SEM
.
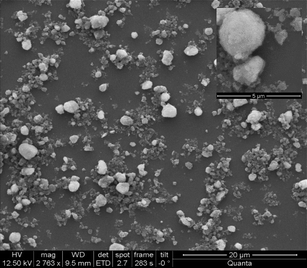
SEM study of samples was carried out using ESEM Quanta. Fig. 8 shows the SEM micrographs of cryogenically fractured surface of the composite samples with various weight percent of functionalized alumina particles. The composites show deformation and cleavages as the nanocomposite is fractured. With an increase in functionalized nanoparticle loading, the morphology of the fractured surfaces indicates more deformation and fractured surfaces. This increase in deformation is due to increase in interfacial bonding between functionalized nanoparticles and the polymer matrix.
Fig. S7 (A) and (B) (see ESI†) represent the morphology of the surface of composite having 0.4 wt% (S5) loadings. The composite S5 shows agglomeration of alumina nanoparticles in the matrix. TGA result shows a decrease in the decomposition temperature due to agglomeration for S5, which was evident from SEM study.
3.2.13
TEM
.
From TEM image (Fig. 9), both rod and spherical shaped nanoparticles were observed. The synergistic effect of the rod shaped and spherical nanoparticle geometry increases the torturous pathway for water molecules; consequently the permeability of the composite will decrease further.
3.2.14 Stability of composites at different pH.
To evaluate the stability of alumina nanoparticles in both acidic and basic solutions, hydrochloric acid solution (pH = 0) and sodium hydroxide solution (pH = 14) were used to treat the nanocomposites respectively.35 Samples were then immersed in de-ionized water for 24 h for saturation and then placed into highly acidic and basic solutions for 60 h. Finally the exposed samples were again immersed in de-ionized water. However, there was no weight loss observed in both the pH conditions indicating the polymer matrix effectively encapsulates and protects the alumina nanoparticles from dissolution in acidic or basic solutions. This indirectly indicates that this nanocomposite encapsulant can decrease the permeability of moisture.
4. Conclusion
In conclusion, γ-alumina nanoparticles with surface-pendant amine groups have been synthesized using a silane coupling agent i.e.3-aminopropyltrimethoxy silane. Surface functionalization was evidenced by FT-IR, Raman and XPS. The amino groups at the surface can also act as a curing agent as well as form H-bonds inside the matrix consequently making a stable composite. Quantification of the ligands at the surface of the nanoparticles was successfully carried out by TGA and CHN. BET isotherms show a significant decrease in specific surface area with functionalization. TGA and DMA were used to characterize the thermal and mechanical properties of the composites. From TGA, composites are observed to be stable up to 305 °C. The DMA results indicate that the composite with a loading of about 0.18% nanoparticles displays optimal mechanical strength and flexibility, which is important for an encapsulant. The AFM images show the surface irregularity increases with the increase in nanoparticle loadings and the resistance measurement shows the composites are good insulators. SEM images of fractured surface show interfacial binding is present within the matrix. The thermal and mechanical properties deteriorate with higher loadings. Thus, we can infer that the optimum loading of amine functionalized nanoparticles in the composite matrix is very critical for the purpose of encapsulation. Furthermore, the stability of the polymer matrix at extreme pH values indicates that polymer matrix is effectively encapsulating and protecting the alumina nanoparticles. This observation indicates that the composites have a robust structure that prevents the permeability of moisture into the interior of the nanocomposites and therefore, can be potentially used for encapsulation.
Acknowledgements
The authors acknowledge Institute Nano Science Initiative (INI) of Indian Institute of Science, Bangalore. S.G. acknowledges Council of Scientific and Industrial Research (C.S.I.R), New Delhi for financial support.
Notes and references
- C. J. Brabec, N. S. Sariciftci and J. C. Hummelen, Adv. Funct. Mater., 2001, 11, 15–26 CrossRef CAS.
- H. Spanggaard and F. C. Krebs, Sol. Energy Mater. Sol. Cells, 2004, 83, 125–146 CrossRef CAS.
- H. Hoppe and N. S. Sariciftci, J. Mater. Res., 2004, 19, 1924–1945 CAS.
- C. Winder and N. S. Sariciftci, J. Mater. Chem., 2004, 14, 1077–1086 RSC.
- E. Bundgaard and F. C. Krebs, Sol. Energy Mater. Sol. Cells, 2007, 91, 954–985 CrossRef CAS.
- P. C. Ramamurthy, A. M. Malshe, W. R. Harrell, R. V. Gregory, K. McGuire and A. M. Rao, Solid-State Electron., 2004, 48, 2019–2024 CrossRef CAS.
- P. C. Ramamurthy, W. R. Harrell, R. V. Gregory, B. Sadanadan and A. M. Rao, Mater. Res. Soc. Symp. Proc., 2004, 791, 1–6.
- P. C. Ramamurthy, W. R. Harrell and R. V. Gregory, Electrochem. Solid-State Lett., 2003, 6, 113–116.
- B. H. Cumpston, I. D. Parker and K. F. Jensen, J. Appl. Phys., 1997, 81, 3716–3720 CrossRef CAS.
- V. N. Bliznyuk, S. A. Carter, J. C. Scott, G. Klarner, R. D. Miler and D. C. Miller, Macromolecules, 1999, 32, 361–369 CrossRef CAS.
- R. B. Ye, M. BaBa, K. Suzuki, Y. Ohishi and K. Mori, Thin Solid Films, 2004, 464–465, 437–440 CrossRef CAS.
- Y. Qiu, Y. C. Hu, G. F. Dong, L. D. Wang, J. F. Xie and Y. L. Ma, Appl. Phys. Lett., 2003, 83, 1644–1646 CrossRef CAS.
- Z. T. Zhu, J. T. Mason, R. Dieckmann and G. G. Malliaras, Appl. Phys. Lett., 2002, 81, 4643–4645 CrossRef CAS.
- D. Li, E. Borkent, R. Nortrup, H. Moon, H. Katz and Z. Bao, Appl. Phys. Lett., 2005, 86, 042105 CrossRef.
- R. D. Scurlock, B. Wang, P. R. Ogilby, J. R. Sheats and R. L. Clough, J. Am. Chem. Soc., 1995, 117, 10194–10202 CrossRef CAS.
- H. Y. Low, Thin Solid Films, 2002, 413, 160–166 CrossRef CAS.
- D. G. J. Sutherland, J. A. Carlisle, P. Elliker, G. Fox, T. W. Hagler, I. Jimenez, H. W. Lee, K. Pakbaz, L. J. Terminello, S. C. Williams, F. J. Himpsel, D. K. Shuh, W. M. Tong, J. J. Lia, T. A. Callcott and D. L. Ederer, Appl. Phys. Lett., 1996, 68, 2046–2048 CrossRef CAS.
- S. Kumar, A. K. Biswas, V. K. Shukla, A. Awasthi, R. S. Anand and J. Narain, Synth. Met., 2003, 139, 751–753 CrossRef CAS.
- L. M. Do, E. M. Han, Y. Nidome, M. Fujihira, T. Kanno, S. Yoshida, A. Maeda and A. J. Ikushima, J. Appl. Phys., 1994, 76, 5118–5121 CrossRef CAS.
- S. Cros, M. Firon, S. Lenfant, P. Trouslard and L. Beck, Nucl. Instrum. Methods Phys. Res., Sect. B, 2006, 251, 257–260 CrossRef CAS.
- P. E. Burrows, G. L. Graff, M. E. Gross, P. M. Martin, M. Hall, E. Mast, C. C. Bonham, W. D. Bennett, L. A. Michalski, M. S. Weaver, J. J. Brown, D. Fogarty and L. S. Sapochak, Proc. SPIE, 2001, 4105, 75–83 CAS.
- J. S. Lewis and M. S. Weaver, IEEE J. Sel. Top. Quantum Electron., 2004, 10, 45–57 CrossRef CAS.
- G. W. Kabalka and R. M. Pagni, Tetrahedron, 1997, 53, 7999–8065 CrossRef CAS.
- N. Tsubokawa, K. Maruyama, Y. Sone and M. Shimomura, Polym. J., 1989, 21, 475–481 CrossRef CAS.
-
R. A. Whitehead, M. S. Chagnon, E. V. Groman and L. Josephson, US Pat., 4
![[thin space (1/6-em)]](https://www.rsc.org/images/entities/char_2009.gif) 554088, 1985.
554088, 1985.
- M. W. Mckittrick and C. W. Jones, Chem. Mater., 2003, 15, 1132–1139 CrossRef CAS.
- K. S. W. Sing, D. H. Everett, R. A. W. Haul, L. Moscou, R. A. Pierotti, J. Rouquerol and T. Siemieniewska, Pure Appl. Chem., 1985, 57, 603–619 CrossRef CAS.
-
A. W. Adamson, A. P. Gast, Physical Chemistry of Surfaces, Wiley- Interscience, New York, USA, 6th edn, 1997, ch. 17, pp. 653–670 Search PubMed.
- S. Brunaur, P. H. Emmett and E. J. Teller, J. Am. Chem. Soc., 1938, 60, 309–319 CrossRef CAS.
- M. Abboud, M. Turner, E. Duguet and M. Fontanille, J. Mater. Chem., 1997, 7, 1527–1532 RSC.
- O. Bordelanne and M. Delville, Solid State Sci., 2002, 4, 851–858 CrossRef CAS.
- B. Pan, F. Gao and H. Gu, J. Colloid Interface Sci., 2005, 284, 1–6 CrossRef CAS.
- P. C. Ramamurthy, W. R. Harrell, R. V. Gregory, B. Sadanadan and A. M. Rao, J. Electrochem. Soc., 2004, 151, 502–506.
- W. S. Hanoosh and E. M. Abdelrazaq, Malays. Polym. J., 2009, 4, 52–61 Search PubMed.
- Z. Guo, T. Pereira, O. Choi, Y. Wang and H. T. Hahn, J. Mater. Chem., 2006, 16, 2800–2808 RSC.
Footnote |
| † Electronic supplementary information (ESI) available: Fig. S1–S7. See DOI: 10.1039/c0py00270d |
|
| This journal is © The Royal Society of Chemistry 2011 |
Click here to see how this site uses Cookies. View our privacy policy here.