Effect of monomer/oxidant mole ratio on polymerization mechanism, conductivity and spectral characteristics of mechanochemically prepared polypyrrole†
Oleg Yu.
Posudievsky
* and
Olga A.
Kozarenko
L.V. Pisarzhevsky Institute of Physical Chemistry of the National Academy of Sciences of Ukraine, 31 prospekt Nauki, Kiev, 03028, Ukraine. E-mail: posol@inphyschem-nas.kiev.ua; Fax: +38044 525 6216; Tel: +38044 525 6672
First published on 30th September 2010
Abstract
The effect of the composition of the initial reaction mixture – pyrrole/oxidant mole ratio – on the mechanism of mechanochemical polymerization of pyrrole was studied. Experimental evidence in favor of the chain mechanism for mechanochemical formation of the highly conducting PPy at high monomer/oxidant mole ratio was first obtained. Interrelation between polymerization mechanism and structure, conductivity and spectral characteristics of the prepared polypyrrole samples was considered.
Introduction
Conducting conjugated polymers attract researchers' attention due to their prospective functional properties. Among conducting polymers, polypyrrole (PPy) is one of the most promising materials as it possesses good stability and high conductivity and could be used in different types of power sources, sensors, functional membranes and so on.1–5PPy is usually prepared by chemical or electrochemical oxidative polymerization. The synthesis could be performed in both aqueous solutions (water and solutions of acids) and organic solvents (acetonitrile, propylene carbonate, etc.) using salts of ferric iron or divalent copper as well as ammonium persulfate.6,7 Polymerization of pyrrole in aqueous medium and usage of ammonium persulfate as an oxidant allows preparing PPy with conductivity not higher than the only level of 0.5 S cm−1 at the optimal monomer/oxidant mole ratio equal to 1/1.2.6
Recently we have shown the possibility of preparing PPy by the mechanochemical route.8 Performing the polymerization without using any solvent as a reaction medium has been more environmentally friendly in comparison with the common methods mentioned above. The greatest level of conductivity (6.5 S cm−1) has been achieved for ammonium persulfate as an oxidant. Besides this, a high yield of the polymer has been obtained at the value of monomer/oxidant mole ratio equal to two, which is unusual for polymerization of pyrrole.6,7 Such features have allowed us to propose the possibility of another polymerization mechanism of pyrrole.8 Here, we present experimental evidence in favor of that and report the effect of the composition of the initial reaction mixture – monomer/oxidant mole ratio – on the mechanism of mechanochemical polymerization of pyrrole, structure, conductivity and spectral characteristics of the mechanochemically prepared PPy samples.
Experimental
Preparation of polymer samples
Preparation of PPy was carried out by mechanochemical treatment of the monomer/oxidant mixture in an agate grinding bowl of the planetary ball mill Pulverisette 6 (Fritsch) at rotation rate of 300 rpm during 1 h in argon atmosphere. Preliminarily distilled pyrrole (98%+, Alfa Aesar) and ammonium persulfate (≥98.0%, Aldrich) were used as a monomer and an oxidant correspondingly. The monomer/oxidant mole ratio (r) was varied from 0.75 to 4.00 and the prepared polymer sample was denoted as PPyr. At r = 4.00 the quantity of the oxidant in the reaction mixture proved to be insufficient to realize polymerization reaction in the stated conditions. The prepared solid product was immediately thoroughly washed with acetone and water, and then dried in vacuum at 60 °C. As a result we obtained the samples in the form of finely dispersed black powder. For determination of the yield, PPyr was dedoped in hydrazine hydrate up to the point where gas release stopped. Anal. Calcd C4NH3(HSO4)0.33: C, 49.5, H, 3.43, N, 14.4, S, 10.9. Found C, 49.5, H, 3.37, N, 14.3, S, 10.7; (PPy2.00); C, 48.9; H, 3.31; N, 14, S, 10.8; (PPy1.33); C, 48.6; H, 3.26 N, 13.9, S, 10.4; (PPy1.00); C, 48.2; H, 3.27, N, 14, S, 9.6 (PPy0.75).Characterization
The yield of the polymer (Y) was calculated as percent of original amount of pyrrole on weight basis. C, H, N analysis was conducted using Carlo Erba 1106. Analysis of gases released in the grinding bowl during preparation of the polymers was carried out by means of gas chromatograph 3700 (EuroLab, Russia) with a heat conductivity detector (current of 63 mA, temperature of 70 °C) and a 2 m column filled with CaA at 40 °C and argon flow rate of 30 mL min−1. Specific conductivity (σdc) was measured using the standard four probe method with an accuracy of 10%, and the ohmic character of the contacts with the pressed tablets of the polymer samples was achieved by the gold plating of the probe tips. X-Ray powder diffraction patterns of the as-received and purified samples were obtained on diffractometer D8 ADVANCE (Bruker) using filtrated Cu-Kα irradiation in the range of 2θ = 1–40° with 0.05° increment and signal acquisition interval of 50 s. Electron micrographs of PPy nanoparticles and corresponding SAED patterns were obtained using a TEM125K (SELMI) microscope working at the voltage of 100 kV; amorphous carbon film which covered the copper grid was used as a carrier for the polymer samples which were deposited from aqueous dispersions prepared by ultrasonic disintegration on Sonopuls HD 2070 (BANDELIN). Optical absorption spectra were recorded on double beam spectrophotometer 4802 (UNICO) with a resolution of 2 nm using the same dispersions. The spectra were also used to calculate optical conductivity (σopt) in accord with ref. 9. FTIR spectra of PPy samples in KBr tablets were registered by SPECTRUM ONE (PerkinElmer) with an accuracy of 2 cm−1. ESR spectra were obtained in equal conditions on spectrometer E-9 (Varian) utilizing a sample of Mn2+ isomorphically substituted in the crystal lattice of MgO as a standard for determining the values of g-factor and linewidth, the accuracy of calculation being equal to 0.0003 and 0.1 G respectively. Cyclic voltammetry studies were performed by electrochemical analyzer μAUTOLAB III/FRA2 (ECO CHEMIE) in the potential range 2.0–4.0 V vs. Li/Li+ at scan rate of 50 mV s−1 in a three-electrode electrochemical cell using 1 M solution of LiClO4 in ethylene carbonate/dimethyl carbonate mixture (1![[thin space (1/6-em)]](https://www.rsc.org/images/entities/char_2009.gif) :
:![[thin space (1/6-em)]](https://www.rsc.org/images/entities/char_2009.gif) 1, vol.%) as an electrolyte.
1, vol.%) as an electrolyte.
Results and discussion
Samples of PPyr with different value of x were prepared as a result of the described mechanochemical process. Formation of the polymer was confirmed by the data of FTIR spectroscopy: characteristic bands7 about 794, 932, 1053, 1113, 1213, 1296, 1480 and 1560 cm−1 were present in the spectra of all PPyr samples (Fig. 1). The band at about 1710 cm−1 was also present in the spectra, though its intensity in PPy2.00 was very low, at the level of noise. According to ref. 7, that band was connected with carbonyl defects in the macromolecules when conjugation in pyrrole ring is disrupted due to formation of C![[double bond, length as m-dash]](https://www.rsc.org/images/entities/char_e001.gif) O bond. Numeric analysis of the spectra showed that the normalized integral intensity of that band, I1710/I1560, is proportional to the content of the oxidant in the parent reaction mixture (Fig. 2a). As the mechanochemical preparation of PPy had been performed in the atmosphere of argon, initiation of such defects is probably connected with the effect of the oxidant on the polymer during the mechanochemical treatment.
O bond. Numeric analysis of the spectra showed that the normalized integral intensity of that band, I1710/I1560, is proportional to the content of the oxidant in the parent reaction mixture (Fig. 2a). As the mechanochemical preparation of PPy had been performed in the atmosphere of argon, initiation of such defects is probably connected with the effect of the oxidant on the polymer during the mechanochemical treatment.
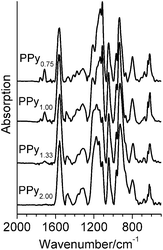 | ||
| Fig. 1 FTIR spectra of PPyr samples. | ||
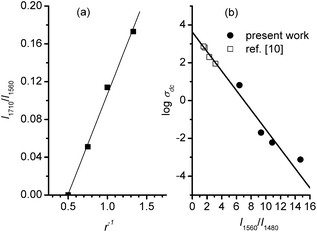 | ||
| Fig. 2 The linear dependence of the characteristics of FT-IR spectra on the oxidant/monomer mole ratio (a) and log σdc (b) for PPyr samples. | ||
The yield of PPy at the mechanochemical preparation increased with the value of the monomer/oxidant mole ratio in the initial reaction mixture (Table 1). Such dependence of Y(r) is opposite to the relation that takes place at polymerization of pyrrole under the effect of the same oxidant in aqueous solution.6 Although the maximal yield of PPy in the case of mechanochemical and common (in aqueous solution) methods were comparable, the efficiency of the mechanochemical method was higher as the yield of PPy synthesized in water in one hour was only 28%.1
| PPy2.00 | PPy1.33 | PPy1.00 | PPy0.75 | |
|---|---|---|---|---|
| Y (%) | 85 | 80 | 76 | 75 |
| I 1560/I1480 | 6.4 | 9.3 | 10.9 | 14.7 |
| σ dc , S cm−1 | 6.5 | 2.0 × 10⁻² | 6.0 × 10⁻³ | 7.5 × 10⁻⁴ |
| σ opt , S cm−1 | 13 | 2.1 | 0.77 | 0.42 |
All prepared PPyr samples were conductive, the value of σdc being increased, with r achieving 6.5 S cm−1 at r = 2.00 (Table 1). Therefore, the conductivity of the mechanochemically prepared PPy exceeded that of PPy synthesized in aqueous medium using the same oxidant (0.5 S cm−1![[thin space (1/6-em)]](https://www.rsc.org/images/entities/char_2009.gif) 6 and 0.9 S cm−1 in accord with our revision synthesis under the same conditions). It was obvious that the mechanochemical preparation of the polymer differed from the synthesis in the solution6 as its maximal yield and the highest conductivity of PPy were achieved at high values of the monomer/oxidant mole ratio. We thought that distinction was probably connected with different conditions at which polymerization was realized. It is considered in the literature6,10 that in solution PPy is formed as a result of addition polymerization of cation-radicals of pyrrole. The probability of reaction of the monomer with the oxidant is high in solution and is practically equal throughout the whole volume, which provides high concentration of cation-radicals of pyrrole and increases the probability of their polymerization by the mechanism of radical-radical bonding. To realize this, a relatively large amount of the oxidant is then needed – one molecule of ammonium persulfate per one molecule of pyrrole plus some quantity of the oxidant for doping of the forming macromolecules. In mechanochemical preparation of the polymer, the quantity of the oxidant, especially in the case of the PPy2.00 sample with maximal conductivity, was obviously insufficient to realize the mentioned mechanism even considering the yield of the polymer. Therefore the presence of another mechanism of polymerization, which did not require great relative content of the oxidant, as for example in Reynolds' mechanism when chain polymerization proceeds with formation of poly(3-pyrroline) as an intermediate product,10 should be supposed. It should be highlighted that the total amount of the oxidant necessary to realize Reynolds' mechanism of PPy formation is the same as in the common cation-radical polymerization. Therefore we thought that at mechanochemical preparation of PPy the chain polymerization of pyrrole with formation of poly(3-pyrroline) involving no redox processes first took place. The formation of PPy proceeded at further mechanochemical treatment of the mixture of poly(3-pyrroline) and the oxidant:
6 and 0.9 S cm−1 in accord with our revision synthesis under the same conditions). It was obvious that the mechanochemical preparation of the polymer differed from the synthesis in the solution6 as its maximal yield and the highest conductivity of PPy were achieved at high values of the monomer/oxidant mole ratio. We thought that distinction was probably connected with different conditions at which polymerization was realized. It is considered in the literature6,10 that in solution PPy is formed as a result of addition polymerization of cation-radicals of pyrrole. The probability of reaction of the monomer with the oxidant is high in solution and is practically equal throughout the whole volume, which provides high concentration of cation-radicals of pyrrole and increases the probability of their polymerization by the mechanism of radical-radical bonding. To realize this, a relatively large amount of the oxidant is then needed – one molecule of ammonium persulfate per one molecule of pyrrole plus some quantity of the oxidant for doping of the forming macromolecules. In mechanochemical preparation of the polymer, the quantity of the oxidant, especially in the case of the PPy2.00 sample with maximal conductivity, was obviously insufficient to realize the mentioned mechanism even considering the yield of the polymer. Therefore the presence of another mechanism of polymerization, which did not require great relative content of the oxidant, as for example in Reynolds' mechanism when chain polymerization proceeds with formation of poly(3-pyrroline) as an intermediate product,10 should be supposed. It should be highlighted that the total amount of the oxidant necessary to realize Reynolds' mechanism of PPy formation is the same as in the common cation-radical polymerization. Therefore we thought that at mechanochemical preparation of PPy the chain polymerization of pyrrole with formation of poly(3-pyrroline) involving no redox processes first took place. The formation of PPy proceeded at further mechanochemical treatment of the mixture of poly(3-pyrroline) and the oxidant:
It was clear that in the case of PPy2.00 the quantity of the oxidant is insufficient for realization of the purely chemical mechanism of PPy formation via obvious redox processes and the reaction was mechanochemical in its nature, i.e. dehydrogenation of poly(3-pyrroline) was accomplished by the effect of both oxidant (ammonium persulfate) and mechanical forces. The data from NMR spectroscopy – the presence of the signal of the conjugated carbon atoms (∼130 ppm vs. TMS) and the absence of the signal corresponding to Cβ of the 3-pyrroline ring,8 which proved the formation of PPy structure, – as well as the presence of gaseous hydrogen in the grinding bowl, which was established using chromatographic analysis of the atmosphere in the grinding bowl after the end of the PPy2.00 preparation process (after mechanical treatment of the pure oxidant no hydrogen was detected), testified the reality of such a mechanism. It should be also added that we found no hydrogen in the grinding bowl after preparation of PPy0.75 sample. And the absence of chain polymerization in the case of the low monomer/oxidant mole ratio should be stated therefore. Besides, it should be also mentioned that in all cases there was ammonia in the atmosphere of the grinding bowl. Its appearance correlated with the presence of (NH4)H3(SO4)2 salt detected in the diffractogram of the as-prepared PPy samples (Fig. S1 in the ESI†).
Formation of PPy during the considered mechanochemical process was also confirmed by the data of cyclic voltammetry (Fig. 3). It followed from the obtained voltammograms that the potential of p-doping is practically independent from the composition of the initial reaction mixture. Interestingly, capacity of PPyr appeared to be linerly dependent from r−1 (Fig. 3) analogously to I1710/I1560 (Fig. 2). That meant the electrochemical capacity of PPyr directly depended on the number of carbonyl defects in the macromolecules in full agreement with ideas from ref. 11.
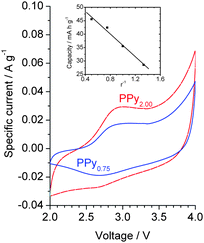 | ||
| Fig. 3 Cyclic voltammograms of PPy2.00 and PPy0.75 (inset: interrelation between electrochemical capacity of PPyr and composition of the initial reaction mixture). | ||
To elucidate the nature of the rather high conductivity achieved in PPyr characteristics such as average conjugation length in the macromolecules, the order of their package and doping degree should be considered. Comparative estimation of the conjugation length in PPyr could be done basing on the data of FTIR spectroscopy because, as shown in ref. 7, 12 and 13, the ratio of the integral intensities of the bands at about 1560 and 1480 cm−1 (I1560/I1480) is inversely related with the length of π-electron delocalization in the polymer macromolecules. It could be concluded on the basis of the data presented in Table 1 that the conjugation length in PPyr increased together with r. It was also interesting that the linear dependence between log σdc and I1560/I1480 for the prepared PPyr samples was in good agreement with the data obtained earlier in ref. 12 for PPy nanofibers, the conductivity of which had been registered at the level of 102 S cm−1 (Fig. 2b).
Additional information about the conjugation length was obtained on the basis of consideration of optical absorption spectra. As was seen in Fig. 4, in the spectra of PPyr at r ≤ 1.33 there were two broad bands with maximums about 450 and 1000 nm. In accord with9,14,15 the first band corresponded to electron transitions from the valence band to the antibonding levels of polarons and bipolarons and the band in the long-wave region – to the bonding levels. It followed from Fig. 3 that at increasing r there was a red shift of both bands that testified in favor of the increase of the conjugation length in the polymer at decrease of the initial relative content of the oxidant and corresponded to the conclusion made above during analysis of FTIR spectra.
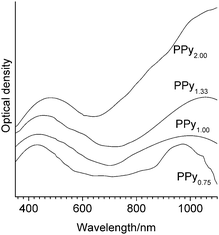 | ||
| Fig. 4 Electron absorption spectra of PPyr samples. | ||
Optical absorption spectrum of PPy2.00 differed from the spectra of the other polymer samples in the continuous growth of absorption within the measured spectral range (Fig. 4). That fact, as shown in ref. 9, 14 and 15, showed that the polymer prepared at low relative content of the oxidant in the initial reaction mixture (r = 2.00) was characterized by the presence of mobile bipolarons which could provide high levels of conductivity in accord with σdc values presented in Table 1.
It is known9 that in conducting polymers, optical conductivity (σopt) characterises the rate of charge transfer inside the chains and σdc the rate of more slow transitions between the chains. We calculated the value of σopt for PPyr samples based on optical absorption spectra presented in Fig. 4. The obtained data (Table 1) showed that as r increased, the value of σopt increased by ∼30 times whereas the increase of σdc for the considered range of r was ∼104. It can therefore be concluded9 that as r increases, the number of charge transfer transitions between the regions of electron delocalization decreases more rapidly than the change of the size of the intrachain conjugation regions. That difference could be an argument in favor of the assumption that one of the main reasons of the rise of σdc was not the increase of average conjugation length, which undoubtedly takes place, but rather the growth of spatial delocalization of charge carriers influenced by their number and mobility due to the redistribution of charge between polaron and bipolaron states. ESR data obtained by us confirmed such redistribution in favor of bipolarons, because the integral intensity of the ESR signal decreased as r increased, which testified to the relative decrease of the number of polarons (Fig. 5a).
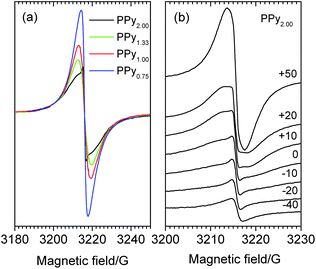 | ||
| Fig. 5 ESR spectra of PPyr (a) and temperature dependence of ESR signal for PPy2.00 (b). | ||
It also followed from Fig. 5a that the shape of the signal changed with r. Our numerical analysis showed that for all r the spectrum of the polymer could be fitted with sufficient degree of accuracy (the coefficient of determination R2 ≥ 0.9992) using one Gauss (G) and two Lorentz (L1 and L2) lines, which corresponded to the same value of g-factor g = 2.0024 (with accuracy of 0.0001) but possessed different widths (w) and intensities (A) (Table 2). It could be concluded based on the parameters from Table 2 that the contribution of the G line in the spectra was rather low and decreased with increasing r. The ESR signal with Gauss form in the conducting polymers was usually connected with localized electrons.16 Therefore it could be considered that their general amount in PPyr gradually decreased (by 3.7 times for the considered samples with limiting values of r) with a decrease in the relative content of the oxidant in the initial reaction mixture.
| AL1 | wL1 | AL2 | wL2 | AG | wG | |
|---|---|---|---|---|---|---|
| PPy0.75 | 72.1 | 7.38 | 21.0 | 3.23 | 1.94 | 1.53 |
| PPy2.00 | 76.3 | 9.12 | 4.63 | 2.41 | 0.521 | 1.24 |
The signal with Lorentz form was usually connected with delocalized charge carriers.16 In PPyr, this nature of L1 and L2 was confirmed17 by decrease of their width with increasing temperature (Fig. 5b). The presence of L1 and L2 with different widths and the same value of g-factor (Table 2) in ESR spectra of conducting polymers was observed earlier as well.18 In our case, L1 and L2 could probably be connected with charge carriers from amorphous and ordered regions of PPyr as the contribution of L2 in the spectrum of PPy2.00, in comparison with the spectrum of PPy0.75, is decreased by ∼3.5 times and just that difference determined the general decrease of ESR spectrum integral intensity (Fig. 5a). Besides, if L2 corresponds to charge carriers from the ordered regions of PPyr, then it must possess lower width due to mechanism of dynamic narrowing19 that is observed in accord with the data from Table 2. (It should be noted here that ESR experiments were conducted in air and therefore all signals were additionally broadened due to interaction with adsorbed oxygen).20
Higher conductivity of conducting polymers, as a rule, was connected with higher ordering of the macromolecule package in the polymer particles.21 Therefore, to elucidate the presence of such ordered regions we studied the mechanochemically prepared samples PPyr using X-ray diffraction and TEM. The obtained diffractograms are shown in Fig. 6. It followed from the figure that for all PPy samples there was a wide intense halo with a wide maximum of about 2θ = 21–26°. The form of the diffractograms showed21 that PPyr samples were generally amorphous. That state was characteristic of the considered type of the conducting polymer and the mentioned halo was usually considered15 as a superposition of several diffraction lines or halo: the first about 2θ = 21° (≈0.42 nm) and the second about 2θ = 26° (≈0.34 nm), the characteristic distance of 0.34 nm being the spacing between the closely packed pyrrole rings and 0.42 nm – between the pyrrole rings in the amorphous part of the polymer. It was interesting to note that the decomposition of the halo into the mentioned diffraction lines was observed only in the sample of PPy with very high conductivity above 100 S cm−1.21
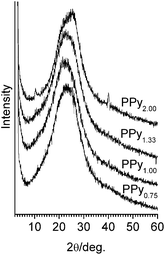 | ||
| Fig. 6 X-Ray diffraction patterns of PPyr. | ||
It also followed from Fig. 6 that the rather narrow reflexes of about 10.7° (0.82 nm) and 40.1° (0.22 nm) appeared in the diffractogram of PPy2.00. According to the literature, the first reflex could be stipulated by the ordered counter-ions7 and the second by (030) reflex of the monoclinic package of PPy chains.21 Low intensity of these reflexes showed most probably that the volume fraction of the structural features, which cause these reflexes, was not significant.
The data of TEM appended the data of X-ray diffraction. Really, it followed from Fig. 7 that, for example, the polymer with the highest conductivity PPy2.00 consisted of nanoparticles with sizes up to ∼100 nm, which possessed a core-shell structure, the material of the shell being amorphous and the core being formed by the more closely packed polymer macromolecules. In support of that the electron diffraction pattern of the shown agglomerate of the nanoparticles (inset in Fig. 7) contained the signals of both amorphous and quasi-crystalline polymer particles (the latter are marked by arrows in Fig. 7). The same core-shell structure of the polymer nanoparticles was also found by us for mechanochemically prepared highly conducting polyaniline samples.22
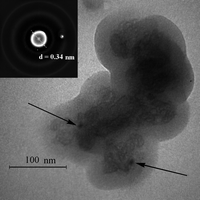 | ||
| Fig. 7 An electron micrograph of PPy2.00 nanoparticle and its electronogram (inset). | ||
In contrast to PPy2.00 all other samples are formed by aggregates of nanoparticles which possess amorphous structure (Fig. S2 in the ESI†).
Conclusions
The studies performed showed that the use of ammonium persulfate as an oxidant in mechanochemical preparation of PPy allowed conductivity above 5 S cm−1 to be achieved only at relatively low oxidant content in the initial reaction mixture.For formation of the highly conducting PPy at high monomer/oxidant mole ratio the chain mechanism with intermediate formation of poly(3-pyrroline) and its further mechanochemical dehydrogenation was proposed on the basis of the obtained experimental data. In accord with the presented results of structural studies, the prepared PPy samples were mainly amorphous and contained regions with the ordered packing of macromolecules. The conductivity of PPy was determined by mobile bipolarons accordingly to spectral characteristics.
Acknowledgements
We thank Prof. V. D. Pokhodenko and Prof. V. G. Koshechko for helpful discussions. This work was partially supported by the program “Nanostructured systems, nanomaterials, nanotechnologies” of the National Academy of Sciences of Ukraine.References
- L.-X. Wang, X.-G. Li and Y.-L. Yang, React. Funct. Polym., 2001, 47, 125–139 CrossRef CAS.
- B. N. Grgur, M. M. Gvozdenovi, J. Stevanovi, B. Z. Jugović and V. M. Marinović, Electrochim. Acta, 2008, 53, 4627–4632 CrossRef CAS.
- G. Wang, Q. Qu, B. Wang, Y. Shi, S. Tian and Y. Wu, ChemPhysChem, 2008, 9, 2299–2301 CrossRef CAS.
- S. Carquignya, J.-B. Sanchez, F. Berger, B. Lakard and F. Lallemand, Talanta, 2009, 78, 199–206 CrossRef CAS.
- J. H. Kim, K. T. Lau, R. Shepherd, Y. Wu, G. Wallace and D. Diamond, Sens. Actuators, A, 2008, 148, 239–244 CrossRef.
- N. V. Blinova, J. Stejskal, M. Trchová, J. Prokeš and M. Omastová, Eur. Polym. J., 2007, 43, 2331–2341 CrossRef CAS.
- P. M. Carrasco, H. J. Grande, M. Cortazar, J. M. Alberdi, J. Areizaga and J. A. Pomposo, Synth. Met., 2006, 156, 420–425 CrossRef CAS.
- O. Yu. Posudievsky, O. A. Goncharuk and V. D. Pokhodenko, Synth. Met., 2010, 160, 47–51 CrossRef CAS.
- J. Lei, Z. Cai and C. R. Martin, Synth. Met., 1992, 46, 53–69 CrossRef CAS.
- M. Goren, Z. Qi and R. B. Lennox, Chem. Mater., 2000, 12, 1222–1228 CrossRef CAS.
- P. Novák, B. Rasch and W. Vielstich, J. Electrochem. Soc., 1991, 138, 3300–3304 CAS.
- J. Lei, Z. Cai and C. R. Martin, Synth. Met., 1992, 46, 53–69 CrossRef CAS.
- V. P. Menon, J. Lei and C. R. Martin, Chem. Mater., 1996, 8, 2382–2390 CrossRef CAS.
- R. Čabala, J. Škarda and K. Potje-Kamloth, Phys. Chem. Chem. Phys., 2000, 2, 3283–3291 RSC.
- J. L. Brédas, J. C. Scott, K. Yakushi and G. B. Street, Phys. Rev. B: Condens. Matter, 1984, 30, 1023–1025 CrossRef CAS.
- H. H. S. Javadi, R. Laversanne, A. J. Epstein, R. K. Kohli, E. M. Scherr and A. G. MacDiarmid, Synth. Met., 1989, 29, E439–E444 CrossRef CAS.
- O. Chauvet, S. Paschen, M. N. Bussac and L. Zuppiroli, Europhys. Lett., 1994, 26, 619–624 CrossRef CAS.
- M. S. Sercheli, L. Walmsley, C. Rettori, A. A. Correa, L. O. S. Bulhões and E. C. Pereira, Phys. Status Solidi B, 2000, 220, 631–634 CrossRef CAS.
- B. H. Kim, S. H. Hong, J. Joo, I.-W. Park, A. J. Epstein, J. W. Kim and H. J. Choi, J. Appl. Phys., 2004, 95, 2697–2701 CrossRef CAS.
- M. Nechtschein, in Handbook of Conducting Polymers, ed. T. A Skotheim, R. L. Elsenbaumer and J. R. Reynolds, Marcel Dekker, New York, 1998, ch. 5, p. 156 Search PubMed.
- Y. Nogami, J.-P. Pouget and T. Ishiguro, Synth. Met., 1994, 63, 257–263 CrossRef.
- O. Yu. Posudievsky, O. A. Goncharuk, R. Barillé and V. D. Pokhodenko, Synth. Met., 2010, 160, 462–467 CrossRef CAS.
Footnote |
| † Electronic supplementary information (ESI) available: Fig. S1 and S2. See DOI: 10.1039/c0py00212g |
| This journal is © The Royal Society of Chemistry 2011 |

