Irreversible changes in protein conformation due to interaction with superparamagnetic iron oxide nanoparticles
Morteza
Mahmoudi
*a,
Mohammad A.
Shokrgozar
a,
Soroush
Sardari
b,
Mojgan K.
Moghadam
a,
Hojatollah
Vali
e,
Sophie
Laurent
c and
Pieter
Stroeve
d
aNational Cell Bank, Pasteur Institute of Iran, #69 Pasteur Ave., Tehran, 13164, Iran. E-mail: Mahmoudi@biospion.com; Web: www.biospion.com
bDepartment of Medical Biotechnology, Biotechnology Research Center, Pasteur Institute of Iran, #69 Pasteur Ave., Tehran, 13164, Iran
cDepartment of General, Organic, and Biomedical Chemistry, NMR and Molecular Imaging Laboratory, University of Mons, Avenue Maistriau, 19, B-7000, Mons, Belgium
dDepartment of Chemical Engineering and Materials Science, University of California Davis, Davis, USA
eDepartment of Anatomy and Cell Biology and Facility for Electron Microscopy Research, McGill University, Montréal, QC, Canada , H3A 2B2
First published on 5th January 2011
Abstract
The understanding of the interactions between nanomaterials and proteins is of extreme importance in medicine. In a biological fluid, proteins can adsorb and associate with nanoparticles, which can have significant impact on the biological behavior of the proteins and the nanoparticles. We report here on the interactions of iron saturated human transferrin protein with both bare and polyvinyl alcohol coated superparamagnetic iron oxide nanoparticles (SPIONs). The exposure of human transferrin to SPIONs results in the release of iron, which changes the main function of the protein, which is the transport of iron among cells. After removal of the magnetic nanoparticles, the original protein conformation is not recovered, indicating irreversible changes in transferrin conformation: from a compact to an open structure.
1 Introduction
Interest in nanoparticles arises from the fact that the mechanical, chemical, electrical, optical, magnetic, electro-optical and magneto-optical properties of these particles are different from their bulk properties and depend on particle size.1–6 There are numerous areas where nanoparticulate systems are of scientific and technological interest, specifically for biomedicine where the synthesis and biology come together (i.e. the nano-biointerface) and lead to an important concern for design of safe nano-biomaterials. A significant challenge for the safety of nanoparticles for biomedical use, such as diagnosis and therapeutics, is that human plasma proteins can be adsorbed on nanoparticles which can cause the transmittance of biological effects due to altered protein conformation.7–11 More specifically, identification of the adsorbed proteins and evaluation of their lifetime on the surface of nanoparticles are very important and can affect protein–nanoparticle interactions.12–14 The conformational changes of the proteins can modify their functions, which are recognized as the molecular mechanisms of injury, and could contribute to disease pathogenesis.13,15–18Lynch et al.19 hypothesized that the function and fate of nanoparticles in biological environments are not only related to the nanoparticle in itself, but also related to its surface protein corona, with various binding affinities. It has been well-recognized that the protein corona covers the surface of nanoparticles upon their entrance into the bloodstream.7,11 The protein modified surface of the nanoparticles is recognised by living cells, and is a key phenomenon that scientists need to understand.15,19
The biological responses to nanoparticles are highly affected by the resultant of main forces at the nano-biointerface (e.g., hydrodynamic, electrodynamic, electrostatic, solvent, steric, and polymer bridging) but also by the characteristics of the nanoparticles (size, shape, charge, crystallinity, electronic states, surface wrapping in the biological medium, hydrophobicity and wettability).15,20–22 Therefore, a better understanding of the nanoparticle–protein complex is essential in order to develop functional as well as safe nanoparticles.
Among various types of nanoparticles which are used for biomedical applications, superparamagnetic iron oxide nanoparticles (SPIONs) have received increased attention due to their biocompatibility, superparamagnetic properties, controllable shape and size and scale-up capability.23–25 These attractive features together with the nontoxic nature of SPIONs make magnetic nanoparticles ideal platforms for nanomedical applications, for example, as FDA approved contrast agents for MRI. Hence, SPIONs have widespread usage in various biomedical applications such as transfection, drug delivery, magnetic resonance imaging, cell/biomolecules separation and hyperthermia.9,25,26
In this work we focus on the interaction of SPIONs with a common plasma protein: iron saturated human transferrin protein. To the best of our knowledge, this is the first report on conformational changes of a specific protein due to the interaction with SPIONs.
Transferrin, with a molecular weight of 75–80 kDa depending on the species, is a protein which is found in the blood of all vertebrate species.27 Transferrin contains two iron binding sites which appear to be equal and independent in their iron binding mode. As iron is bound to these sites, bicarbonate is bound to an anion binding site in close proximity to each of the iron binding sites, causing a red complex with an absorption at 465 nm.28Centrifugation has been used as the favoured method in order to separate the nanoparticles from the protein suspensions which can affect the outcome by the duration of washing and the amount of solution volumes used in these steps.7 However, the main problem of the centrifugation technique is the loss of the proteins which are adsorbed to the nanoparticle surface with weak binding.7,29 The distinguished feature of SPIONs is their superparamagnetic properties which enable us to separate them without centrifugation, using external magnetic field gradients; hence, more reliable results may be obtained.
The curvature of the nanoparticles surface can have a significant influence on the adsorption of biomolecules which can cause various conformational changes in protein structure adsorbed to flat surfaces of the same material.14,29,30 To track the effect of various sizes on the transferrin conformational changes, both bare and polyvinyl alcohol (PVA) coated SPIONs, with 2 different particle sizes, were synthesized via an optimized co-precipitation method and characterized with TEM, XRD and VSM methods. In order to characterize the protein–SPIONs interactions, different techniques including circular dichroism (CD) spectro-polarimeter, fluorescence and UV/vis spectroscopy, and gel electrophoresis are employed.
2 Materials and methods
2.1 Materials
Analytical grade of iron salts (i.e.iron chloride) and sodium hydroxide (NaOH) were purchased from Merck Inc. (Darmstadt, Germany) and were employed without further purification. Polyvinyl alcohol (PVA) of 30![[thin space (1/6-em)]](https://www.rsc.org/images/entities/char_2009.gif) 000–40
000–40![[thin space (1/6-em)]](https://www.rsc.org/images/entities/char_2009.gif) 000 g mole−1 nominal molecular weight and 86–89% degree of hydrolysis was supplied by Fluka (Ronkonkoma, USA), respectively. Iron saturated human transferrin (purity of greater than 99%) with molecular weight of 77 kDa and a size of about 6 nm was prepared from Scipac (Kent, UK). The human transferrin was prepared from the human serum (fully tested and certified negative for HIV I and II antibodies, Hepatitis B surface antigen, and Hepatitis C antibodies). Other solvents were reagent grades and used without any further purification.
000 g mole−1 nominal molecular weight and 86–89% degree of hydrolysis was supplied by Fluka (Ronkonkoma, USA), respectively. Iron saturated human transferrin (purity of greater than 99%) with molecular weight of 77 kDa and a size of about 6 nm was prepared from Scipac (Kent, UK). The human transferrin was prepared from the human serum (fully tested and certified negative for HIV I and II antibodies, Hepatitis B surface antigen, and Hepatitis C antibodies). Other solvents were reagent grades and used without any further purification.
2.2 Synthesis of bare and coated SPIONs
After 20 minutes bubbling with neutral gas (i.e.argon), de-oxygenated solutions were achieved using the de-ionized (DI) water. The iron salts (i.e.FeCl3 and FeCl2) were dissolved in de-oxygenated DI water (1 M HCl), respectively. The iron solutions were mixed by adjusting to a molar fraction of 2 (Fe3+/Fe2+) for all samples. The nanoparticles were formed by drop wise addition of a predetermined mixture of iron salts to the base medium (NaOH) under an argon atmosphere. In order to achieve high monodisperse nanoparticles (decrease the mass transfer phenomena, which may allow nanoparticles to combine and build larger polycrystalline nanoparticles), the reactor was transferred to an ultrasonic bath (100 Watt) for creating a turbulent flow.31 From data obtained by optimal uniform design,31 two sets of samples with narrow size distributions were synthesized by variation of the base molarities and the homogenization rates. For both sets, the base molarities were adjusted to 1.2 whereas the homogenization rates were fixed at 10![[thin space (1/6-em)]](https://www.rsc.org/images/entities/char_2009.gif) 800 rpm (batch 1) and 3600 rpm (batch 2) to achieve magnetic nanoparticles with two different sizes. After 30 min, the solutions were placed in a strong magnetic field gradient produced by a permanent Nd–Fe–B magnet (with cylindrical shape, diameter of 4 cm and height of 3 cm) and the SPIONs were collected. The supernatant was completely removed and the nanoparticles were re-dispersed in DI water several times. The permanent magnet was made of neodymium–iron–boron which exhibits superior magnetic properties.32,33 The PVA solutions, with a polymer/iron mass ratio of 3, were added slowly to the colloidal dispersion of SPIONs (for both batches) by syringe (about 100 µl per drop) and kept stirred for another 1 h in order to coat the surface of the SPIONs. Single coated nanoparticles (no aggregation) can be achieved by adjusting the polymer/iron mass ratio.34,35 The coated nanoparticles were collected by the magnet and re-dispersed in DI water. The washing procedure was repeated several times. Finally, the obtained ferrofluid was kept at 4 °C for protein-interaction experiments.
800 rpm (batch 1) and 3600 rpm (batch 2) to achieve magnetic nanoparticles with two different sizes. After 30 min, the solutions were placed in a strong magnetic field gradient produced by a permanent Nd–Fe–B magnet (with cylindrical shape, diameter of 4 cm and height of 3 cm) and the SPIONs were collected. The supernatant was completely removed and the nanoparticles were re-dispersed in DI water several times. The permanent magnet was made of neodymium–iron–boron which exhibits superior magnetic properties.32,33 The PVA solutions, with a polymer/iron mass ratio of 3, were added slowly to the colloidal dispersion of SPIONs (for both batches) by syringe (about 100 µl per drop) and kept stirred for another 1 h in order to coat the surface of the SPIONs. Single coated nanoparticles (no aggregation) can be achieved by adjusting the polymer/iron mass ratio.34,35 The coated nanoparticles were collected by the magnet and re-dispersed in DI water. The washing procedure was repeated several times. Finally, the obtained ferrofluid was kept at 4 °C for protein-interaction experiments.
2.3 Interaction of SPIONs with protein
SPIONs were incubated with the iron saturated human transferrin protein for a period of 2 h at a temperature of 5 °C. The medium (30 times diluted with phosphate buffered saline (PBS); PBS was prepared according to the common preparation method36 with a pH of 7.4) containing transferrin was incubated with the nanoparticles, with the protein solution to nanoparticle surface ratio fixed at 2.8 ml m−2 of SPIONs surface, in order to achieve a similar protein to nanoparticle surface ratio.30 After the interaction time, the proteins with SPIONs were run through a strong magnetic field using a magnetic-activated cell sorting (MACS®), in order to trap the SPIONs in the magnetic column. Consequently, the flow-through fraction was collected and the trapped nanoparticles were washed with the 1 M KCl solution. The experimental setup is summarized in Fig. 1. The collected solutions, containing the interacted proteins, were analyzed by circular dichroism spectroscopy and SDS-PAGE (sodium dodecyl sulfate-polyacrylamide gel electrophoresis). Finally, the same procedure was employed for high concentrations (10 and 100 times) of SPIONs relative to the protein (i.e. by reducing the protein to nanoparticle surface ratio).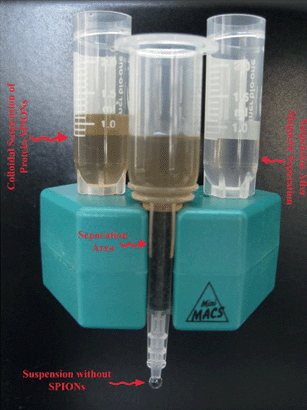 | ||
| Fig. 1 Experimental setup for purification. The MACS® columns are composed of a spherical steel matrix; by inserting a column in a MACS Separator, a high-gradient magnetic field is induced within the column which retains the SPIONs. | ||
Nanoparticles were characterized as follows. After placing and drying a drop of the colloidal suspension of SPIONs on a copper grid, the size and shape of the magnetic nanoparticles were evaluated with a Phillips CM200 transmission electron microscope (TEM) equipped with an AMT 2 × 2 CCD camera at an accelerating voltage of 200 kV. Phase characterizations of the SPIONs were accomplished using XRD (Siemens, D5000, Germany) with Cu Kα radiation and the Scherrer method was employed for defining the average crystallite size of SPIONs. XRD samples were prepared by drying the nanoparticles in a vacuum oven at 40 °C for 12 h after magnetic separation. The magnetizations of the nanoparticles were measured in a vibrating sample magnetometer (VSM) with a sensitivity of 10−6 J T−1emu−1 and a magnetic field up to 800 kA m−1. The mean size of nanoparticles was determined by dynamic light scattering (DLS; Zetasizer model ZEN 1600, nano laser 633 nm). The removals of SPIONs from the solution were done by using magnetic columns (MACS; A Mini MACS® Separation Unit, Miltenyi Biotec Inc, Germany).
The CD-spectra of the human transferrin with a concentration of 0.5 mg ml−1 were obtained at room temperature using a Jasco J-810 spectro-polarimeter (Tokyo, Japan). The far-UV spectra were recorded using a step size of 2 nm and a bandwidth of 1.5 nm. The spectra were recorded in a cell with a path length of 1 mm; the cell path length for far-UV spectra of 190–250 nm. The spectra were corrected for buffer contributions. The fluorescence spectra were recorded on a LS55 Fluorescence spectrometer (PerkinElmer, Belgium).
The denaturing polyacrylamide gel electrophoresis (SDS-PAGE) was performed following the procedure reported previously.37
3 Results and discussion
3.1 Bare and coated SPIONs
Fig. 2a–h show the characteristics for the SPIONs using TEM, XRD, and VSM techniques. TEM results (Fig. 2a and b (for batch 1), Fig. 2d and e (for batch 2)) confirm the formation of magnetite nanoparticles with spherical-shape and a narrow size distribution. Agglomeration is detectable in the bare nanoparticles (Fig. 2a and d) whereas for coated particles single coated nanoparticles are achieved. According to the TEM results, the size of nanoparticles is increased in the lower stirring rate. The colloidal stability of PVA coated SPIONs is higher than the stability of the bare particles because the former show steric stabilization. From the VSM curves (Fig. 2c and f), it can be concluded that both bare and coated nanoparticles have superparamagnetic properties with different magnetic saturations. The small difference is caused by the adsorbed layer of polymers which reduces the magnetic active mass of the particle to the total mass of the coated SPIONs. What is interesting is the difference of the magnetic saturation with increasing particle size. It has been recognized that the magnetic saturation of SPIONs increases when the size of the magnetite crystallite increases, which is attributed to the increase of the ratio of the magnetic active mass to the total volume of SPIONs.38,39 The coating can not only cause a decline in exchange penetration as well as dipolar interactions but also cause the existence of a lower amount of iron (because magnetite is replaced by the non-magnetic polymer) together with creating magneto-crystalline anisotropy.40Fig. 2g and h illustrate the XRD spectra for all samples, which are matched well with magnetite (Fe3O4, reference JCPDS no. 82-1533), The full width at half maximum (FWHM) of the main reflection of magnetite (i.e. (311)) was employed, according to the Scherrer method, to determine the average crystallite size of the achieved nanoparticles (Table 1). In addition, the descriptions of sample abbreviations are presented in Table 2.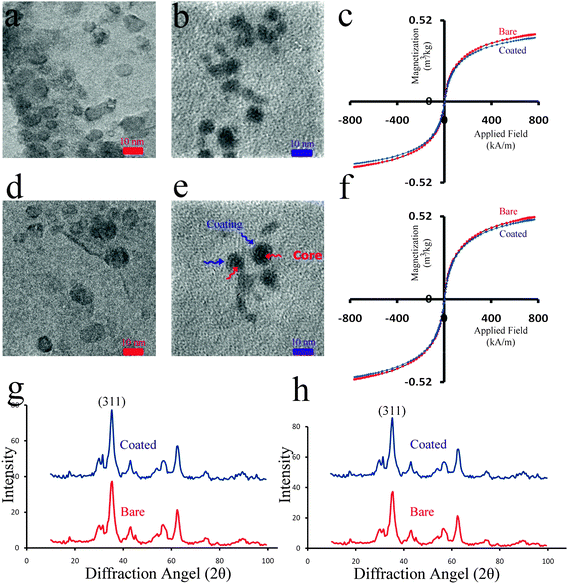 | ||
Fig. 2 (a and b) TEM images of batch 1 (homogenization rate of 10![[thin space (1/6-em)]](https://www.rsc.org/images/entities/char_2009.gif) 800 rpm) for bare and coated SPIONs, respectively and (c) their corresponding VSM curves; (d and e) TEM images of batch 2 (homogenization rate of 3600 rpm) for bare and coated SPIONs, respectively and (f) their corresponding VSM curves; (g and h) XRD patterns of both batches for bare and coated SPIONs. 800 rpm) for bare and coated SPIONs, respectively and (c) their corresponding VSM curves; (d and e) TEM images of batch 2 (homogenization rate of 3600 rpm) for bare and coated SPIONs, respectively and (f) their corresponding VSM curves; (g and h) XRD patterns of both batches for bare and coated SPIONs. | ||
| Batch | Bare/coated | Sample name | Average TEM size/nm | Average XRD size/nm | Average thickness of adsorbed protein measured by TEM size/nm |
|---|---|---|---|---|---|
| a Obtained from an average of twenty separate TEM measurements of single transferrin coated nanoparticles; numbers given with the standard deviation. | |||||
1 (homogenization rate: 10![[thin space (1/6-em)]](https://www.rsc.org/images/entities/char_2009.gif) 800 rpm) 800 rpm) |
Bare | 1B | 5 | 3.6 | 1.6 ± 0.2a |
| Coated | 1C | 8 | 3.5 | 3.8 ± 0.7a | |
| 2 (homogenization rate: 3600 rpm) | Bare | 2B | 8 | 5.3 | 4 ± 1a |
| Coated | 2C | 10 | 5.3 | 4.4 ± 0.6a |
| Sample | Description |
|---|---|
| B | Bare nanoparticles |
| C | PVA-Coated nanoparticles |
| BP | Protein interacted with bare nanoparticles |
| CP | Protein interacted with PVA-coated nanoparticles |
| BP-Mag | Extract of the interacted proteins with bare nanoparticles using MACS |
| CP-Mag | Extract of the interacted proteins with PVA-coated nanoparticles using MACS |
| BP-KCl | Washing of the trapped bare nanoparticles in MACS with 1 M KCl solution |
| CP-KCl | Washing of the trapped PVA-coated nanoparticles in MACS with 1 M KCl solution |
| N-BP | Extract of the bare nanoparticles from the MACS after washing |
| N-CP | Extract of the PVA-coated nanoparticles from the MACS after washing |
| BP-10 | Using bare nanoparticles with 10 times concentration (protein amount is constant) |
| CP-10 | Using PVA-coated nanoparticles with 10 times concentration (protein amount is constant) |
| BP-100 | Using bare nanoparticles with 100 times concentration (protein amount is constant) |
| CP-100 | Using PVA-coated nanoparticles with 100 times concentration (protein amount is constant) |
3.2 TEM investigation and SDS-PAGE gel electrophoresis
The SDS-PAGE is employed, following the protocol,37 in order to track significant chain breaking in human transferrin due to the interaction with the nanoparticles. The role of SDS is the disruption of hydrophobic areas of the protein structure and coating the proteins with negative charges, causing the formation of linearized protein. The variation of protein conformations cannot interfere with the chain breaking. To give qualitative support for the broader conclusions, the TEM data for all particles before and after interaction with human transferrin are compared (Fig. 2a, b, d, e and 3). Since particle agglomeration occurs, after protein adsorption on the surface of nanoparticles,14 the polydispersity of SPIONs in size and the protein conformation need to be interpreted carefully. For this purpose, the TEM investigations of single SPIONs–transferrin complexes are used to compute the thickness of the protein which is adsorbed to the surface of SPIONs according to a simple core–shell model (see Fig. 3 and Table 1). The selected images (Fig. 3) illustrate clear evidence of a thin transferrin-derived layer around the SPIONs following incubation with human transferrin protein. These adsorbed layers completely coat the particles and also coat the particles involved in larger aggregates (see Fig. 3e and f).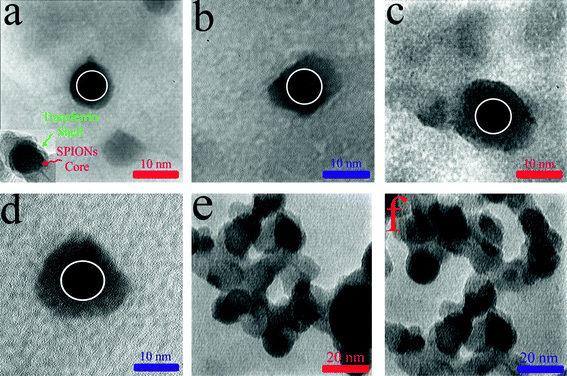 | ||
| Fig. 3 (a and b) TEM images of transferrin corona coated SPIONs (batch 1) for bare and PVA-coated samples, respectively. Inset at the bottom left is the TEM image of a single protein-coated SPIONs showing lower density of the protein shell; (c and d) TEM images of transferrin corona coated SPIONs (batch 2) for bare and PVA-coated samples, respectively. The white circles are drawn as a guide for the eyes as a representation of the size of nanoparticles before protein adsorption; (e and f) TEM images of protein-coated SPIONs (bare and PVA-coated of batch 1) showing the agglomeration of these particles. | ||
In order to define the polydispersity of the thickness of protein coating on the surface of SPIONs, statistics are applied.41
According to Fig. 3 and Table 1, the shape and thickness of adsorbed transferrin to the surface of SPIONs are significantly related to their surface curvature and modifications (i.e. bare or PVA-coated). The obtained results are in good agreement with the thickness of the human serum albumin on ultra-small (10–20 nm in diameter) polymer-coated FePt and CdSe/ZnS nanoparticles.18 Using fluorescence correlation spectroscopy together with the assumption of Stokes–Einstein diffusion, it was found that the increase in the nanoparticle size after the binding of albumin is consistent with the saturation binding of a monolayer with a thickness of 3.3 nm.18
The protein-interacted SPIONs were fixed in MACS beads; consequently, the flow-through solution obtained from the fixed SPIONs, and the washing of the fixed SPIONs with 1M KCl solution, are collected and analysed by SDS-PAGE. Human transferrin shows a tight cluster of bands corresponding to the transferrin molecular weight of 77 kDa (Fig. 4). According to Fig. 4, there is no detectable protein breaking due to the interaction with the magnetic nanoparticles. Probing the bands in 1 M KCl solutions reveals the attachment tendency of human transferrin to both bare and coated SPIONs in the two batches. After washing with KCl solution, the fixed SPIONs are collected by removing the column from the high magnetic field and then are analysed with gel electrophoresis. A trace of protein attachment to N-1BP sample is detected even after washing with KCl solution, whereas there is no detectable band in other nanoparticles, confirming the strong interaction between human transferrin and smaller bare SPIONs (diameter of 5 nm). The attachment of human transferrin to the SPIONs is highly dependent on both the size and the surface coating of the magnetic nanoparticles which is confirmed by the DLS results (Table 3). The change of the size of the SPIONs is not only related to the adsorption of the transferrin but also can be explained by the agglomeration of the protein coated SPIONs. More specifically, from the DLS data, it is observed that the effective “size” of the nanoparticles increases dramatically as they become coated with the protein and then begin to aggregate due to the presence of this coating. The nanoparticle clustering is directly apparent in TEM images of SPIONs after exposure to the human transferrin (Fig. 3e and f). Similar results have been obtained for gold nanoparticles after absorbance of common human blood proteins such as albumin, fibrinogen, γ-globulin, histone, and insulin.42
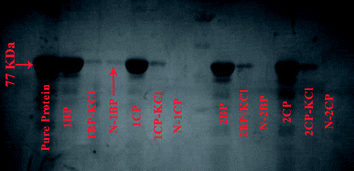 | ||
| Fig. 4 SDS-PAGE for human transferrin and various separation solutions. | ||
| Batches | Sample name | Average hydrodynamic size/nm | Sample name | Average hydrodynamic size/nm | Sample name | Average hydrodynamic size/nm |
|---|---|---|---|---|---|---|
| a Obtained from an average of five separate DLS measurements where the uncertainty represents standard deviation. | ||||||
| 1B | 1B | 8.2 | 1B-10 | 8.2 | 1B-100 | 8.2 |
| 1BP | 85.1 ± 12.6a | 1BP-10 | 53.1 ± 10.3a | 1BP-100 | 31.2 ± 1.2a | |
| N-1BP | 25.3 ± 4.2a | N-1BP-10 | 42.3 ± 7.1a | N-1BP-100 | 27.5 ± 3.6a | |
| 1C | 1C | 12.6 | 1C-10 | 12.6 | 1C-100 | 12.6 |
| 1CP | 71.2 ± 11a | 1CP-10 | 58.2 ± 10.1a | 1CP-100 | 48.3 ± 8.9a | |
| N-1CP | 16.3 ± 3.1a | N-1CP-10 | 37.1 ± 4.3a | N-1CP-100 | 41.3 ± 6.5a | |
| 2B | 2B | 12.1 | 2B-10 | 12.1 | 2B-100 | 12.1 |
| 2BP | 82.3 ± 15.4a | 2BP-10 | 57.5 ± 13.1a | 2BP-100 | 36.2 ± 5.9a | |
| N-2BP | 18 ± 2.2a | N-2BP-10 | 39.4 ± 4.7a | N-2BP-100 | 31.6 ± 3.9a | |
| 2C | 2C | 15.3 | 2C-10 | 15.3 | 2C-100 | 15.3 |
| 2CP | 72 ± 18.2a | 2CP-10 | 63.6 ± 11.1a | 2CP-100 | 48.7 ± 10.4a | |
| N-2CP | 21.7 ± 3.2a | N-2CP-10 | 35.2 ± 4.5a | N-2CP-100 | 39.4 ± 8.3a |
3.3 CD spectra and UV/vis spectroscopy
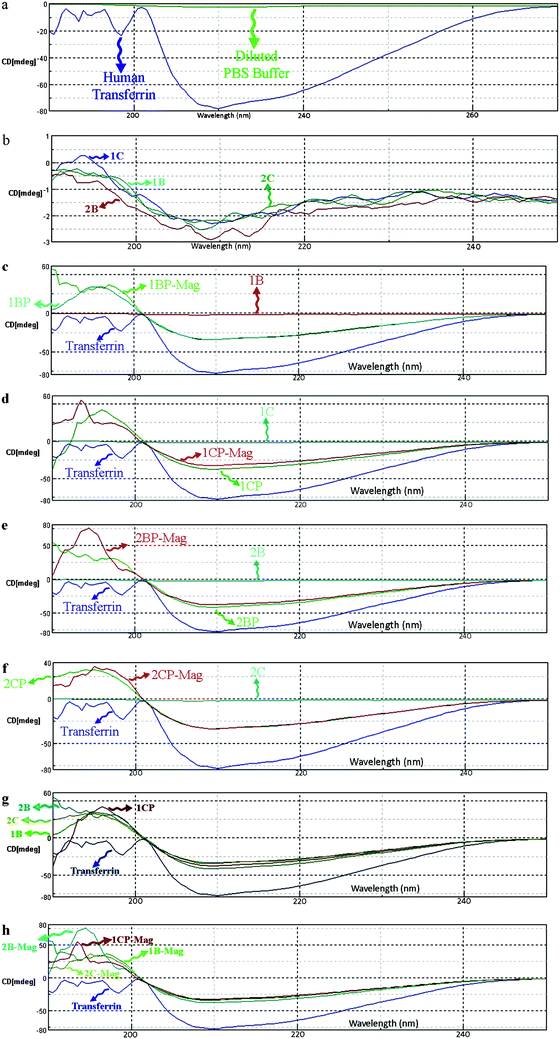 | ||
| Fig. 5 CD spectra of (a) pure human transferrin (iron saturated) and buffer medium; (b) various magnetic nanoparticles CD spectra of pure human transferrin, SPIONs, suspension of transferrin and SPIONs nanoparticles, and pure treated transferrin after MACS magnetic separation for (c) 1B, (d) 1C, (e) 2B, and (f) 2C samples; comparison of CD spectra of (g) suspensions containing transferrin and SPIONs nanoparticles, and (h) suspensions after MACS magnetic separation. | ||
The CD spectra show that by introducing SPIONs to transferrin solution (Fig. 5c–h), the conformation of the iron saturated protein is changed. The significant decline in peak intensity at the wavelength of around 210 nm for the interacted proteins confirms the opening of the compact transferrin conformation. After removing the magnetic nanoparticles using the MACS system, the original conformation of the proteins is not recovered, showing the irreversible changes in transferrin conformation after interaction with the SPIONs (Fig. 5h).
These results are also confirmed by the fluorescence studies. The fluorescence spectra of the protein alone and of the protein after interactions with SPIONs were compared (Fig. 6). A shift for the λmax of the emission (340 nm for the ZZ protein alone and 310 nm for the protein after interaction with the SPIONs) was observed. This difference clearly indicates a conformational change of the protein.
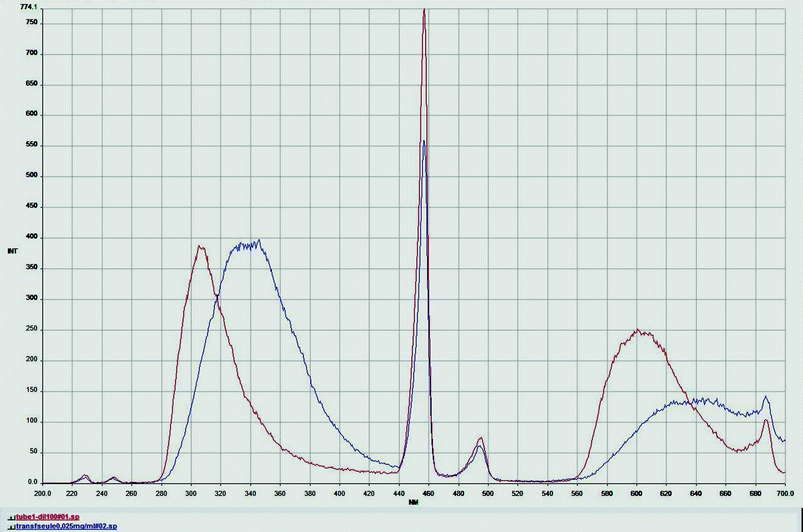 | ||
| Fig. 6 Comparison of fluorescence spectra of pure human transferrin solution (25 µg ml−1, blue curve) and of pure treated transferrin after MACS magnetic separation (red curve). | ||
The UV/vis spectroscopy of the pure transferrin and SPIONs-treated pure transferrin after removing SPIONs are illustrated in Fig. 7a and b. The characteristic peak at the wavelength of 465 nm is due to the iron-bearing lobes of iron saturated transferrin. Therefore, the release of iron from the two tyrosine ligands causes a decline in the peak.49,50 According to the CD curves, the exposure of iron saturated human transferrin to SPIONs results in the release of iron, and more specifically, it changes the compact conformation to the open conformation of the iron-free lobe. Furthermore, the decline in the characteristic peak of the transferrin (at 465 nm) is dependent on the size and surface properties of SPIONs. For instance, the most significant protein conformational changes are obtained by its interaction with the bare nanoparticles (i.e. 1B). The PVA-coated nanoparticles cause less conformation changes in transferrin, probably due to its lower surface energy in comparison to the bare magnetic nanoparticles; the same effects of the size of SPIONs are detected in coated nanoparticles.
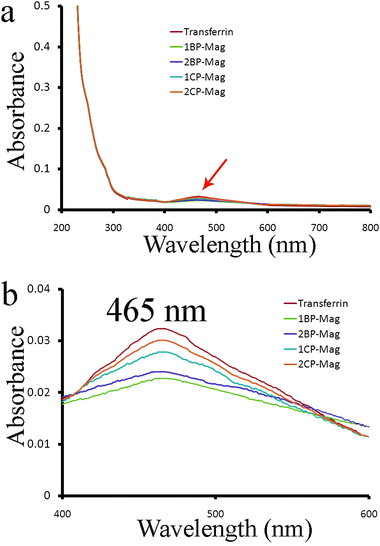 | ||
| Fig. 7 (a) UV/vis spectroscopy showing the absorbance changes associated with iron release for the SPIONs-treated transferrin due to their conformation changes and (b) showing the peaks of (a) in the 400–600 nm range. | ||
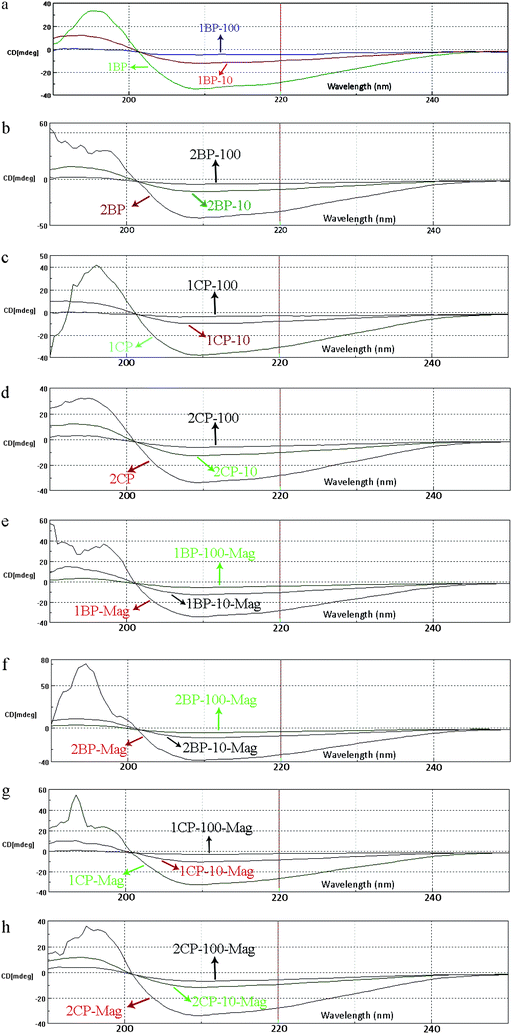 | ||
| Fig. 8 CD spectra of protein–nanoparticle solution with various SPIONs concentrations for (a) 1B, (b) 2B, (c) 1C and, (d) 2C samples; CD spectra of pure treated protein after removal of SPIONs (with various concentrations) by MACS for (e) 1B, (f) 2B, (g) 1C and (h) 2C samples. | ||
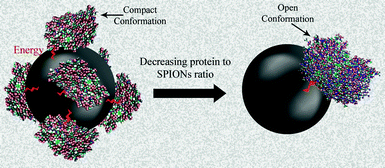 | ||
| Fig. 9 Schematic representation of the decreasing protein effect to SPIONs surface ratio on the conformation changes in human transferrin. | ||
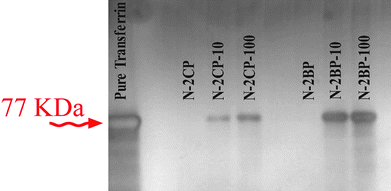 | ||
| Fig. 10 SDS-PAGE for human transferrin and remained proteins on the surface of trapped bare- and coated-SPIONs (with various concentrations). | ||
UV/vis results (Fig. 11a–d) confirm the enhancement of the iron release from the transferrin molecules due to its conformation changes by increasing the SPIONs concentration (decreasing the protein to SPIONs surface ratio), which fully agrees with our schematic hypothesis (Fig. 9). In addition, there is no peak for the lowest applied ratio, for all samples, showing the almost complete transition of iron saturated human transferrin from the closed conformation to the open jaw conformation. The iron release from the coated SPIONs is lower than the bare SPIONs for the higher protein to SPIONs surface ratio; however there are no differences for the lowest ratio.
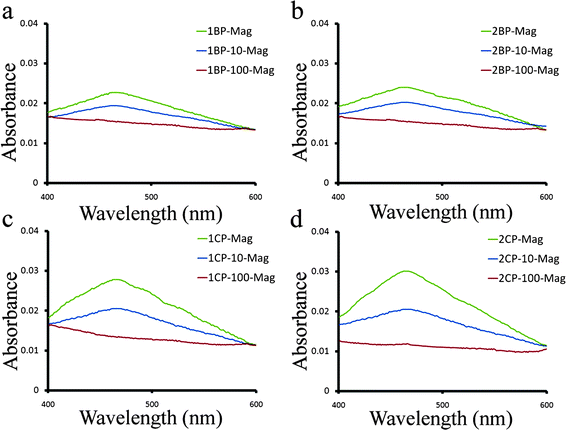 | ||
| Fig. 11 UV/vis results of pure treated protein after removal of SPIONs (with various concentrations) by MACS for (a) 1B, (b) 2B, (c) 1C and (d) 2C samples. | ||
4 Conclusion
Both bare and PVA coated SPIONs, with 2 different particle sizes, were synthesized via optimized co-precipitation method and characterized with TEM, XRD and VSM methods. The SPIONs were incubated with iron saturated human transferrin protein. After incubation, the mixture was run through a column placed in a strong magnetic field and was washed with KCl solution to elute the protein. The solutions containing the proteins which interacted with the SPIONs were analyzed by fluorescence and UV/vis spectroscopy, SDS-PAGE gel electrophoresis and circular dichroism. Our results show that the conformation of the iron saturated transferrin is changed due to the interaction with SPIONs. The conformation of the pure protein is not recovered, indicating irreversible changes in transferrin conformation after this interaction. The human transferrin conformational change from a compact structure to a more open jaw structure is due to the loss of iron. This is the first published report on the irreversible conformational changes of a specific protein due to the interaction with SPIONs.References
- M. Nirmal and L. Brus, Luminescence photophysics in semiconductor nanocrystals, Acc. Chem. Res., 1999, 32, 407–414 CrossRef CAS.
- A. P. Alivisatos, Semiconductor clusters, nanocrystals, and quantum dots, Science, 1996, 271, 933–937 CrossRef CAS.
- W. C. W. Chan and S. Nie, Quantum dot bioconjugates for ultrasensitive nonisotopic detection, Science, 1998, 281, 2016–2018 CrossRef CAS.
- Y. Weng, Nonlinear optical properties of nanometer-sized semiconductor clusters, Acc. Chem. Res., 1991, 24, 133–139 CrossRef CAS.
- M. L. Steigerwald and L. E. Brus, Semiconductor crystallites: a class of large molecules, Acc. Chem. Res., 1990, 23, 183–188 CrossRef CAS.
- D. Alloyeau, et al. Size and shape effects on the order–disorder phase transition in CoPt nanoparticles, Nat. Mater., 2009, 8, 940–946 CrossRef CAS.
- T. Cedervall, et al. Understanding the nanoparticle–protein corona using methods to quantify exchange rates and affinities of proteins for nanoparticles, Proc. Natl. Acad. Sci. U. S. A., 2007, 104, 2050–2055 CrossRef CAS.
- I. Lynch, et al. The nanoparticle–protein complex as a biological entity; a complex fluids and surface science challenge for the 21st century, Adv. Colloid Interface Sci., 2007, 134–135, 167–174 CrossRef CAS.
- M. Mahmoudi, et al. A new approach for the in vitro identification of the cytotoxicity of superparamagnetic iron oxide nanoparticles, Colloids Surf., B, 2010, 75, 300–309 CrossRef CAS.
- M. Mahmoudi, A. Simchi and M. Imani, Cytotoxicity of uncoated and polyvinyl alcohol coated superparamagnetic iron oxide nanoparticles, J. Phys. Chem. C, 2009, 113, 9573–9580, DOI:10.1021/jp9001516.
- T. Cedervall, et al. Detailed identification of plasma proteins adsorbed on copolymer nanoparticles, Angew. Chem., Int. Ed., 2007, 46, 5754–5756 CrossRef CAS.
- I. lynch, A. Salvati and K. A. Dawson, Protein–nanoparticle interactions: what does the cell see?, Nat. Nanotechnol., 2009, 4, 546–547 CrossRef CAS.
- K. A. Dawson, A. Salvati and I. Lynch, Nanotoxicology: nanoparticles reconstruct lipids, Nat. Nanotechnol., 2009, 4, 84–85 CrossRef CAS.
- D. Walczyk, F. B. Bombelli, M. P. Monopoli, I. Lynch and K. A. Dawson, What the cell “sees” in bionanoscience, J. Am. Chem. Soc., 2010, 132, 5761–5768 CrossRef CAS.
- A. E. Nel, et al. Understanding biophysicochemical interactions at the nano–bio interface, Nat. Mater., 2009, 8, 543–557 CrossRef CAS.
- M. S. Ehrenberg, A. E. Friedman, J. N. Finkelstein, G. Oberdörster and J. L. McGrath, The influence of protein adsorption on nanoparticle association with cultured endothelial cells, Biomaterials, 2009, 30, 603–610 CrossRef CAS.
- T. A. Faunce, J. White and K. I. Matthaei, Integrated research into the nanoparticle-protein corona: a new focus for safe, sustainable and equitable development of nanomedicines, Nanomedicine, 2008, 3, 859–866 CrossRef CAS.
- C. Röcker, M. Pötzl, F. Zhang, W. J. Parak and G. U. Nienhaus, A quantitative fluorescence study of protein monolayer formation on colloidal nanoparticles, Nat. Nanotechnol., 2009, 49, 577–580 CrossRef.
- I. Lynch, K. A. Dawson and S. Linse, Detecting cryptic epitopes created by nanoparticles, Science, 2006, 327, 14.
- A. Nel, T. Xia, L. Madler and N. Li, Toxic potential of materials at the nanolevel, Science, 2006, 311, 622–627 CrossRef CAS.
- D. B. Warheit, T. R. Webb, C. M. Sayes, V. L. Colvin and K. L. Reed, Pulmonary instillation studies with nanoscale TiO2 rods and dots in rats: toxicity is not dependent upon particle size and surface Area, Toxicol. Sci., 2006, 91, 227–236 CrossRef CAS.
- V. L. Colvin, The potential environmental impact of engineered nanomaterials, Nat. Biotechnol., 2003, 21, 1166–1170 CrossRef CAS.
- M. Mahmoudi, et al. MRI tracking of stem cells in vivo using iron oxide nanoparticles asa tool for the advancement of clinical regenerative medicine, Chem. Rev., 2010 DOI:10.1021/cr1001832.
- M. Mahmoudi, A. S. Milani and P. Stroeve, Surface architecture of superparamagnetic iron oxide nanoparticles for application in drug delivery and their biological response: a review, International Journal of Biomedical Nanoscience and Nanotechnology, 2010, 1(2/3/4), 164–201 Search PubMed.
- M. Mahmoudi, S. Sant, B. Wang, S. Laurent and T. Sen, Superparamagnetic iron oxide nanoparticles (SPIONs): development, surface modification and applications in chemotherapy, Adv. Drug Delivery Rev., 2010 DOI:10.1016/j.addr. DOI:10.1016/j.addr. , in press.
- M. Mahmoudi, A. Simchi, M. Imani, A. S. Milani and P. Stroeve, An in vitro study of bare and poly(ethylene glycol)-co-fumarate-coated superparamagnetic iron oxide nanoparticles: a new toxicity identification procedure, Nanotechnology, 2009, 20(22), 225104 CrossRef.
- D. G. Makey and U. S. Seal, The detection of four molecular forms of human transferrin during the iron binding process, Biochim. Biophys. Acta, 1976, 453, 250–256 CAS.
- P. Aisen, Inorganic Chemistry, American Elsevier, New York, 1973, ch. 9 Search PubMed.
- I. Lynch and K. A. Dawson, Protein–nanoparticle interactions, Nano Today, 2008, 3, 40–47 CrossRef CAS.
- M. Lundqvist, et al. Nanoparticle size and surface properties determine the protein corona with possible implications for biological impacts, Proc. Natl. Acad. Sci. U. S. A., 2008, 105, 14265–14270 CrossRef CAS.
- M. Mahmoudi, A. Simchi, M. Imani, A. S. Milani and P. Stroeve, Optimal design and characterization of superparamagnetic iron oxide nanoparticles coated with polyvinyl alcohol for targeted delivery and imaging, J. Phys. Chem. B, 2008, 112, 14470–14481 CrossRef CAS.
- T. Neuberger, B. Schopf, H. Hofmann, M. Hofmann and B. Rechenberg, Superparamagnetic nanoparticles for biomedical applications: possibilities and limitations of a new drug delivery system, J. Magn. Magn. Mater., 2005, 293, 483–496 CrossRef CAS.
- M. Arruebo, R. Fernandez-Pacheco, M. R. Ibarra and J. Santamaria, Magnetic nanoparticles for drug delivery, Nano Today, 2007, 2, 22–32 CrossRef.
- M. Mahmoudi, A. Simchi, A. S. Milani and P. Stroeve, Cell toxicity of superparamagnetic iron oxide nanoparticles, J. Colloid Interface Sci., 2009, 336, 510–518 CrossRef CAS.
- A. Chastellain, A. Petri and H. Hofmann, Particle size investigations of a multistep synthesis of PVA coated superparamagnetic nanoparticles, J. Colloid Interface Sci., 2004, 278, 353–360, DOI:10.1016/j.jcis.2004.06.025.
- R. Dulbecco and M. Vogt, Plaque formation and isolation of pure lines with poliomyelitis viruses, J. Exp. Med., 1954, 99, 167–182 CrossRef CAS.
- U. K. Laemmli, Cleavage of structural proteins during the assembly of the head of bacteriophage T4, Nature, 1970, 227, 680–685 CAS.
- J. Sun, et al. Synthesis and characterization of biocompatible Fe3O4 nanoparticles, J. Biomed. Mater. Res., Part A, 2007, 80, 333–341 CrossRef.
- P. S. Haddad, et al. Structural and morphological investigation of magnetic nanoparticles based on iron oxides for biomedical applications, Mater. Sci. Eng., C, 2008, 28, 489–494 CrossRef CAS.
- M. Mahmoudi, A. Simchi, M. Imani and U. O. Hafeli, Superparamagnetic iron oxide nanoparticles with rigid cross-linked polyethylene glycol fumarate coating for application in imaging and drug delivery, J. Phys. Chem. C, 2009, 113, 8124–8131 CrossRef CAS.
- W. E. Biles and J. J. Swain, Optimization and Industrial Experimentation, Wiley, New York, 1980 Search PubMed.
- S. H. De Paoli Lacerda et al, Interaction of gold nanoparticles with common human blood proteins, ACS Nano, 2009, 4, 365–379.
- B. F. Anderson, H. M. Baker, G. E. Norris, D. W. Rice and E. N. Baker, Structure of human lactoferrin: crystallographic structure analysis and refinement at 2.8 Å resolution, J. Mol. Biol., 1989, 209, 711–734 CrossRef CAS.
- M. S. Shongwe, et al. Anion binding by human lactoferrin: results from crystallographic and physicochemical studies, Biochemistry, 1992, 31, 4451–4458 CrossRef CAS.
- B. F. Anderson, H. M. Baker and E. J. Dodson, Structure of human lactoferrin at 3.2-Å resolution, Proc. Natl. Acad. Sci. U. S. A., 1987, 84, 1769–1773 CAS.
- C. T. Bailey, M. G. Patch and C. J. Carrano, Affinity labels for the anion-binding site in ovotransferrin, Biochemistry, 1988, 27, 6276–6282 CrossRef CAS.
- E. N. Baker and P. F. Lindley, New perspectives on the structure and function of transferrins, J. Inorg. Biochem., 1992, 47, 147–160 CrossRef CAS.
- M. S. Navati, U. Samuni, P. Aisen and J. M. Friedman, Binding and release of iron by gel-encapsulated human transferrin: evidence for a conformational search, Proc. Natl. Acad. Sci. U. S. A., 2003, 100, 3832–3837 CrossRef CAS.
- M. G. Patch and C. J. Carrano, The origin of the visible absorption in metal transferrins, Inorg. Chim. Acta, 1981, 56, L71–L73 CrossRef CAS.
- J. G. Grossmann, et al. Metal-induced conformational changes in transferrins, J. Mol. Biol., 1993, 229, 585–590 CrossRef CAS.
| This journal is © The Royal Society of Chemistry 2011 |
