Synthesis of reduced graphene oxide-anatase TiO2 nanocomposite and its improved photo-induced charge transfer properties†
Ping
Wang
a,
Yueming
Zhai
a,
Dejun
Wang
b and
Shaojun
Dong
*a
aState Key Laboratory of Electroanalytical Chemistry, Changchun Institute of Applied Chemistry, Chinese Academy of Sciences, Changchun, 130022, P. R. China. E-mail: dongsj@ciac.jl.cn
bCollege of Chemistry, Jilin University, Changchun, 130012, P. R. China
First published on 1st February 2011
Abstract
The construction of reduced graphene oxide or graphene oxide with semiconductor has gained more and more attention due to its unexpected optoelectronic and electronic properties. The synthesis of reduced graphene oxide (RGO) or graphene oxide-semiconductor nanocomposite with well-dispersed decorated particles is still a challenge now. Herein, we demonstrate a facile method for the synthesis of graphene oxide-amorphous TiO2 and reduced graphene oxide-anatase TiO2 nanocomposites with well-dispersed particles. The as-synthesized samples were characterized by transmission electron microscopy, X-ray diffraction, X-ray photoelectron spectroscopy, UV-Vis absorption spectroscopy, Fourier transform infrared spectrometry, and thermogravimetric analysis. The photovoltaic properties of RGO-anatase TiO2 were also compared with that of similar sized anatase TiO2 by transient photovoltage technique, and it was interesting to find that the combination of reduced graphene oxide with anatase TiO2 will significantly increase the photovoltaic response and retard the recombination of electron-hole pairs in the excited anatase TiO2.
1. Introduction
Since its discovery in 2004,1graphene nanosheets, one-atom-thick, two-dimensional, sp2-bonded carbon materials, has gained more and more attention due to its interesting electronic and optoelectronic properties.2,3 Up to now, many aspects of graphene-based applications, such as sensors,4–6 transistors,7 nanoelectronics8 and super capacitors,9 have been carried out. To meet this urgent demand, the construction of graphene-semiconductor nanocomposite was assumed to be of significant importance for developing the next generation of photovoltaic devices, owing to its unique optoelectronic properties after the integration of graphene with semiconductor nanoparticles.10–12 Kamat et al. found that through the interaction of TiO2 or ZnO nanoparticles with graphene oxide (GO), the excited electrons in the semiconductor nanoparticles will transfer into GO and further partially reduce GO to form reduced graphene oxide.11,12 However, despite the interesting optoelectronic properties, it is still difficult to synthesize reduced graphene oxide (RGO)-semiconductor nanocomposite with well-dispersed particles, which is expected to have great influence on the performance of the nanocomposite. Only a few works have now been reported on the synthesis of RGO-semiconductor nanocomposite with well-dispersed semiconductor particles.13,14Titanium dioxide (TiO2) as an important wide bandgap semiconductor has been intensively studied due to its promising applications in solar energy conversion and photocatalysis.15–17 Among the three distinct crystalline phases of TiO2—anatase, brookite, and rutile—anatase TiO2 has been proven to possess very high photo-activity and has been widely applied in dye-sensitized solar cells and photodegradation.18,19 Thus, the effective combination of RGO and anatase TiO2 nanoparticles should be vital for fabricating electronic devices and other applications.
Herein, we report a facile method to synthesize the GO-amorphous TiO2 and RGO-anatase TiO2 nanocomposite, on which the amorphous TiO2 and anatase TiO2 nanoparticles are well dispersed. In the synthesis, GO, the starting material of RGO, was first functionalized with poly(acrylic acid) (PAA); and then a very uniform amorphous TiO2 shell was made to cover GO by controlling the hydrolysis rate of titanium isopropoxide (TTIP); finally, the GO-amorphous TiO2 was converted into RGO-anatase TiO2 nanocomposite via a one-step solvothermal treatment, as illustrated in Scheme 1.
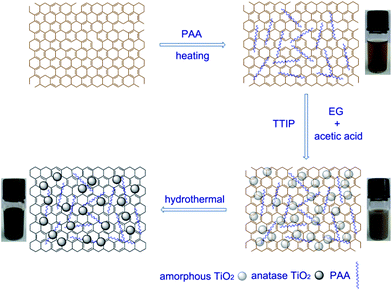 | ||
| Scheme 1 Procedure for synthesis of GO-amorphous TiO2 and RGO-anatase TiO2 nanocomposite. | ||
The photovoltaic properties of the as-synthesized RGO-anatase TiO2 nanocomposite were further investigated by the transient photovoltage (TPV) technique and interesting charge transfer properties were observed.
2. Experimental
All chemicals were used as received and without any further purification.2.1 Synthesis of GO
Graphite oxide was prepared from natural graphite powder (Alfa Aesar) by a modified Hummers method.20,21 To obtain GO sheets, GO powder was dispersed into distilled water (0.5 g L−1) followed by ultrasonicating (40 KHz, 100 W) for 1 h to obtain the clear solution under ambient condition.2.2 Functionalization of GO with PAA
In a typical synthesis, 5.72 mL acetic acid (HAc) (99.5%, Beijing Reagent Co., Ltd) and 0.221 g PAA (MW = ∼1800, Aldrich) was added into 44.28 mL GO aqueous solution (0.5 g L−1); then the solution was stirred for 1 h at 60 °C to complete the functionalization.2.3 Synthesis of GO-amorphous TiO2 nanocomposite
The above solution was allowed to cool to room temperature. After that, under vigorous stirring, a titanium precursor composed of 1.65 mL TTIP (97%, Aldrich), 7.21 mL ethylene glycol (EG) (Sinopharm Chemical Reagent Co., Ltd.) and 1.14 mL HAc was slowly added drop by drop.2.4 Synthesis of RGO-anatase TiO2 nanocomposite
The GO-amorphous TiO2 stock solution was transferred into a 100 mL PTFE-lined stainless-steel autoclave and kept under 180 °C for 8 h followed by cooling to ambient temperature naturally. The black precipitate was harvested by centrifuging at 5000 rpm, and washing with ethanol several times to remove the undecorated TiO2 particles, unreacted reactants and residual EG. Note: the centrifuging speed is very important here to remove the undecorated particles. Finally, the products were kept under vacuum at 50 °C overnight before characterization.2.5 Characterization
The transmission electron microscopy (TEM) and high-resolution transmission electron microscopy (HRTEM) imaging were performed on a TECNAI G2microscope (FEI company). X-ray diffraction patterns were recorded by a D8 ADVANCE (BRUKER) diffractometer with Cu Kα radiation (λ = 1.54056 Å) in the range of 3–80° (2θ). X-ray photoelectron spectroscopy (XPS) measurement was recorded on a Thermo VG Scientific Escalab 250 spectrometer using monochromatized Al Kα excitation. Thermogravimetric analysis (TGA) measurements were carried out on a Perkin-Elmer Pyris Diamond TGA analyzer under air atmosphere from room temperature to 800 °C at a heating rate of 10 °C min−1. Infrared spectra were obtained on a VERTEX 70 Fourier transform infrared (FTIR) spectrometer (Bruker). Raman measurements were performed on a J-Y T64000 Raman spectrometer with 514.5 nm wavelength incident laser light. UV-Vis spectra were obtained on a SHIMADZU UV-3600 UV-VIS-NIR spectrophotometer. AFM was performed on a SPI3800N microscope (Seiko Instruments, Inc.).The details of the TPV system have been described previously.22,23 As for the measurement, the sample chamber consisted of an FTO electrode, a 10 mm thick mica spacer as electron isolator (to prevent the photo-induced electrons in the semiconductor from being directly injected to the electrode), and a platinum wire gauze electrode (with a transparency of about 50%). The construction was a sandwich-like structure of FTO electrode/sample/mica/gauze platinum electrode, and the components of the sandwich-like structure were assembled directly by sequence without further treatment. During the measurement, the gauze platinum electrode was connected to the core of a BNC cable, which provided the input signals to the oscilloscope. The samples were excited from platinum wire gauze electrode with a laser radiation pulse (wavelength of 355 nm (0.05 mJ) and pulse width of 5 ns) from a third harmonic Nd![[thin space (1/6-em)]](https://www.rsc.org/images/entities/char_2009.gif) :
:![[thin space (1/6-em)]](https://www.rsc.org/images/entities/char_2009.gif) YAG laser (Polaris II, New Wave Research). The intensity of the pulse was regulated with a neutral gray filter and determined with an EM500 single-channel joulemeter (Molectron). The TPV signals were registered with a 500 MHz digital phosphor oscilloscope (TDS 5054, Tektronix).
YAG laser (Polaris II, New Wave Research). The intensity of the pulse was regulated with a neutral gray filter and determined with an EM500 single-channel joulemeter (Molectron). The TPV signals were registered with a 500 MHz digital phosphor oscilloscope (TDS 5054, Tektronix).
3. Result and discussion
The attachment of semiconductor nanoparticles with GO could be realized through the carboxylic acid functional groups.12 However, due to the residual carboxylic acid functional groups being mainly located on the edge of GO,24 which may not be beneficial for the homogeneous growth of semiconductor nanoparticles on GO, we first functionalized GO with PAA, a polymer that contains plenty of carboxylic acid functional groups, to make TiO2 homogeneously grow onto GO (Scheme 1). In addition, by comparing with the synthesis without introducing PAA, it was found that the introduction of PAA is beneficial for the fast formation of amorphous TiO2 on GO. On the other hand, it is well known that titanium alkoxides are very sensitive to H2O and even the moisture in the air could also cause the decomposition of the titanium precursor, which greatly hinders the homogeneous growth of TiO2 onto GO in the aqueous solution. Thus, we introduce two reagents, EG and HAc, to co-control the hydrolysis rate of TTIP to achieve the homogeneous growth of TiO2 shell.25–27It can be seen from Fig. 1a that after introducing EG and HAc into the reaction system, the TiO2 are homogeneously grown on GO and no area that is not decorated with TiO2 could be observed. X-ray diffraction (XRD) measurement (Fig. 2) shows that after the growth of TiO2, the 001 reflection of GO (∼10.5°) disappears, indicating the full exfoliation of the graphite oxide, and that the TiO2 grown on GO is in an amorphous phase. Amorphous TiO2 normally exhibits very low photoactivity28 and GO possesses lower electronic properties compared with that of RGO. These drawbacks mean that the GO-amorphous TiO2 nanocomposite should not be useful for applications in developing photovoltaic devices. Therefore, it is necessary to convert GO-amorphous TiO2 into RGO-anatase TiO2 nanocomposite.
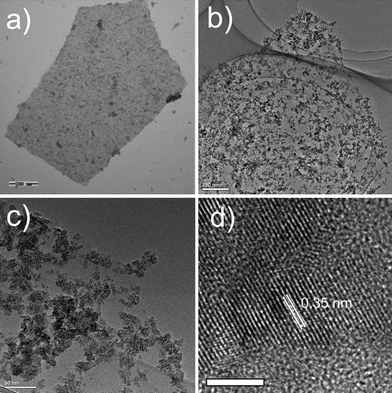 | ||
| Fig. 1 TEM image of GO-amorphous TiO2 nanocomposite (a), TEM (b, c) and HRTEM (d) images of RGO-anatase TiO2 nanocomposite. Scale bar: 5 nm. | ||
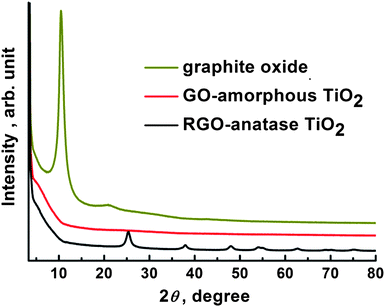 | ||
| Fig. 2 XRD patterns of graphite oxide, GO-amorphous TiO2 and RGO-anatase TiO2 nanocomposite, respectively. | ||
Since the reagent, EG, used to control the hydrolysis rate of titanium precursor also has the ability to reduce GO at high temperature29 and the amorphous TiO2 could be changed to anatase TiO2 in the EG/HAc/H2O reaction system,25 the conversion can be easily achieved via the solvothermal treatment of the as-synthesized GO-amorphous TiO2 stock solution. After the solvothermal treatment, it can be seen that the color of the solution changed from brown to black (photograph in Scheme 1), and this color change has previously been witnessed through the reduction of graphene oxide.12
From Fig. 1b, it is clearly seen that after the solvothermal treatment, unlike the GO-amorphous TiO2 nanocomposite, relatively well dispersed TiO2 particles on RGO were observed. Further investigation (Fig. 1c) found that there are undecorated areas of RGO. The reason for this is assumed to be the crystallization process of TiO2. HRTEM (Fig. 1d) image shows that the TiO2 particles are well crystallized and the sizes of the particles are 8–10 nm. The well-crystallized structure with lattice spacing of 0.35 nm corresponds to the (101) planes of the anatase TiO2. XRD (Fig. 2) result confirms the conversion of amorphous TiO2 to pure anatase TiO2 (JCPDS No. 21-1272). The average crystallite size of anatase TiO2 calculated from the Scherrer equation is about 11.1 nm, which is slightly larger than the HRTEM result. AFM image of RGO-anatase TiO2 (see ESI†) indicates that the as-synthesized nanocomposite has a rough surface and the average thickness is 20–30 nm, which is consistent with the HRTEM result.
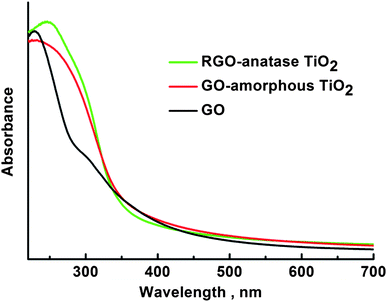
TGA curves (Fig. 3) show the weight loss of GO-amorphous TiO2 and RGO-anatase TiO2. The total weight loss of GO-amorphous TiO2 (80.82%) could be ascribed to the loss of the adsorbed H2O, the decomposition of PAA, the crystallization of amorphous TiO2 into anatase TiO2 and the oxidation of GO; while for RGO-anatase TiO2 (27.56%), it could be attributed to the loss of the adsorbed H2O, the decomposition of PAA and the oxidation of RGO. From the TGA results, it can be estimated that the content of TiO2 in the RGO-anatase TiO2 nanocomposite is 72.44%. UV-Vis results (Fig. 4) shows that after the coating of the amorphous TiO2 onto GO, the absorbance intensity in the range of 300–350 nm is greatly increased, which is attributed to the strong absorption of amorphous TiO2. A similar result was also observed for the RGO-anatase TiO2 nanocomposite.
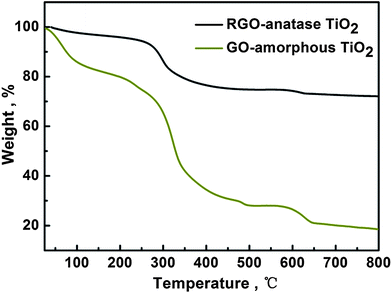 | ||
| Fig. 3 TGA curves of GO-amorphous TiO2 and RGO-anatase TiO2. | ||
Fig. 5 is the X-ray photoelectron spectroscopy (XPS) results of graphite oxide, GO-amorphous TiO2 and RGO-anatase TiO2. As shown, four peaks located at 284.5, 285.4, 286.8 and 288.5 eV, observed from the C 1s deconvolution spectrum of graphite oxide, correspond to the C–C (aromatic), C–OH, C (epoxy/alkoxy)/C![[double bond, length as m-dash]](https://www.rsc.org/images/entities/char_e001.gif) O (aromatic) and carboxylic groups (O
O (aromatic) and carboxylic groups (O![[double bond, length as m-dash]](https://www.rsc.org/images/entities/char_e001.gif) C–O), respectively. After coating amorphous TiO2 onto GO, it was unexpectedly found that the C 1s peak of C (epoxy/alkoxy)/C
C–O), respectively. After coating amorphous TiO2 onto GO, it was unexpectedly found that the C 1s peak of C (epoxy/alkoxy)/C![[double bond, length as m-dash]](https://www.rsc.org/images/entities/char_e001.gif) O (aromatic) disappears even without the reduction of GO, which is assumed to be caused by the high coverage of amorphous TiO2 on GO. Although the coating of TiO2 interferes with identifying the reduction of GO through the decrease of C (epoxy/alkoxy)/C
O (aromatic) disappears even without the reduction of GO, which is assumed to be caused by the high coverage of amorphous TiO2 on GO. Although the coating of TiO2 interferes with identifying the reduction of GO through the decrease of C (epoxy/alkoxy)/C![[double bond, length as m-dash]](https://www.rsc.org/images/entities/char_e001.gif) O (aromatic), considerable undecorated areas of the RGO-anatase TiO2 nanocomposite could be observed after the solvothermal treatment. Thus, the reduction of GO could also be confirmed to some extent by comparing the peak intensity of C (epoxy/alkoxy)/C
O (aromatic), considerable undecorated areas of the RGO-anatase TiO2 nanocomposite could be observed after the solvothermal treatment. Thus, the reduction of GO could also be confirmed to some extent by comparing the peak intensity of C (epoxy/alkoxy)/C![[double bond, length as m-dash]](https://www.rsc.org/images/entities/char_e001.gif) O (aromatic) of GO and RGO-anatase TiO2 nanocomposite.
O (aromatic) of GO and RGO-anatase TiO2 nanocomposite.
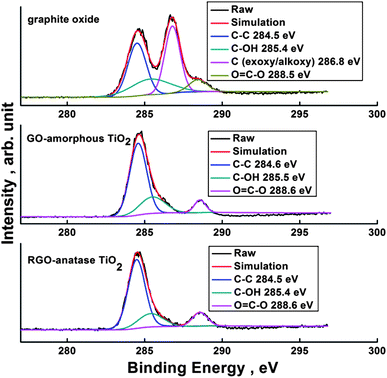 | ||
| Fig. 5 C 1s XPS spectra of graphite oxide, GO-amorphous TiO2 and RGO-anatase TiO2. | ||
From the FTIR spectra, as shown in Fig. 6, it can be seen that the band at 1046 cm−1 (C–O stretching vibration) of GO disappears for RGO-anatase TiO2 nanocomposite, which indicates the reduction of this group.14 For both GO-amorphous TiO2 and RGO-anatase TiO2 nanocomposite, the band at 1717 cm−1 (C![[double bond, length as m-dash]](https://www.rsc.org/images/entities/char_e001.gif) O stretching of –COOH groups) indicates the existence of the bonded PAA.
O stretching of –COOH groups) indicates the existence of the bonded PAA.
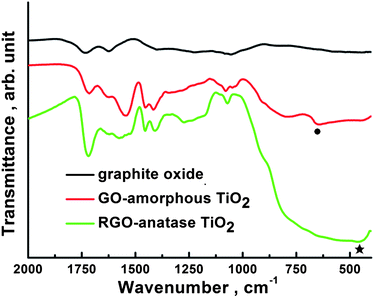 | ||
| Fig. 6 FTIR spectra of graphite oxide, GO-amorphous TiO2 and RGO-anatase TiO2. The solid circle and star denote the Ti–O stretching band associated with the amorphous and anatase TiO2, respectively. | ||
In addition, the shift of the band corresponding to the Ti–O stretching from 652 cm−1 to 465 cm−1 indicates the phase transformation of TiO2 from amorphous to anatase.25,30 After the reduction of GO to RGO, the D/G band ratio in the Raman spectra (see ESI†) was slightly increased, which is the same as the result reported by our group previously.31 In addition, there is no obvious difference in the Raman spectra of our RGO-anatase TiO2 nanocomposite and the standard hydrazine reduced graphene, indicating the reduction of GO into RGO.
Owing to the superior charge transport properties of the RGO,11,12 the combination of TiO2 with RGO is expected to create some unique optoelectronic properties. For instance, Liu et al. observed the obvious enhancement of Li-ion insertion/extraction kinetics in TiO2 for the RGO-TiO2 nanocomposite.32 To further improve the performance of this novel nanocomposite, a good understanding of the photovoltaic properties of the RGO-anatase TiO2 is necessary. However, no such works concerning the charge transfer properties of RGO-anatase TiO2 nanocomposite have been reported to date. Here, we used a transient photovoltage (TPV) technique, a very promising method for the investigation of dynamic properties of the photo-induced charge carriers in semiconductor materials,22,23,26,33,34 to study the photovoltaic properties of as-synthesized RGO-anatase TiO2 nanocomposite. The measurement was performed at atmospheric pressure and room temperature (293 K). For comparison, RGO and anatase TiO2 nanoparticles were synthesized by a similar method except without introducing TTIP and GO during the synthesis, respectively. From the TEM and XRD results (see ESI†), it can be seen that the size and the crystal phase of anatase TiO2 have no obvious differences compared with that of RGO-anatase TiO2 nanocomposite.
Fig. 7 shows the TPV spectra of RGO, anatase TiO2 and RGO-anatase TiO2 nanocomposite. As shown, pure RGO exhibits almost no photovoltaic response (the very low response is caused by the apparatus), while for anatase TiO2, only a very low photovoltaic response (∼0.03 mV) was observed. However, it was interesting to find that after the integration of anatase TiO2 with RGO, its photovoltaic response significantly increased to 0.16 mV, which is ∼5 times higher than that of anatase TiO2. This demonstrates that once the anatase TiO2 is excited, the photo-induced electrons will transfer from anatase TiO2 into RGO, while the holes are left in anatase TiO2, which is proved by the positive signal of photovoltaic response. Through this electrons transfer process, the electron-hole pairs generated in the excited anatase TiO2 could be efficiently separated, thus resulting in the improved photovoltaic response of RGO-anatase TiO2 nanocomposite. The other characteristic of the photovoltaic response of RGO-anatase nanocomposite compared with anatase TiO2 is that its mean life time of electron-hole pairs is prolonged from ∼10−7 s to ∼10−5 s. This demonstrates that the integration of RGO with anatase TiO2 will greatly retard the recombination electron-hole pairs in the excited anatase TiO2. Based on the results above, it can be concluded here that RGO plays dual roles in the RGO-anatase TiO2 nanocomposite: one is increasing the electron-hole pair separation through the electron injection from conduction band of anatase TiO2 into RGO, while the other is greatly retarding the recombination of electron-hole pairs in the excited anatase TiO2.
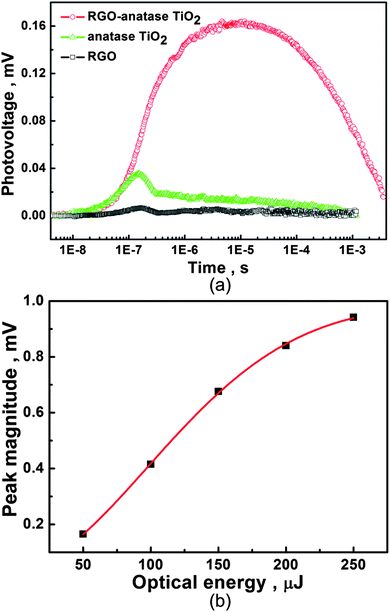 | ||
| Fig. 7 TPV spectra of RGO, anatase TiO2 and RGO-anatase TiO2 (a) and the dependence of photovoltage magnitude of RGO-anatase TiO2 on the optical energy of incident laser (b). | ||
It can also be seen from TPV spectra of anatase TiO2 and RGO-anatase TiO2 that the decay time of photovoltaic response of RGO-anatase TiO2 is longer than that of anatase TiO2, which further proves the result that the integration of RGO with anatase TiO2 will retard the recombination electron-hole pairs. The decay time is supposed to be the time needed for the whole photo-induced charge separation and recombination process.26 For anatase TiO2, the time includes the photo-induced electron-hole pair separation, the migration of electrons and holes in and between anatase TiO2, and the recombination of electrons and holes, while for the RGO-anatase TiO2 nanocomposite, we suppose its decay time is composed of the separation of electron-hole pairs through the injection of electrons in anatase TiO2 into RGO, the migration of electrons and holes in RGO and anatase TiO2, respectively, and the recombination of the electrons and holes at the interface of RGO and anatase TiO2. It is considered that the process of electron migration in RGO increases the time needed for the recombination of electrons and holes. In addition, we also investigate the dependence of the peak magnitude of photovoltaic response of RGO-anatase TiO2 nanocomposite on the optical energy of the incident laser. As shown (Fig. 7 (b)), the change of peak magnitude shows a linear characteristic as the optical energy of the incident laser increases from 50 to 150 μJ, while for the higher optical energy (150∼250 μJ), its change shows a nonlinear characteristic. The result demonstrates that the RGO in the nanocomposite exhibits different behaviors for accepting electrons under different energies of the incident light.
4. Conclusions
In summary, a facile method was developed for the synthesis of GO-amorphous TiO2 and RGO-anatase TiO2 nanocomposite. Both amorphous and anatase TiO2 are well dispersed on GO and RGO, respectively. Further TPV studies of RGO-anatase TiO2 nanocomposite found that the integration of RGO with anatase TiO2 will significantly increase the photovoltaic response and significantly prolong its mean life time of electron-hole pairs compared with that of anatase TiO2. The information provided here is expected to be beneficial for developing next-generation RGO-semiconductor based photovoltaic devices.Acknowledgements
This work was supported by the National Natural Science Foundation of China (No. 20820102037) and the 973 Project (2009CB930100 and 2010CB933600), and Dr Ping Wang is grateful for the partial financial support from China Postdoctoral Science Foundation (No. 20090461047).Notes and references
- K. S. Novoselov, A. K. Geim, S. V. Morozov, D. Jiang, Y. Zhang, S. V. Dubonos, I. V. Grigorieva and A. A. Firsov, Science, 2004, 306, 666 CrossRef CAS.
- J. H. Chen, C. Jang, S. Xiao, M. Ishigami and M. S. Fuhrer, Nat. Nanotechnol., 2008, 3, 206 CrossRef CAS.
- P. Avouris, Z. Chen and V. Perebeinos, Nat. Nanotechnol., 2007, 2, 605 CrossRef CAS.
- F. Schedin, A. K. Geim, S. V. Morozov, E. W. Hill, P. Blake, M. I. Katsnelson and K. S. Novoselov, Nat. Mater., 2007, 6, 652 CrossRef CAS.
- P. K. Ang, W. Chen, A. T. S. Wee and K. P. Loh, J. Am. Chem. Soc., 2008, 130, 14392 CrossRef CAS.
- M. Zhou, Y. M. Zhai and S. J. Dong, Anal. Chem., 2009, 81, 5603 CrossRef CAS.
- C. Stampfer, E. Schurtenberger, F. Molitor, J. Guttinger, T. Ihn and K. Ensslin, Nano Lett., 2008, 8, 2378 CrossRef CAS.
- C. H. Park and S. G. Louie, Nano Lett., 2010, 10, 426 CrossRef CAS.
- M. D. Stoller, S. Park, Y. Zhu, J. An and R. S. Ruoff, Nano Lett., 2008, 8, 3498 CrossRef CAS.
- I. V. Lightcap, T. H. Kosel and P. V. Kamat, Nano Lett., 2010, 10, 577 CrossRef CAS.
- G. Williams and P. V. Kamat, Langmuir, 2009, 25, 13869 CrossRef CAS.
- G. Williams, B. Seger and P. V. Kamat, ACS Nano, 2008, 2, 1487 CrossRef CAS.
- F. Li, J. Song, H. Yang, S. Gan, Q. Zhang, D. Han, A. Ivaska and L. Niu, Nanotechnology, 2009, 20, 455602 CrossRef.
- A. Cao, Z. Liu, S. Chu, M. Wu, Z. Ye, Z. Cai, Y. Chang, S. Wang, Q. Gong and Y. Liu, Adv. Mater., 2010, 22, 103 CrossRef CAS.
- B. O'Regan and M. Grätzel, Nature, 1991, 353, 737 CrossRef CAS.
- S. Khan, M. Al-Shahry and W. B. Ingler Jr, Science, 2002, 297, 2243 CrossRef CAS.
- R. Asahi, T. Morikawa, T. Ohwaki, K. Aoki and Y. Taga, Science, 2001, 293, 269 CrossRef CAS.
- J. C. Yu, J. G. Yu, W. K. Ho, Z. T. Jiang and L. Z. Zhang, Chem. Mater., 2002, 14, 3808 CrossRef CAS.
- N. G. Park, J. van de Lagemaat and A. J. Frank, J. Phys. Chem. B, 2000, 104, 8989 CrossRef CAS.
- W. S. Hummers Jr and R. E. Offeman, J. Am. Chem. Soc., 1958, 80, 1339 CrossRef CAS.
- N. I. Kovtyukhova, P. J. Ollivier, B. R. Martin, T. E. Mallouk, S. A. Chizhik, E. V. Buzaneva and A. D. Gorchinskiy, Chem. Mater., 1999, 11, 771 CrossRef CAS.
- X. Wei, T. Xie, D. Xu, Q. Zhao, S. Pang and D. Wang, Nanotechnology, 2008, 19, 275707 CrossRef.
- Q. Zhang, D. Wang, X. Wei, T. Xie, Z. Li, Y. Lin and M. Yang, Thin Solid Films, 2005, 491, 242 CrossRef CAS.
- R. Yuge, M. Zhang, M. Tomonari, T. Yoshitake, S. Iijima and M. Yudasaka, ACS Nano, 2008, 2, 1865 CrossRef CAS.
- P. Wang, T. Xie, L. Peng, H. Li, T. Wu, S. Pang and D. Wang, J. Phys. Chem. C, 2008, 112, 6648 CrossRef CAS.
- P. Wang, T. Xie, H. Li, L. Peng, Y. Zhang, T. Wu, S. Pang, Y. Zhao and D. Wang, Chem.–Eur. J., 2009, 15, 4366 CrossRef CAS.
- R. Parra, M. S. Góes, M. S. Castro, E. Longo, P. R. Bueno and J. A. Varela, Chem. Mater., 2008, 20, 143 CrossRef CAS.
- O. Carp, C. L. Huisman and A. Reller, Prog. Solid State Chem., 2004, 32, 33 CrossRef CAS.
- C. Nethravathi and M. Rajamathi, Carbon, 2008, 46, 1994 CrossRef CAS.
- X. Jiang, T. Herricks and Y. Xia, Adv. Mater., 2003, 15, 1205 CrossRef CAS.
- C. Zhu, S. Guo, Y. Fang and S. Dong, ACS Nano, 2010, 4, 2429 CrossRef CAS.
- D. Wang, D. Choi, J. Li, Z. Yang, Z. Nie, R. Kou, D. Hu, C. Wang, L. V. Saraf, J. Zhang, I. A. Aksay and J. Liu, ACS Nano, 2009, 3, 907 CrossRef CAS.
- V. Duzhko, V. Y. Timoshenko, F. Koch and T. Dittrich, Phys. Rev. B: Condens. Matter, 2001, 64, 075204 CrossRef.
- Q. Fang, G. Zhu, Z. Jin, M. Xue, X. Wei, D. Wang and S. Qiu, Angew. Chem., Int. Ed., 2006, 45, 6126 CrossRef CAS.
Footnote |
| † Electronic supplementary information (ESI) available: AFM image of RGO-anatase TiO2, Raman spectra of GO, GO-amorphous TiO2, RGO-anatase TiO2 and hydrazine reduced graphene, TEM image and XRD pattern of anatase TiO2 nanoparticles. See DOI: 10.1039/c0nr00714e |
| This journal is © The Royal Society of Chemistry 2011 |

