The effects of concentration-dependent morphology of self-assembling RADA16 nanoscaffolds on mixed retinal cultures†
Dominic
Ho
ab,
Melinda
Fitzgerald
b,
Carole A.
Bartlett
b,
Bogdan
Zdyrko
c,
Igor A.
Luzinov
c,
Sarah A.
Dunlop
*b and
K.
Swaminathan Iyer
*a
aSchool of Biomedical, Biomolecular and Chemical Sciences, The University of Western Australia, Crawley, WA 6009, Australia. E-mail: swaminatha.iyer@uwa.edu.au; Tel: +61 8 6488 4470
bExperimental and Regenerative Neurosciences, School of Animal Biology, The University of Western Australia, Perth, Australia. E-mail: sarah.dunlop@uwa.edu.au; Fax: +61 8 6488 7527; Tel: +61 8 6488 1403
cSchool of Materials Science and Engineering, Clemson University, 161 Sirrine Hall, Clemson, South Carolina 29634-0971, USA
First published on 3rd December 2010
Abstract
RADA16 self-assembling peptide nanofiber scaffolds (SAPNSs) have been shown to have positive effects on neural regeneration following injury to the central nervous system in vivo, but mechanisms are unclear. Here we show that RADA16 SAPNSs form scaffolds of increasing fiber density with increasing peptide concentration which in turn has a concentration-dependent effect on neurons and astrocytes in mixed retinal cultures. Importantly, we report that the final nanoscale fiber architecture is an important factor to consider in designing scaffolds to promote regeneration in the central nervous system.
Tissue engineering involves the use of scaffolds and templates for the development of biological substitutes to restore, maintain, or improve tissue function.1,2 Many tissues, such as nerve, muscle, tendon, ligament, blood vessel, bone and teeth, have tubular or fibrous bundle architectures and anisotropic properties. Therefore, fiber-based structures have a number of applications in tissue engineering, including soft tissue repair, vascular prostheses, bone and cartilage scaffolds, and central nervous system regeneration.3 Many parameters must be considered in the design of fiber architecture, such as optimal diameter and linear density, overall porosity and pore size distribution, the influence of fiber orientation on cellular responses and whether fibre degradation occurs and its effect on structural properties.4
SAPNSs were originally developed by Zhang et al., and are synthetic biological scaffolds formed by the assembly of ionic self-complementary peptides.5–8 Alternating positive and negative L-amino acids within the peptides form highly hydrated scaffolds in the presence of physiological concentrations of salts found in human body fluids, such as cerebrospinal fluid, or in tissue culture media. The scaffold consists of β-sheets of ionic peptides containing 50% charged residues, resulting in interwoven nanofibers. Furthermore, in comparison to currently available polymer biomaterials, SAPNS interwoven nanofibers are similar in scale to the native extracellular matrix, and can be broken down into natural L-amino acids. As such, SAPNSs are reported to be immunologically inert, thus avoiding the problem of tissue rejection when applied directly to a wound site.9 SAPNSs have been shown to effectively heal burn wounds,10 repair injuries to the spinal cord and visual pathway and thereby restore function.11,12
Regeneration in the central nervous system is a complex phenomenon to model in vitro due to the nature of the intimately associated network of multiple neuronal and glial cell types as well as the vascular supply.13 Here, we focus on the principal cell type, i.e.neurons, and one class of supporting glial cells, namely astrocytes. Neurons encode, relay and process information while astrocytes provide structural and trophic support to neurons, and also respond rapidly to neuronal activity by triggering slowly propagating astrocytic Ca2+ waves.14 To assess the effects of scaffolds on neural regeneration, it is therefore important to understand how both neurons and astrocytes interact with the scaffolds at both the extra- and intra-cellular levels. Here, we used mixed neonatal rat retinal cultures to elucidate the effects of concentration dependent self-assembly of peptide nanofiber scaffolds on neurons (retinal ganglion cells—RGCs) and astrocytes using complementary scanning electron microscopy (SEM), immunohistochemistry and atomic force microscopy (AFM).
The morphology of RADA16 SAPNSs at concentrations (wt%) of 1%, 0.5%, 0.1% and 0.05% was initially characterised using SEM (Fig. 1a–d). Preparation for this technique required scaffold samples to be dehydrated, fixed and coated with platinum. SEM analysis indicated that nanoscaffold formation occurred at all concentrations. At high concentrations, RADA16 SAPNS formed a dense 3D network of interwoven nanofibers (Fig. 1d). High magnification SEM analysis indicated that fiber diameter was approximately 10–15 nm for all concentrations (inset: Fig. 1a), similar to that reported in previous studies. Decreasing concentrations of peptide resulted in a progressive decrease in fiber density, in particular at 0.05% where RADA16 SAPNS thickness was uneven (see Fig S2, ESI†). Atomic force microscopy (AFM) confirmed the presence of dense interwoven nanofibers at 1%, supporting similar AFM findings showing morphological dimensional changes with decreases in peptide concentration.10 Imaging the scaffold under hydrated conditions resulted in an increase in root mean square (RMS) roughness, indicative of the increased overall porosity of the scaffold in its hydrated state (see Fig S1, ESI†).
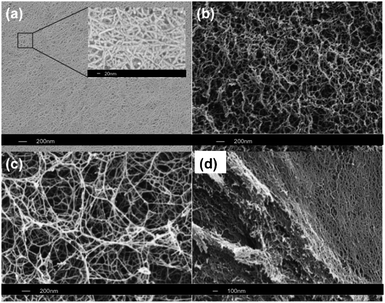 | ||
| Fig. 1 SEM images of RADA16 scaffolds at concentrations of (a and d) 1%, (b) 0.5% and (c) 0.1%. Inset (a) High magnification SEM image showing the 10–15 nm fibers. (d) Lateral view showing 3D assembly for 1% concentration. | ||
The length of neurites extending from β-III tubulin immunopositive RGCsin vitro can be used as an indication of potential neural regenerationin vivo. RGC neurite length decreased when cultured on increasing RADA16 SAPNS concentrations, with significant decreases at 0.1%, 0.5% and 1%, compared to controls without SAPNS (Fig. 2a–c, p ≤ 0.05). RGC numbers per field of view were also reduced on 1% SAPNS, when compared to the control (Fig. 2d, p ≤ 0.05). As RGCs do not proliferate in culture, it is likely that reduced RGC numbers reflect reduced adhesion on 1% SAPNS. It should also be noted that neurites from RGCs cultured without SAPNS or on 0.05% SAPNS appeared to form connections with neurites from adjacent RGCs. This was rarely seen in the 0.1%, 0.5% and 1% SAPNS cultures, if at all. The effects of SAPNS on numbers of GFAP immunopositive astrocytes were determined and, similarly to RGCs, a dose-dependent effect of SAPNS was observed. Astrocyte numbers progressively decreased as SAPNS concentrations increased, with significant decreases at concentrations of 0.1%, 0.5% and 1% (Fig. 3c, p ≤ 0.05). Astrocytes in mixed retinal cultures are capable of proliferation, and therefore reduced astrocyte numbers on higher concentrations of SAPNS may reflect both reduced attachment and/or proliferation.
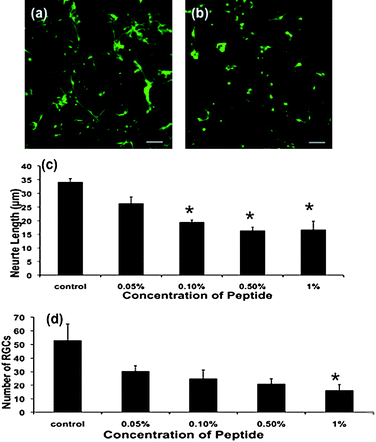 | ||
| Fig. 2 Representative confocal images of RGCs cultured on (a) no SAPNS and (b) 0.1% SAPNS and immunohistochemically stained for β-III tubulin; scale 30 µm. Mean ± SEM (c) neurite length and (d) RGC numbers per 40× objective field of view for the different SAPNS concentrations at 24 h. Values significantly different from control are indicated * (p ≤ 0.05). | ||
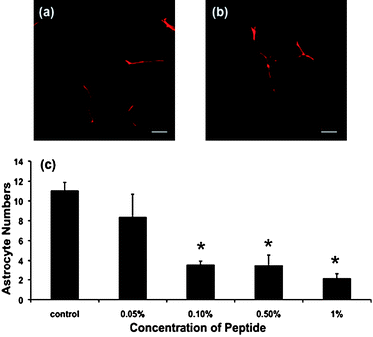 | ||
| Fig. 3 Representative confocal images of astrocytes cultured on (a) no SAPNS and (b) 0.05% SAPNS and immunohistochemically stained for GFAP, magnification = 40×, scale 30 µm (b). (c) Mean ± SEM astrocyte numbers per 10× field of view for different concentrations of SAPNS. Values significantly different from control are indicated * (p ≤ 0.05). | ||
In addition to immunohistochemical analyses of mixed retinal cell cultures, interactions between retinal cells and SAPNS were examined using SEM, a technique allowing visualisation of the fine details of physical interactions but precluding identification of individual cell types. As expected from the immunohistochemical studies described above, cells appeared intimately adherent to, and in some instances, spread on the surface of the SAPNS. Importantly, the cellular processes extending from cells cultured on lower concentrations of SAPNS appeared to be longer and more numerous than those on higher concentrations (Fig. 4).
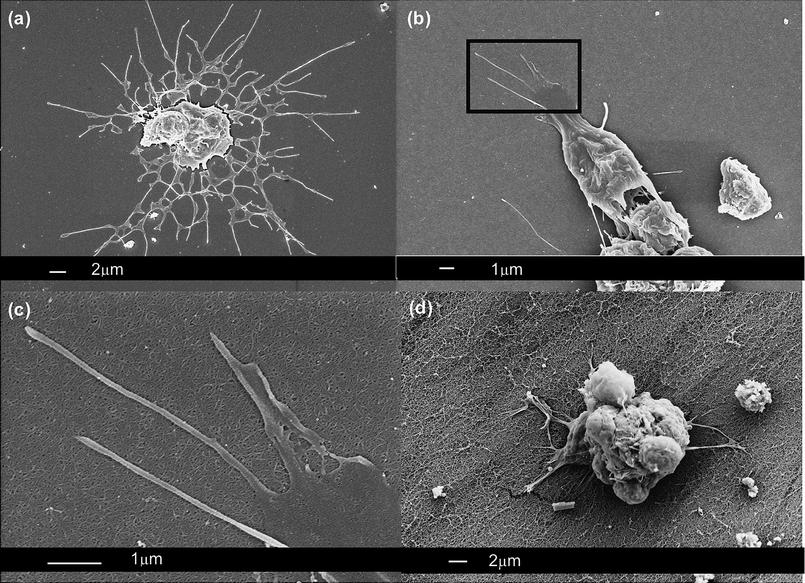 | ||
| Fig. 4 Representative SEM images of mixed retinal cells cultured on (a) no SAPNS, (b and c) 0.5% SAPNS and (d) 1% SAPNS. (c) High magnification SEM of inset in (b) showing cellular processes spreading across the surface of the SAPNS. | ||
It has been reported that both the morphology and alignment of cultured human astrocytes are affected profoundly by the surface of nanofibers.15Astrocytes have been reported to preferentially adhere to and proliferate on nanofibers with a larger diameter and lower surface energy.15 Indeed, astrocytes exhibited significantly increased cell density on low surface energy and conventionally sized (with a diameter greater than 100 nm) carbon fibers.15 In the current study, RADA16 SAPNS had fiber diameters of 10–15 nm and, at high concentrations, formed a dense 3D structure (Fig. 1d). These structures may be associated with high surface energy, due to the very high surface to volume ratio.16 High surface energies may indeed explain our reduced astrocyte numbers on high RADA16 SAPNS concentrations. Given that astrocytes play a pivotal role as guiding structures for migratory neurons during development, providing nutrients and growth factors as well as communicating with neighboring neurons, the effect of high concentrations of SAPNS peptides in reducing astrocyte density may have led to a domino effect resulting in our observed decreased RGC neurite lengths and numbers. Conversely, lower SAPNS concentrations which led to a non-uniform assembly appear to have been beneficial.
In summary, we report morphological differences in RADA16 nanoscaffolds in response to different RADA16 peptide concentrations. These differences dictate the final nanoscale fiber architecture with altered 3D density and overall porosity. It is likely that more dense SAPNS structures result in reduced attachment and/or proliferation of astrocytes, resulting in, or concurrent with, decreased neuron adhesion and decreased neurite extension. Although we report significant concentration-dependent effects of SAPNS at 24 h, chronic exposures are warranted to examine long-term beneficial, or detrimental, effects. Fibre properties may be crucial in understanding how nanosized scaffolds promote regeneration in the central nervous system and suggest that lower concentrations may be of greater benefit than more concentrated, dense structures.
The authors are grateful for the financial support for this work by the Australian Research Council (DP0988351), National Health and Medical Research Council (Fellowship ID: 513700) and Sir Harry Secombe Trust managed by Perpetual (ID: 841). The SEM analysis was carried out using facilities in the Centre for Microscopy, Characterization and Analysis, The University of Western Australia, which are supported by University, State and Federal Government funding.
References
- L. G. Parkinson, N. L. Giles, K. F. Adcroft, M. W. Fear, G. E. Poinern and F. M. Wood, Tissue Eng., Part A, 2009, 33, 154 Search PubMed.
- R. G. Flemming, C. J. Murphy, G. A. Abrams, S. L. Goodman and P. F. Nealey, Biomaterials, 1999, 20, 573 CrossRef CAS.
- A. S. Andersson, F. Backhed, A. von Euler, A. Richter-Dahlfors, D. Sutherland and B. Kasemo, Biomaterials, 2003, 24, 3427 CrossRef CAS.
- Y. Wan, Y. Wang, Z. Liu, X. Qu, B. Han, J. Bei and S. Wang, Biomaterials, 2005, 26, 4453 CrossRef CAS.
- S. Zhang, Nat. Biotechnol., 2003, 21, 1171 CrossRef CAS.
- S. Zhang, T. Holmes, C. Lockshin and A. Rich, Proc. Natl. Acad. Sci. U. S. A., 1993, 90, 3334 CAS.
- S. Zhang, T. C. Holmes, C. M. DePersio, R. O. Hynes, X. Su and A. Rich, Biomaterials, 1995, 16, 1385 CrossRef CAS.
- S. Zhang, D. M. Martini, W. Hwang and S. Santoso, Curr. Opin. Chem. Biol., 2002, 6, 865 CrossRef CAS.
- R. G. Ellis-Behnke, Y. X. Liang, K. C. David, P. W. F. Pau, G. E. Schnieder, S. Zhang, W. Wu and K. F. So, Nanomed. Nanotechnol. Biol. Med., 2006, 2, 207 CrossRef.
- H. Meng, L. Chen, Z. Ye, S. Wang and X. Zhao, J. Biomed. Mater. Res., Part B, 2008, 89, 379.
- J. Guo, H. Su, Y. Zeng, Y. X. Liang, W. M. Wong, R. G. Ellis-Behnke, K. F. So and W. Wu, Nanomed. Nanotechnol. Biol. Med., 2007, 3, 311 CrossRef CAS.
- R. G. Ellis-Behnke, Y. X. Liang, S. W. You, D. K. C. Tay, S. Zhang, K. F. So and G. R. Schneider, Proc. Natl. Acad. Sci. U. S. A., 2006, 103, 5054 CrossRef CAS.
- F. Kirchoff, R. Dringen and C. Giaume, Eur. Arch. Psychiatry Clin. Neurosci., 2001, 251, 159 CrossRef.
- M. Nedergaard, Science, 1994, 263, 1768 CrossRef CAS.
- J. Xie, M. R. MacEwan, X. Li, S. E. Sakiyama-Elbert and Y. Xia, ACS Nano, 2009, 3, 1151 CrossRef CAS.
- J. L. McKenzie, M. C. Waid, R. Shi and T. J. Webster, Biomaterials, 2004, 25, 1309 CrossRef CAS.
Footnote |
| † Electronic supplementary information (ESI) available: Detailed experimental procedures, additional SEM data and AFM analysis. See DOI: 10.1039/c0nr00666a |
| This journal is © The Royal Society of Chemistry 2011 |