Surface molecular imprinting onto fluorescein-coated magnetic nanoparticles via reversible addition fragmentation chain transfer polymerization: A facile three-in-one system for recognition and separation of endocrine disrupting chemicals†
Ying
Li
ac,
Cunku
Dong
a,
Jia
Chu
a,
Jingyao
Qi
b and
Xin
Li
*ab
aDepartment of Chemistry, Harbin Institute of Technology, Harbin, 150090, China. E-mail: lixin@hit.edu.cn; Fax: +86 451 86418750; Tel: +86 451 8628 2153
bState Key Lab of Urban Water Resource and Environment, Harbin Institute of Technology, Harbin, 150090, China
cCollege of Environmental and Chemical Engineering, Tianjin Polytechnic University, Tianjin, 300160, China
First published on 10th November 2010
Abstract
In this study, we present a general protocol for the making of surface-imprinted magnetic fluorescence beads via reversible addition-fragmentation chain transfer polymerization. The resulting composites were characterized by X-ray diffraction analysis, transmission electron microscopy, scanning electron microscopy, fluorescence spectroscopy, Fourier transform infrared spectroscopy, and energy dispersive spectroscopy. The as-synthesized beads exhibited homogeneous polymer films (thickness of about 5.7 nm), spherical shape, high fluorescence intensity and magnetic property (Magnetization (Ms) = 3.67 emu g−1). The hybrids bind the original template 17β-estradiol with an appreciable selectivity over structurally related compounds. In addition, the resulting hybrids performed without obvious deterioration after five repeated cycles. This study therefore demonstrates the potential of molecularly imprinted polymers for the recognition and separation of endocrine disrupting chemicals.
1. Introduction
In the past few years, the molecular imprinting technique1,2 has been considered as an attractive method to develop artificial receptors obtained with molecularly imprinted polymers (MIPs). MIPs are characterized by their capability of binding target molecules with high affinity and selectivity, which are similar to those of natural receptors.3 Because of the super-cross-linked nature, MIPs are stable to physical and chemical treatment, including high temperature, pressure, extreme pH, organic solvents, acids, and bases.4 However, in conventional molecular imprinting, MIPs were generally synthesized by free radical polymerization, while the rate of chain propagation cannot be controlled and polymers generally have a broad size distribution due to side reactions. These MIPs often exhibited high affinity and selectivity but low capacity and poor site accessibility for the target molecule.5 To solve this problem, the reversible addition-fragmentation chain transfer (RAFT) polymerization techniques emerged. This methodology allows the synthetic tailoring of macromolecules with complex architectures with predetermined molecular weight, terminal functionality, and narrow molecular weight distribution.6,7 Recently, significant interest has been attracted in the use of RAFT for the preparation of MIPs.8–12 In general, the two most promising areas in which MIPs could be commercially applied are separation, assays and sensors.13 To the best of our knowledge, however, there have been no reports on MIPs that meet the two requirements simultaneously.Recently, new separation methods based on the use of magnetic nanomaterials have turned out to be simple, convenient, and powerful approaches for the separation and purification of biosamples, targeted drug delivery, and removal of toxic pollutants in water.14 In general, the success of this method is attributed to the fact that the magnetic materials possess unique magnetic properties and can be separated from the samples simply by applying an appropriate magnetic field. As a valuable detection method, optosensing systems and, in particular, fluorescent techniques have gained growing attention since they offer the advantages of high sensitivity, low detection limits and a low cost measurement system. Furthermore, there is no need for a reference signal and there is the possibility of remote monitoring.15–17
It was conceivable that, if three promising concepts (molecular imprinting, magnetic separation, and optical detection) were combined, a novel fluorescein isothiocyanate (FITC)-labelled magnetic MIP could be constructed that exhibits high sensitivity and selectivity. Herein, we report success in the design of a well-defined nanosphere with a double-layer core-shell structure consisting of a Fe3O4 nanoparticle core, an inner layer of FITC and an outer layer of MIP, for simultaneous separation and recognition of estrogenic disrupting chemicals (EDCs). The three-in-one system not only provides the source of fluorescence but also improves the fluorescence selectivity of the FITC. Meanwhile, the superparamagnetism of the incorporated Fe3O4 nanoparticles allows magnetic separation to replace the centrifugation and filtration step in a convenient and economical way.
In this work, we report synthesis of selective MIPs for the quantitative determination of 17β-estradiol (E2). E2 is one of the EDCs, and can be linked to a variety of adverse effects in both humans and wildlife, including hormone-dependent cancers, reproductive system disorders, and reduction in reproductive fitness.18,19 MIPs have been applied to EDCs and to various matrices.20–25 The synthesis of the three-in-one beads via a multistep procedure is illustrated in Scheme 1, which involves synthesis of Fe3O4 nanoparticles, silica-shell deposition, attachment of FITC onto the silica surface, silica-shell deposition again, MIP-functionalization onto the silica surface, and final extraction of E2 and generation of the recognition site. The as-synthesized nanocomposites showed a high affinity, selectivity, and easy separation behavior.
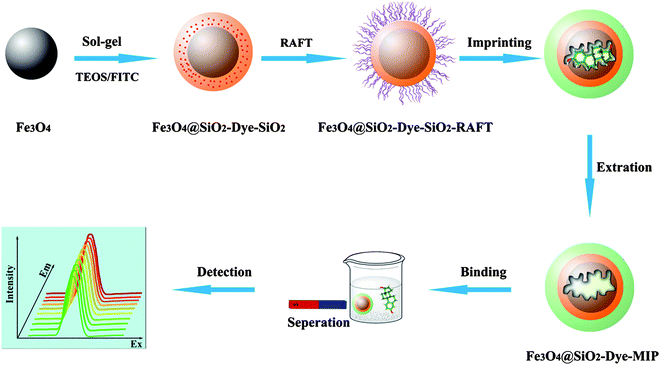 | ||
| Scheme 1 Synthesis route of core-shell FITC-labelled magnetic MIP beads and their application for separation and recognition of EDCs. | ||
2. Experimental
2.1 Materials and reagents
3-Aminopropyl-trimethoxysilane (APS) and fluorescein isothiocyanate (FITC) were purchased from Alfa Aesar. Methacrylic acid (MAA) was provided by the Shanpu Chemical Co., Ltd. (Shanghai, China). Tetraethyl orthosilicate (TEOS) was purchased from the Bodi Chemical Reagent Co., Ltd. (Tianjin, China). Divinylbenzene (DVB), bisphenol A (BPA), and azobisisobutyronitrile (AIBN) were purchased from the Guangfu Chemical Industry (Tianjin, China). 2,4-Dichlorophenol (2,4-DCP) and 4-chlorophenol were obtained from the Shanghai Chemical Industry (Shanghai, China). Chromatographically pure toluene was obtained from the Kermel Chemical Reagent Co., Ltd. (Tianjin, China). All chemicals were of the highest purity commercially available and were used without further purification.2.2 Preparation of three-in-one beads
![[thin space (1/6-em)]](https://www.rsc.org/images/entities/char_2009.gif) :
:![[thin space (1/6-em)]](https://www.rsc.org/images/entities/char_2009.gif) 1, v/v) solution until no template molecule (E2) was detected in the wash solutions. E2 was analyzed using a high performance liquid chromatograph (HPLC) equipped with a fluorescence detector (Agilent).
1, v/v) solution until no template molecule (E2) was detected in the wash solutions. E2 was analyzed using a high performance liquid chromatograph (HPLC) equipped with a fluorescence detector (Agilent).
As a reference, non-imprinted polymer coated beads (Fe3O4@SiO2-Dye-NIP), which did not contain the template, were also prepared in parallel with the Fe3O4@SiO2-Dye-MIP by using the same synthetic protocol.
2.3 Apparatus and characterization
X-Ray diffraction (XRD) analysis was recorded on a XRD-6000 X-ray diffractometer (Shimadzu) with Cu Kα radiation (λ = 1.5406 Å). Fourier transform infrared (FT-IR) spectra were measured on an Avatar 360 (Nicolet) spectrometer using a KBr thin pellet containing the sample. Transmission electron microscope (TEM) micrographs were obtained on a Tecnai G20 (Philip) electron microscope operated at 80 KV. Scanning electron microscope (SEM) images were obtained on a S4800HSD (Hitachi) microscope. The energy dispersive spectrum (EDS) was measured by using a SEM equipped with an EDAX-PHOE-NIX energy spectrum probe. Magnetic properties were measured with a LakeShore 7307 (Lakeshore Cryotronic) vibration sample magnetometer (VSM) at 300 K. The fluorescence microscopy digital images of the particles were acquired by using the inverted fluorescence microscope (Carl Zeiss, Germany).2.4 Fluorescence measurements
The samples for the spectra measurements were prepared by dispersing 2.0 mg of Fe3O4@SiO2-Dye-MIP particles in 1.0 mL alcohol solution. 50.0 μL of the solutions were then poured into various amounts of the E2 (final concentration 0 μM–20 μM) in ethanol. The mixture was stirred thoroughly before measurement. Fluorescence spectra were measured with a JASCO FP-6500 spectrophotometer under a 455 nm excitation light source.The samples of Fe3O4@SiO2-Dye-NIP were measured as described above.
2.5 Competitive adsorption and reuse
To evaluate the competitive adsorption, 4 mg of Fe3O4@SiO2-Dye-MIP and Fe3O4@SiO2-Dye-NIP microspheres were separately dispersed into 2 mL of ethanol solutions by ultrasonic treatment. Following this, 50 μL of Fe3O4@SiO2-Dye-MIP and Fe3O4@SiO2-Dye-NIP solutions were separately added into 2 mL of 5 μmol L−1 E2, 4-chlorophenol, 2,4-DCP and BPA solutions, respectively.In order to evaluate the regeneration for MIP, 5 μM E2 solutions were first prepared. 200 mg of Fe3O4@SiO2-Dye-MIP beads were added into 100 mL of E2 solution and incubated for 2 h before measurement. After the test, the MIP beads containing E2 were washed with methanol-acetic acid solution and collected by an external magnetic field, and rinsed with Milli-Q (MQ) water and added into above solutions for the next regeneration process.
3. Results and discussion
3.1 Characterization of the Fe3O4@SiO2-Dye-MIP
The SEM and TEM images of samples magnetite, Fe3O4@SiO2, Fe3O4@SiO2-Dye-SiO2 and Fe3O4@SiO2-Dye-MIP are shown in Fig. 1. Fig. 1a shows the SEM image of the uncoated Fe3O4 microsphere. This image reveals a relatively uniform size distribution with a mean diameter of about 330 nm. The surface of Fe3O4 microspheres was then transformed into silica shell by a sol–gel process using tetraethoxysilane (TEOS) to obtain silica-Fe3O4 composites (Fe3O4@SiO2, Fig. 1b). The inert (first) shell provides iron oxide nanoparticles with a silica-like surface which favors not only coating with FITC, but also the separation of fluorescein from the magnetite for protecting the FITC from quenching by Fe3O4 magnetite. Fig. 1c displays the structure of Fe3O4@SiO2-FITC beads after the second SiO2 coating (Fe3O4@SiO2-Dye-SiO2). As mentioned above, the outer protective shell not only provides a silica-like surface for further grafting with MIP, but also effectively isolates FITC from aggregating. Fig. 1d suggests the successful preparation of Fe3O4@SiO2-Dye-MIP with an even surface morphological feature after a step-by-step coating procedure. The polymer layer had a thickness of about 5.7 nm and appeared to be uniform (top inset), which could be attributable to the intrinsic characteristics of the controlled/living polymerization mechanism of RAFT.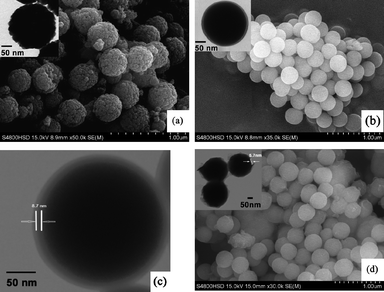 | ||
| Fig. 1 The SEM and TEM images of Fe3O4 (a), Fe3O4@SiO2 (b). The TEM image of Fe3O4@SiO2-Dye-SiO2 (c). The SEM and TEM images of Fe3O4@SiO2-Dye-MIP (d). | ||
The structural properties of synthesized Fe3O4@SiO2-Dye-MIP beads were analyzed by X-ray diffraction (XRD). As shown in Fig. 2, XRD patterns of the magnetite, Fe3O4@SiO2, Fe3O4@SiO2-Dye-SiO2, and Fe3O4@SiO2-Dye-MIP display several relatively strong reflecting peaks in the 2θ region of 10–80°. The peak positions were unchanged while their widths had increased, indicating that the crystal structure of the magnetite was unchanged.
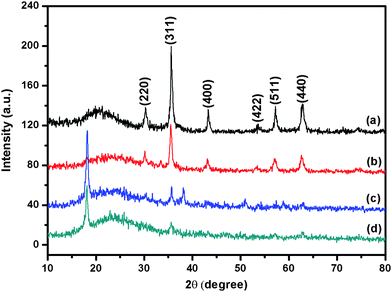 | ||
| Fig. 2 XRD patterns of Fe3O4 (a), Fe3O4@SiO2 (b), Fe3O4@SiO2-Dye-SiO2 (c), and Fe3O4@SiO2-Dye-MIP (d). | ||
Compared in Fig. 3 are the FT-IR spectra of Fe3O4, Fe3O4@SiO2-Dye-SiO2, Fe3O4@SiO2-Dye-SiO2–Cl, Fe3O4@SiO2-Dye-SiO2-RAFT, Fe3O4@SiO2-Dye-MIP after E2 extraction, and Fe3O4@SiO2-Dye-MIP after binding of E2. In Fig.3a, iron oxide showed its characteristic absorptions at 572 cm−1. The observed features around 1098 cm−1 indicated Si–O–Si stretching vibrations. The bands around 803 cm−1 is attributed to Si–O vibrations (Fig. 3b). In Fig. 3c, the characteristic absorptions (C–Cl bond stretching vibration) at 675 cm−1 suggested that chloromethylphenyl has been grafted onto the surface of Fe3O4@SiO2-Dye-SiO2. In Fig. 3d, the band at 1219 cm−1 (C–S–C bond stretching vibration) and 1161 cm−1(C![[double bond, length as m-dash]](https://www.rsc.org/images/entities/char_e001.gif) S bond stretching vibration) appeared, while the C–Cl stretching band disappeared. These bands showed that the Fe3O4@SiO2-Dye-SiO2-Cl has converted to the Fe3O4@SiO2-Dye-SiO2-RAFT agent successfully. The absorption band at 1721 cm−1, which is the characteristic C
S bond stretching vibration) appeared, while the C–Cl stretching band disappeared. These bands showed that the Fe3O4@SiO2-Dye-SiO2-Cl has converted to the Fe3O4@SiO2-Dye-SiO2-RAFT agent successfully. The absorption band at 1721 cm−1, which is the characteristic C![[double bond, length as m-dash]](https://www.rsc.org/images/entities/char_e001.gif) O bond stretching vibration of MAA, is strengthened distinctly. At the same time, the O–H bending band has appeared at 1405 cm−1 (Fig. 3e). These FT-IR spectra suggested that the Fe3O4@SiO2-Dye-MIP has been successfully prepared. In the case of Fe3O4@SiO2-Dye-MIP after the binding treatment (Fig. 3f), the characteristic peaks of E2 at 3649 cm−1 (O–H bond stretching vibration) appeared. This result suggested that the MIP was grafted onto the surface of Fe3O4@SiO2-Dye-SiO2.
O bond stretching vibration of MAA, is strengthened distinctly. At the same time, the O–H bending band has appeared at 1405 cm−1 (Fig. 3e). These FT-IR spectra suggested that the Fe3O4@SiO2-Dye-MIP has been successfully prepared. In the case of Fe3O4@SiO2-Dye-MIP after the binding treatment (Fig. 3f), the characteristic peaks of E2 at 3649 cm−1 (O–H bond stretching vibration) appeared. This result suggested that the MIP was grafted onto the surface of Fe3O4@SiO2-Dye-SiO2.
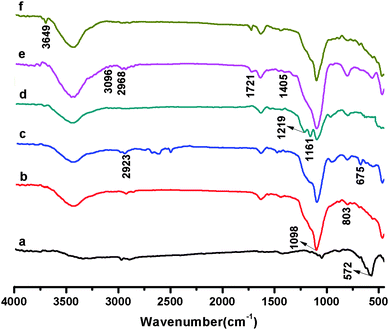 | ||
| Fig. 3 FT-IR spectra of Fe3O4 (a), Fe3O4@SiO2-Dye-SiO2 (b), Fe3O4@SiO2-Dye-SiO2-Cl (c), Fe3O4@SiO2-Dye-SiO2-RAFT (d), Fe3O4@SiO2-Dye-MIP after E2 extraction (e), and Fe3O4@SiO2-Dye-MIP after binding of E2 (f). | ||
The EDS analysis was also conducted to confirm the existence of imprinted polymer. For the Fe3O4, only Fe and O signals appeared, in accordance with its elemental composition (Fig. 4a), while the element species and percentage of each element changed greatly after coating (Fig. 4b). The emergence of the S signal in Fig. 4c provides additional evidence for the presence of grafted polymer.
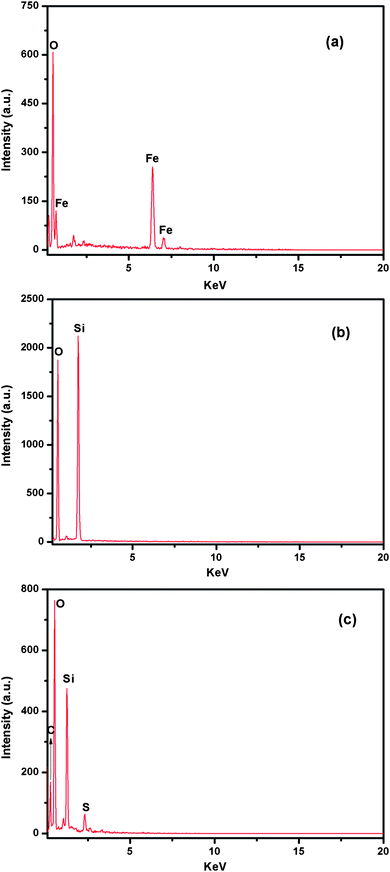 | ||
| Fig. 4 EDS spectra of Fe3O4 (a), Fe3O4@SiO2-Dye-SiO2 (b), and Fe3O4@SiO2-Dye-MIP (c). | ||
3.2 Magnetic properties of Fe3O4@SiO2-Dye-MIP
Magnetic measurements of Fe3O4@SiO2-FITC-MIP beads were carried out using a VSM at 300 K. As shown in Fig. 5, the saturation magnetization of these particles reached 3.67 emu g−1. This saturation magnetization value was far less than that of the pure Fe3O4 nanoparticles (93.49 emu g−1, Fig. S1). This can be explained by considering the presence of two silica shells, leading to a weakening of the magnetic moment. However, this magnetic property remained magnetic enough to meet the need of magnetic separation, as can be observed in Fig. 5 (bottom inset). When the microspheres are placed in an external magnetic field, efficient magnetic separation is observed in a short time (about 85 s).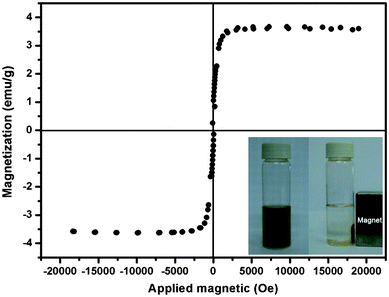 | ||
| Fig. 5 The hysteresis loop of Fe3O4@SiO2-Dye-MIP beads (saturation magnetization is 3.67 emu g−1). The inset shows the separation and redispersion process of a solution of Fe3O4@SiO2-Dye-MIP in the absence (left) and presence (right) of an external magnetic field. | ||
3.3 Fluorescence properties of Fe3O4@SiO2-Dye-MIP
Fig. 6a and 6b show the fluorescence microscopy image of Fe3O4@SiO2-Dye-MIP beads, which suggests that the fluorescence intensity is high. To further study the fluorescence property of the beads, the fluorescence emission spectra of FITC, Fe3O4@SiO2-Dye-SiO2, and Fe3O4@SiO2-Dye-MIP beads were recorded (Fig. 6c). It was observed that the peak position of fluorescence emission for the Fe3O4@SiO2-Dye-SiO2 beads was about 518 nm, a blue shift of 7 nm as compared to the free FITC in water (525 nm). This slight blue shift in the fluorescence spectra might be responsible for the difference of the FITC environments in water and in the beads. This small blue shift could be the result of the dielectric environment of FITC molecules changing upon coating with an additional silica shell. However, the MIP layer has little effect on the wavelength of fluorescence emission. Quantitative analysis of E2 was performed by monitoring the fluorescence emission intensity at 518 nm of the aqueous medium after magnetic separation.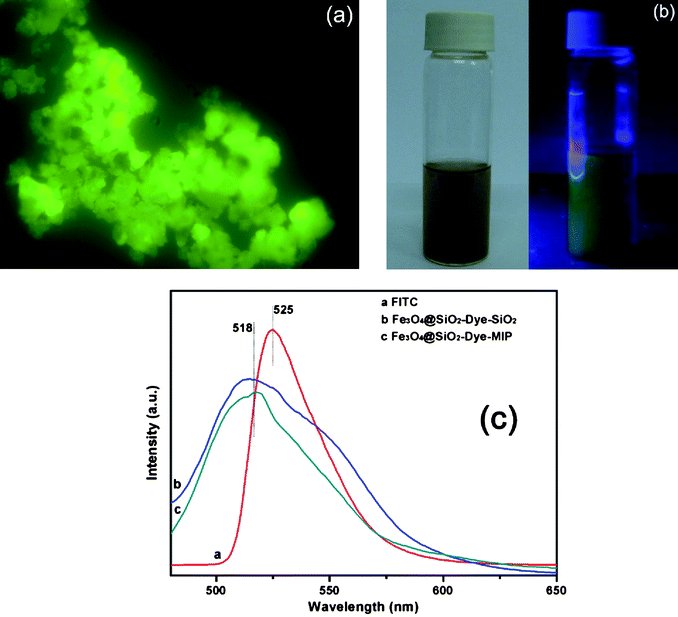 | ||
| Fig. 6 A fluorescence microscopy image of Fe3O4@SiO2-Dye-MIP microspheres (a). The images of Fe3O4@SiO2-Dye-MIP under normal light (left) and UV light (right) (b). Fluorescence emission spectra of FITC, Fe3O4@SiO2-Dye-SiO2 and Fe3O4@SiO2-Dye-MIP (c). | ||
As can be seen in Fig.7a, the fluorescence intensity decreased with the initial concentration of E2. As shown in the inset of Fig.7a, a linear calibration plot of the fluorescence intensity against the concentration of E2 was observed in the range of 0–20 μM with a correlation coefficient of 0.9925. The linear regression equation was (I0/I) − 1 = 0.04428C + 0.04396 (where C is the concentration of E2 in μM, and (I0/I) − 1 is relative fluorescence intensity). The limit of detection is evaluated using 3σ/S, and is found to be 0.19 μM, where σ is the standard deviation of the blank signal, and S is the slope of the linear calibration plot. Both the prepared MIP- and NIP-(non-molecular imprinted polymer) beads show spectroscopic response to the template molecule. However, MIP-beads exhibited about twice the fluorescence intensity variation toward E2 as that of the NIP-beads (Fig. 7b).
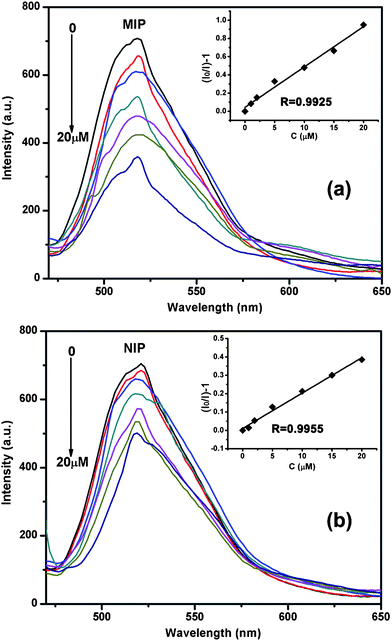 | ||
| Fig. 7 The fluorescence spectra of MIP-beads in different concentrations of E2. The inset is the linear relationship between the quenching efficiency (1 − I/I0) and E2 concentration in the range of 0–20 μM (a). The fluorescence spectra of NIP-beads in different concentrations of E2. The inset is the linear relationship between the quenching efficiency and E2 concentration in the range of 0–20 μM (b). Concentration: 0 μM, 1 μM, 2 μM, 5 μM, 10 μM, 15 μM, and 20 μM. | ||
To explore the fluorescence quenching mechanism of Fe3O4@SiO2-Dye-MIP beads with E2, the Stern–Volmer equation was used to evaluate the quenching efficiency for the “three-in-one” system, as follow:
| (I0/I) −1 = KSV[E2] | (1) |
The calibration plot of quenching efficiency (1 - I/I0) versus [E2] shows a good linear relationship (R = 0.9925) for E2 concentration in the range from 0 to 20 μM (top inset of Fig. 7a). The linear Stern–Volmer relationship suggested that the quenching arises from either a static mechanism by the quenching of a bound complex or a dynamic mechanism by the quenching of a bimolecular collision of the excited states.29 In the case of Fe3O4@SiO2-Dye-MIP beads, the specific binding effect between E2 and the recognition site leads to the strong adsorption of E2 at the surface of the silica shell, leading to the fluorescence resonance energy transfer (FRET) behavior from FITC donor to non-emissive MIP acceptor through their polar-polar interactions at close proximity, and confirming that static quenching is a predominant process. The higher quenching efficiency of the “three-in-one” system resulted from its specific binding affinity of E2 due to an efficient imprinting effect.
3.4 Competitive adsorption and reuse
To further evaluate the selectivity of the Fe3O4@SiO2-Dye-MIP beads, the potential interference of several structurally related compounds upon the determination of E2 were studied and compared (Fig. 8). The results showed that none of the compounds being evaluated gave any significant interference. The higher selectivity for E2 resulted from its specific binding affinity of E2 due to an efficient surface imprinting effect. Furthermore, the Fe3O4@SiO2-Dye-MIP beads have demonstrated that they can be reused for at least up to 5 times without significant loss of magnetic moment and signal intensity (Fig. 9).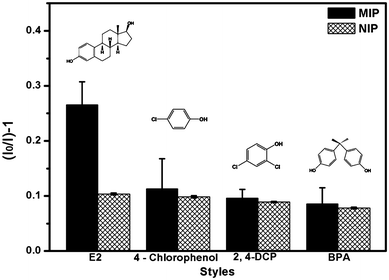 | ||
| Fig. 8 Effect of potential competitor on the detection of E2 (2.4-DCP: 2, 4-dichlorophenol; BPA: bisphenol A). | ||
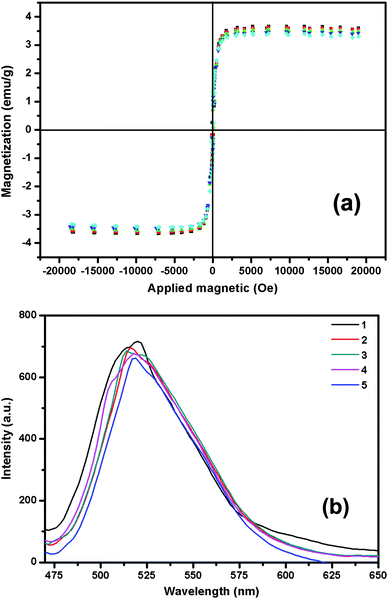 | ||
| Fig. 9 Effect of re-use of Fe3O4@SiO2-Dye-MIP on magnetic moment (a) and fluorescence intensity (b). | ||
4. Conclusion
In this study, we have demonstrated multifunctional “three-in-one” beads comprising an iron oxide core, a fluorescent dye layer, and a MIP layer in one system. The combination of the magnetism, excellent fluorescence and higher selectivity not only makes the “three-in-one” system applicable to selective detection of nonfluorescent EDCs without the need for any inducers and derivatization, but also improves the separation potential of molecular imprinting.Acknowledgements
We are grateful for financial support from the National Natural Science Foundation of China (50878061, 21076051), and the State Key Laboratory of Urban Water Resource and Environment, Harbin Institute of Technology (2010TS06).References
- K. Mosbach, Trends Biochem. Sci., 1994, 19, 9–14 CrossRef CAS.
- G. Wulff, Angew. Chem., Int. Ed. Engl., 1995, 34, 1812–1832 CrossRef CAS.
- J. O. Mahony, K. Nolan, M. R. Smyth and B. Mizaikoff, Anal. Chim. Acta, 2005, 534, 31–39 CrossRef CAS.
- P. A. G Cormack and A. Z. Elorza, J. Chromatogr., B: Anal. Technol. Biomed. Life Sci., 2004, 804, 173–182 CrossRef CAS.
- Y. Chen, M. Kele, P. Sajonz, B. Sellergren and G. Guiochon, Anal. Chem., 1999, 71, 928–938 CrossRef CAS.
- J. Chiefari, Y. K. Chong, F. Ercole, J. Krstina, J. Jeffery, T. P. T. Le, R. T. A. Mayadunne, G. F. Meijs, C. L. Moad, G. Moad, E. Rizzardo and S. Thang, Macromolecules, 1998, 31, 5559–5562 CrossRef CAS.
- A. B. Lowe and C. L. McCormick, Prog. Polym. Sci., 2007, 32, 283–351 CrossRef CAS.
- Y. Li, X. Li, C. K. Dong, Y. Q. Li, P. F. Jin and J. Y. Qi, Biosens. Bioelectron., 2009, 25, 306–312 CrossRef CAS.
- Y. Li, W. H. Zhou, H. H. Yang and X. R. Wang, Talanta, 2009, 79, 141–145 CrossRef CAS.
- C. H. Lu, W. H. Zhou, B. Han, H. H. Yang, X. Chen and X. R. Wang, Anal. Chem., 2007, 79, 5457–5461 CrossRef CAS.
- G. E. Southard, K. A. Van Houten and E. W.O. Jr., G.M., Anal. Chim. Acta, 2007, 581, 202–207 CrossRef CAS.
- M. M. Titirici and B. Sellergren, Chem. Mater., 2006, 18, 1773–1779 CrossRef CAS.
- S. A. Piletsky, S. Alcock and A. P. F. Turner, Trends Biotechnol., 2001, 19, 9–12 CrossRef CAS.
- A. H. Lu, E. L. Salabas and F. Schüth, Angew. Chem., Int. Ed., 2007, 46, 1222–1244 CrossRef CAS.
- O. Y. F. Henry, D. C. Cullen and S. A. Piletsky, Anal. Bioanal. Chem., 2005, 382, 947–956 CrossRef CAS.
- C. C. Mi, J. P. Zhang, H. Y. Gao, X. L. Wu, M. Wang, Y. F. Wu, Y. Q. Di, Z. R. Xu, C. B. Mao and S. K. Xu, Nanoscale, 2010, 2, 1141–1148 RSC.
- G. R. Sun, M. Y. Berezin, J. D. Fan, H. Lee, J. Ma, K. Zhang, K. L. Wooley and S. Achilefu, Nanoscale, 2010, 2, 548–558 RSC.
- H. Greim, Angew. Chem., Int. Ed., 2005, 44, 5568–5574 CrossRef CAS.
- Y. Suzuki, A. Kubota, T. Furukawa, K. Sugamoto, Y. Asano, H. Takahashi, T. Sekito and Y. Dote, J. Hazard. Mater., 2009, 165, 677–682 CrossRef CAS.
- Y. Li, X. Li, Y. Q. Li, J. Y. Qi, J. Bian and Y. X. Yuan, Environ. Pollut., 2009, 157, 1879–1885 CrossRef CAS.
- P. Fernández-álvarez, M. Le Noir and B. Guieysse, J. Hazard. Mater., 2009, 163, 1107–1112 CrossRef CAS.
- D. K. Alexiadou, N. C. Maragou, N. S. Thomaidis, G. A. Theodoridis and M. A. Koupparis, J. Sep. Sci., 2008, 31, 2272–2282 CrossRef CAS.
- Z. B. Zhang and J. Y. Hu, Water Res., 2008, 42, 4101–4108 CrossRef CAS.
- L. N. Mathieu, A. S. Lepeuple, B. Guieysse and B. Mattiasson, Water Res., 2007, 41, 2825–2831 CrossRef.
- Z. Meng, W. Chen and A. Mulchandani, Environ. Sci. Technol., 2005, 39, 8958–8962 CrossRef CAS.
- H. Deng, X. L. Li, Q. Peng, X. Wang, J. P. Chen and Y. D. Li, Angew. Chem., Int. Ed., 2005, 44, 2782–2785 CrossRef CAS.
- C. L. Fang, K. Qian, J. Zhu, S. Wang, X. Lv and S. H. Yu, Nanotechnology, 2008, 19, 125601 CrossRef.
- A. Imhof, M. Megens, J. J. Engelberts, D. T. N. de Lang, R. Sprik and W. L. Vos, J. Phys. Chem. B, 1999, 103, 1408–1415 CrossRef CAS.
- J. R. Lakowicz, Principles of Fluorescence Spectroscopy, Springer, USA, 3rd edn, 2008, pp. 277–318 Search PubMed.
Footnote |
| † Electronic supplementary information (ESI) available: Supplementary figure S1. The hysteresis loop of Fe3O4 (a), Fe3O4@SiO2 (b), and Fe3O4@SiO2-Dye-SiO2 (c). See DOI: 10.1039/c0nr00614a |
| This journal is © The Royal Society of Chemistry 2011 |
