ZnO nanocone: Application in fabrication of the smallest whispering gallery optical resonator
Y. H.
Yang
,
Y.
Zhang
,
N. W.
Wang
,
C. X.
Wang
,
B. J.
Li
and
G. W.
Yang
*
State Key Laboratory of Optoelectronic Materials and Technologies, Institute of Optoelectronic and Functional Composite Materials, Nanotechnology Research Center, School of Physics & Engineering, Sun Yat-sen University, Guangzhou, 510275, Guangdong, P. R. China. E-mail: stsygw@mail.sysu.edu.cn
First published on 15th November 2010
Abstract
ZnO semiconductors at the micro- and nanometre scales are attractive in optical, magnetic, and electronic applications because of their particular features and excellent properties. The whispering gallery mode (WGM) is a general and effective type to amplify the intensity of the luminescence emission, and has gained extensive application in lasing and microcavities. In this contribution, we reported that the smallest whispering gallery optical resonator has been achieved in an individual ZnO nanocone whose diameter gradually reduces from bottom to top in the range of 700 to 50 nm. Using the monochromatic cathodoluminescence (CL) equipment attached at a scanning electron microscopy, we observed the alternating patterns of bright and dark rings from the monochromatic CL image of an individual ZnO nanocone, which is attributed to the WGM-like enhanced luminescence emission when the ZnO nanocone is considered as an optical resonator. The smallest mode number of WGM, N = 0, was observed in the ZnO nanocone with a radius of 55 nm for the considered light wavelength of 380 nm, and with a radius of 81 nm for the considered light wavelength of 500 nm, respectively. These results showed that the smallest whispering gallery optical resonator from an individual ZnO nanocone has been fabricated. Experiments are in good agreement with both theoretical predictions and computer simulations based on the finite-difference time domain method with perfectly matched layer boundary conditions. These findings provided valuable information for applications of ZnO micro- and nanostructures in optoelectronic devices.
1. Introduction
ZnO nanostructures have attracted considerable interest due to potential applications in micro- and nanooptoelectronics.1 As an important part of optical devices, the resonator has been extensively used and played an important role in many technical applications. Along with the miniaturization within the field of optoelectronics, small-scale resonators applicable to optical devices have gained much attention.2–5 Recent researches of micro- and nanostructures such as ZnO microcolumns and microdisks as resonators have shown that the light wave can be considered to be confined due to the multiple total internal reflections at the resonator's boundary.2–8 For example, the micro- and nanocolumn resonator exhibits a Fabry-Perot (FP) type of resonance, in which the top and bottom facets of the micro- and nanostructure serve as two reflecting mirrors and the side facets provide the lateral confinement.8,9 Meanwhile, the nanostructure itself functions as both the gain medium and the optical resonator. However, this type of resonators cannot provide good confinement because of the limited reflection at the top and bottom facets and the high diffraction loss due to the small lateral size. Interestingly, the whispering gallery mode (WGM) offers an attractive means to enhance luminescence intensity in small-scale optical resonators,10,11 and the WGM lasing has been demonstrated in the hexagonal optical resonator.12–15 Generally, the light is confined due to the multiple total internal reflections along the optical resonator's boundary and the distribution of luminescence intensity is locally concentrated at the hexagonal boundary. However, the sizes of all these optical resonators are much larger than the considered light wavelength (≫200 nm).13–15 In order to create veritably small-scale optical devices, a small sized optical resonator is required, with a size comparable to or smaller than the considered light wavelength.12In this contribution, we report a systematic investigation of WGMs in an individual ZnO nanocone that acts as the hexagonal optical resonator using the monochromatic cathodoluminescence (CL) equipment attached to a scanning electron microscopy (SEM). Surprisingly, we observe the alternating patterns of bright and dark rings along the ZnO nanocone's length whose diameter gradually reduces from bottom to top in the range of 700 to 50 nm. Combining CL spectra analysis with computer simulations based on the finite-difference time-domain (FDTD) with perfectly matched layer (PML) boundary conditions, and geometric structure about the ZnO nanocone, we suggest that these alternating patterns of bright and dark rings are mostly attributed to the WGM-like enhanced luminescence emission when the ZnO nanocone is regarded as an optical resonator. Meanwhile, the small mode number N (namely the resonance interference order) is down to N = 0. In this case, the ZnO nanocone serves as both the active material and the optical resonator. Therefore, we, for the first time, achieve the smallest whispering gallery optical resonator from an individual ZnO nanocone with a radius of 55 nm for the considered light wavelength of 380 nm.
2. Experimental
In our studies, ZnO nanocones are prepared on amorphous carbons using thermal chemical vapor transport and condensation without any metal catalysts.16–18Field emission scanning electron microscopy (FESEM), X-ray diffraction (XRD) and transmission electron microscopy (TEM) are employed to characterize the morphology and structure of the prepared samples. The CL measurement of the ZnO nanocones is carried out at room temperature using a Gatan Mono-CL system attached FESEM with an accelerating voltage of 10 kV. The sample is excited by the focus electron beam as the excitation source. The collection of fluorescent signal is conducted by the collector probe and spectroanalysis instrument.3. Results and discussion
Fig. 1(a) shows the typical FESEM image of the as-prepared nanocones. Clearly, the diameter of these nanocones gradually reduces from bottom to top in the range of 700 to 50 nm. The corresponding XRD pattern (Fig. 1(b)) and TEM images (Fig. 1(c–d) show that these nanocones are indexed to be the typical hexagonal ZnO, and the growth direction is [0001].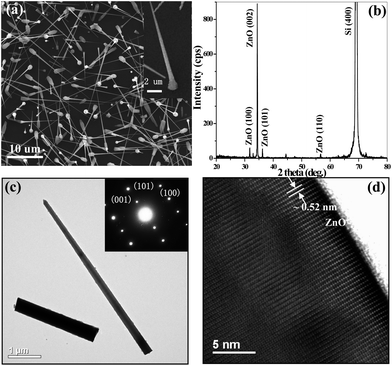 | ||
| Fig. 1 SEM image of ZnO nanocones on amorphous carbons (a), and the corresponding XRD pattern (b). TEM bright-field image (c) and the corresponding high resolution TEM image (d). | ||
Fig. 2(a) shows the panchromatic CL images of the ZnO nanocones. Clearly, we can see the alternating patterns of bright and dark rings along the ZnO nanocone's length in Fig. 2(a). The inset of Fig. 2(a) is the amplifying panchromatic CL image of an individual ZnO nanocone. According to the luminescence spectra of the ZnO nanocones (Fig. 2(d–e)), the monochromatic CL images at 380 and 500 nm of a single ZnO nanocone are shown in Fig. 2(b) and (c), respectively. These two monochromatic CL images of the ZnO nanocones also display the alternating patterns of bright and dark rings. Comparing Fig. 2(b) with (c), we can see that the positions of bright rings of these two monochromatic CL images are similar with a little bit of discrepancy. Further, the CL spectra of four points that are taken from the bright rings of a single ZnO nanocone are shown in Fig. 2(d–e), which is composed of two peaks at about 380 and 500 nm that are attributed to the near band-edge emission and the deep level emission affiliated with defects of the ZnO nanocone, respectively. In Fig. 2(d), the visible spectral range of luminescence gradually changes and the spectral maxima shift to high energy accompanied with the decreasing diameter along the ZnO nanocone's length. At the same time, a discontinuous redshift of spectral maximum with the decreasing diameter also exists. Therefore, these results means that the alternating patterns of bright and dark rings do not really originate from the crystal defects of the ZnO nanocones, such as surface state, including oxygen vacancy and point defect.
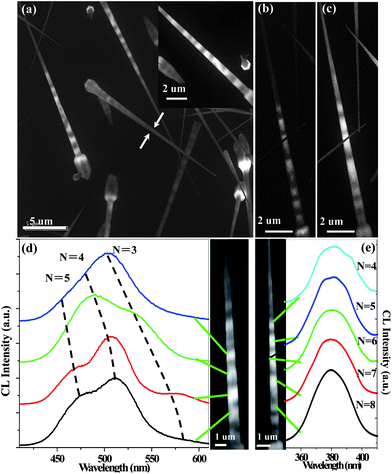 | ||
| Fig. 2 Panchromatic CL images of ZnO nanocones (a) and the monochromatic CL images of a single ZnO nanocone at the center wavelength of 380 nm (b) and 500 nm (c), respectively, and the corresponding normalized intensity CL emission spectra (d) of four points of the ZnO nanocone marked in the inset. | ||
Definitely, the alternating patterns of bright and dark rings are related to the mode of light transmission in the ZnO nanocones. Based on Wiersig's work about the long-lived modes in the hexagonal dielectric resonant cavity,19 the strong localization of intensity near the boundary is attributed to the WGM-like enhanced luminescence in the resonant cavity, in which the electromagnetic waves circulate with negligible loss due to the multiple total internal reflections at the resonator's boundary.13 Therefore, in our case, the cross section of the ZnO nanocones can be considered as the hexagonal optical resonator as shown in Fig. 3(a–b).
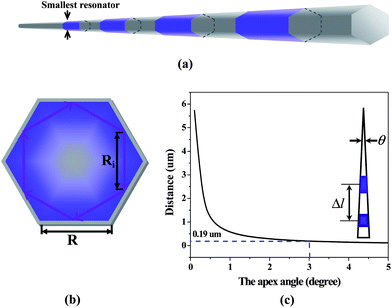 | ||
| Fig. 3 Schematic illustration of whispering gallery optical resonator of ZnO nanocone (a) and of light confined within a hexagon optical resonator (b). The distance Δl as a function of θ under θ = 3° when wavelength is 380 nm and the smallest radius difference (N = 0) between two adjacent bright rings is 5 nm (c). | ||
However, there are no FP mode enhanced emissions in the ZnO nanocone in our case. Generally, the FP resonator is composed of two opposite parallel reflected surfaces and the light is transported between the two opposite surfaces. In our case, the ZnO nanocone has a certain apex angle, which results in the two opposite side surfaces not being parallel. In such a tapered nanostructure, the top and down surface cannot form a typical FP resonator for light transport. Moreover, for the two opposite side surfaces, they are not parallel, which cannot provide good confinement because of the limited reflection at these two opposite surfaces. Thus, the FP modes hardly form in the ZnO nanocone.
In a WGM optical resonator, the light interferes with itself when it has completed one full circulation. If the total phase shift along the path is an integer multiple of 2π, the standing wave forms due to the continuous interference over the multiple circulations. Taking into account the phase shift of the total internal reflection,20 the constructive interference condition is12
 | (1) |
According to Fig. 2(d–e), in order to calculate the contribution of the WGM-enhanced luminescence that is centered at each resonant wavelength, here we set the index of refraction n = 2.54, 2.38 at 376 and 384 nm, and n = 2.01, 2.03, 2.04, 2.05, 2.06, 2.07 at 576, 522, 503, 490, 481, 471 nm, respectively, for the ZnO nanocones.21 According to eqn (1), with the same WGM number (N), the spectral peak gradually shifts to high energies accompanied with a decreasing diameter along the ZnO nanocone's length. When it goes beyond the visible spectral range, then the next lower resonance N − 1 will occur at lower energy that will show a discontinuous redshift of the spectral maximum. In Fig. 2(d), the spectral peaks fulfil the resonance condition and the shift of the spectral maxima is coincident with the conclusion of eqn (1). Thus, these results prove that the measured spectral modulation originates from the WGMs in the ZnO nanocone.3
However, a similar phenomenon cannot be seen in the UV spectral range in Fig. 2(e). The reason is that as the range of the ZnO UV luminescence band is relatively narrow, the blue shift of the spectral maxima with the same WGM number (N) in the UV luminescence band will be beyond the range of the CL spectrum (the ZnO UV luminescence is just in the range from 360 to 400 nm). Therefore, for the UV luminescence band, the shift of the spectral maxima to high energies will not be observed in our ZnO CL spectrum. Based on the calculations, the corresponding resonance interference orders (N) of the light transmitted in the ZnO optical resonator are marked in Fig. 2(d–e).
Additionally, Fig. 4 shows the CL spectra taken from the bright and dark rings in a ZnO nanocone, in the ultraviolet spectral range (a) and visible spectral range (b), respectively. The comparisons of these CL spectra taken from the bright (B) to dark (D) rings reveal that the light intensities from bright and dark rings are very different. The light intensities from dark rings are relatively weak, and the strong light intensities can be obtained from bright rings. These results shows that the light intensity is enhanced, which means that the constructive interference condition of light is satisfied and the resonance occurs in the bright rings. The cross section of ZnO nanocone is a regular hexagon, which further proves that WGMs happen in these bright rings, i.e. the hexagonal optical resonator.
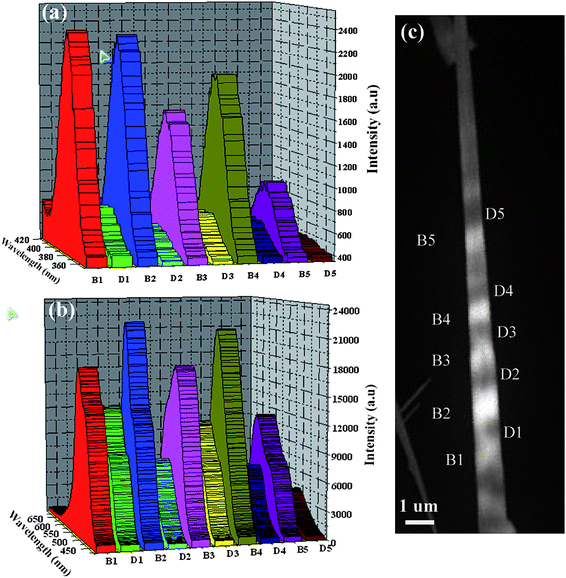 | ||
| Fig. 4 CL spectra from the bright and dark rings on a single ZnO nanocone in the UV spectral range (a) and visible spectral range (b), respectively. | ||
Fig. 5(a) shows the enlarged room-temperature CL spectrum in the UV region. This spectrum is taken from the bright ring of the ZnO nanocone with radius of about 210 nm. It shows that small peaks are superimposed on the spectrum of this bright ring of ZnO nanocone. Fig. 5(b) shows that this spectrum can be fitted to a sum of peaks by using the second derivative method, where each peaks represents an individual luminescence peak. Once the wavelength and the size of ZnO nanocone satisfy the criterion according to the eqn (1), then the enhanced coherence resonance of light will be generated. And this part of ZnO nanocones will be relatively bright in the CL images. Moreover, the Q factor, which can be calculated from Fig. 5(b) using Q = υ/Δυ, a full width half maximum at each resonant mode, is observed to be 3 nm. Thus, the Q factor is calculated to be 130 for the part of the ZnO nanocone for which the radius is 210 nm. In addition, the Q factor of a regular polygonal cavity can be written as:22
 | (2) |
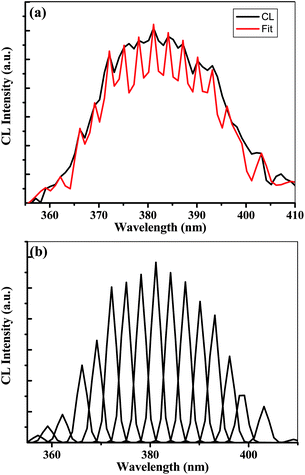 | ||
| Fig. 5 Enlarged room-temperature CL spectrum at the region of UV (a), a sum of peaks deduced from this CL spectrum by the second derivative method shown in (b). | ||
Moreover, we carry out two-dimensional (2D) FDTD simulations with the PML boundary conditions based on a 2D hexagonal optical resonator for the experimentally detected resonance. In our simulation process, the cavity radius is 55 and 210 nm, respectively. The former is the smallest bright ring in the monochromatic CL images at 380 nm, which is shown in the inset of Fig. 7(a). In addition, a TM polarized light point source is set in the cavity that is close to the boundary. The 2D simulations results are shown in Fig. 6. Considering that the SEM measurement error of the cavity size will cause the discrepancy of the real cavity size, these 2D simulations results show that the resonant peaks are consistent with our experimental results. In detail, for the cavity size R = 55 nm, the resonant peak is at 382 nm, and for the cavity size R = 207 nm, the resonant peak is at 382, 445 and 480 nm, respectively. Thus, these simulation results are almost matched with our experiments. Very importantly, the patterns of the computed mode profile for the corresponding optical resonator are shown in the insets of Fig. 5(a–b). From the mode profile, we can see that the light is confined in the hexagonal optical resonator.
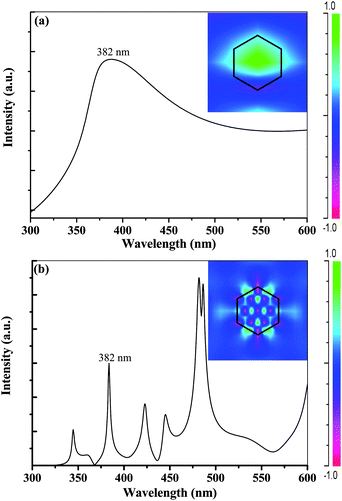 | ||
| Fig. 6 Two-dimensional finite-difference time-domain simulations based on a 2D hexagonal optical resonator for the experimentally detected resonance. The corresponding sizes of the cavity radius are 55 (a) and 210 nm (b). The patterns of computed mode profile are shown in the inset. | ||
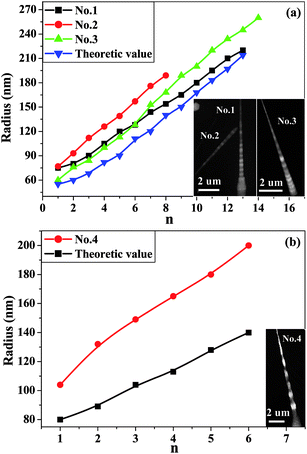 | ||
| Fig. 7 Comparisons between theoretical results based on eqn (1)–(3) and experimental data show the relationship between the radius of resonator (R) and the arisen sequence number (n) of the bright rings. Three ZnO nanocones (No. 1–3) show bright and dark rings at the center wavelength of 380 nm (a), and one ZnO nanocone (No. 4) displays a similar pattern at the center wavelength of 500 nm (b). | ||
Moreover, there is another situation that cannot be ignored. The light can be transported along the ZnO nanocone's length when the whole nanocone is excited by the high-energy electron-beam. Thus, a single ZnO nanocone can be an optical waveguide because the whole nanocone is excited. The number of wave conduction modes in the waveguide depends on the normalized frequency V. The wave conduction mode increase will be accompanied by an increase in the V value. V is given
 | (3) |
Furthermore, we analysed the distribution of different conduction modes of light in the ZnO nanocones. Although two optical conduction modes (TM and TE) are permitted, the TE mode cannot been observed in the ZnO nanocones.12,13 According to the above discussion, in Fig. 7, we choose four typical ZnO nanocones (No. 1–4) to calculate the conduction mode of light according to eqn (1) and (3) except for the TE mode. Clearly, the bright and dark rings of the ZnO nanocones (No. 1–3) appear at the center wavelength of 380 nm, and the smallest bright ring (radius of 55 nm) is from TM (N = 0) of the corresponding wavelength. In addition, the conduction mode (HE11) appears, which means that the light is transmitting along the ZnO nanocone's length. When the size of the waveguide decreases to the critical size of the corresponding wavelength (V = 2.405), other wave conduction modes will be liberated and the light intensity of this part will be enhanced. And then, TM (N = 1, 2…) of the corresponding wavelength gradually appears and also result in several bright rings along the ZnO nanocone's length. Similarly, for the ZnO nanocone (No. 4), the distribution of bright and dark rings exists at the center wavelength 500 nm, and the arisen sequence of the corresponding conduction mode of light is the same as that of ZnO nanocones (No. 1–3). Importantly, we can see that the theoretical calculations are consistent with the experimental observations as shown in Fig. 7(a–b), which further confirms that the bright and dark rings mainly originate from the WGMs-like enhanced luminescence in the optical resonator, i.e. the ZnO nanocones, and the smallest whispering gallery optical resonator of the ZnO nanocone with a radius of 55 nm for the considered light wavelength of 380 nm has been achieved. Accordingly, at a certain center wavelength, 380 nm or 500 nm, it is suggested that these alternating patterns of bright and dark will appear when the size of nanocones gradually changes according to eqn (1) and (3).
Although the geometrical mode of eqn (1) is usually applicable only for R ≫ λ, i.e.N ≫ 1.19 In our case, owing to the small size of the ZnO nanocones, i.e. the small optical resonator, we calculate the mode number down to N = 0 with this model. Note that the mode number N = 0 means that the total phase shift of the light wave along its path goes to zero and the light wave has no change of phase. Then, the wave interferes with its own reflection wave.
However, it seems that all the ZnO nanocones can show the alternating patterns of bright and dark rings in their CL images based on above mentioned discussions. In fact, not all ZnO nanocones have alternating patterns of bright and dark rings in their CL images in Fig. 2(a), and it can only be seen in the CL images when the geometric structure of ZnO nanocones meets a certain condition. In our case, the apex angle of nanocones with bight and dark rings must be smaller than 3° based on SEM image statistics. Based on eqn (1), the difference between two adjacent bright ring sizes is a certain value for the fixed wavelengths of light. As shown in Fig. 3(c), the distance Δl between two adjacent bright rings is determined by the apex angle θ of nanocones. In our case, the smallest radius difference between two adjacent bright rings is 5 nm, and thus Δl is 190 nm under θ = 3° and wavelength of 380 nm. Thus, our experiments show that we can visually see the alternating patterns between bright and dark rings in CL images only when Δl is larger than 190 nm. In other words, for the visualization of alternating patterns between bright and dark rings in CL image, 190 nm (Δl) is the smallest distance between two adjacent bright rings in our case. And it will be visually indistinguishable in CL images when Δl is less than 190 nm, i.e. the apex angle θ is larger than 3°. For example,16 we did not find alternating patterns between bright and dark rings in the CL image of the ZnO nanocone with an apex angle of 12°. Similarly, we do not see it in the ZnO nanocone (marked by the arrows) with an apex angle of 4° in Fig. 2(a).
4. Conclusion
In conclusion, we have, for the first time, achieved the smallest whispering gallery optical resonator from an individual hexagonal ZnO nanocone with a radius of 55 nm for the considered light wavelength of 380 nm. Using the monochromatic CL equipment attached to a SEM, we observed many novel luminescence emission behaviors from an individual ZnO nanocone, such as the alternating bright and dark rings along the ZnO nanocone's length. These unique CL images of the ZnO nanocone are attributed to the WGM-like enhanced luminescence emission for the small mode number N, in which the ZnO nanocone serves as both the active material and the optical resonator. For instance, the WGM in the hexagonal ZnO nanocones for the mode numbers down to N = 0 can be achieved, which implies that the smallest whispering gallery optical resonator from the ZnO nanocone with a radius of 55 nm for the considered light wavelength of 380 nm, and with a radius of 81 nm for the considered light wavelength of 500 nm, respectively, is achieved. Therefore, these interesting findings provided useful information for applications of ZnO nanostructures in optoelectronic devices.Acknowledgements
This work was supported by NSFC (U0734004) and the Ministry of Education. We thank Z. K. Tang of HKUST, C. J. Jin, H. Z. Wang, and J. Y. Zhou of SYSU for a number of useful discussions.References
- Y. W. Heo, D. P. Norton, L. C. Tien, Y. Kwon, B. S. Kang, F. Ren, S. J. Pearton and J. R. LaRoche, Mater. Sci. Eng., 2004, R47, 1 CAS.
- X. H. Han, G. Z. Wang, Q. T. Wang, L. Cao, R. B. Liu and B. S. Zou, Appl. Phys. Lett., 2005, 86, 223106 CrossRef.
- H. Q. Yan, J. Johnson, M. Law, R. R. He, K. Knutsen, J. R. Mckinner, J. Pham, R. Saykally and P. D. Yang, Adv. Mater., 2003, 15, 1907 CrossRef CAS.
- Y. C. Jian, J. J. Xiao and J. P. Huang, J. Phys. Chem. C, 2009, 113, 17170 CrossRef CAS.
- B. J. Seo, S. Kim, H. Fetterman, W. Steier, D. Jin and R. Dinu, J. Phys. Chem. C, 2008, 112, 7953 CrossRef CAS.
- Y. H. Tseng, H. Y. Lin, M. H. Liu, Y. F. chen and C. Y. Mou, J. Phys. Chem. C, 2009, 113, 18053 CrossRef CAS.
- N. W. Wang, Y. H. Yang and G. W. Yang, J. Phys. Chem. C, 2009, 113, 15480 CrossRef CAS.
- M. H. Huang, S. Mao, H. Feick, H. Q. Yan, Y. Y. Wu, H. Kind, E. Weber, R. Russo and P. D. Yang, Science, 2001, 292, 1897 CrossRef CAS.
- D. X. Zhao, Y. C. Liu, D. Z. Shen, Y. M. Li, L. G. Zhang and X. W. Fan, J. Appl. Phys., 2003, 94, 5605 CrossRef CAS.
- S. I. Shopova, G. Farca, A. T. Rosenbergera, W. M. S. Wickramanayake and N. A. Kotov, Appl. Phys. Lett., 2004, 85, 6101 CrossRef CAS.
- V. N. Astratov, J. P. Franchak and S. P. Ahsili, Appl. Phys. Lett., 2004, 85, 5508 CrossRef CAS.
- T. Nobis, E. M. Kaidashev, A. Rahm, M. Lorenz and M. Grundmann, Phys. Rev. Lett., 2004, 93, 103903 CrossRef.
- C. Kim, Y. J. Kim, E. S. Jang, G. C. Yi and H. H. Kim, Appl. Phys. Lett., 2006, 88, 093104 CrossRef.
- R. J. Zhang, S. Y. Seo, A. P. Milenin, M. Zacharias and U. Gosele, Appl. Phys. Lett., 2006, 88, 153120 CrossRef.
- D. Wang, H. W. Seo, C. C. Tin, M. J. Bozack, J. R. Williams and M. Park, J. Appl. Phys., 2006, 99, 093112 CrossRef.
- Y. H. Yang, X. Y. Chen, Y. Feng and G. W. Yang, Nano Lett., 2007, 7, 3879 CrossRef CAS.
- Y. H. Yang, B. Wang, C. X. Wang, Z. Y. Li, D. H. Chen, J. Chen, N. S. Xu, J. B. Xu and G. W. Yang, Appl. Phys. Lett., 2005, 87, 183109 CrossRef.
- Y. H. Yang, B. Wang, N. S. Xu and G. W. Yang, Appl. Phys. Lett., 2006, 89, 043108 CrossRef.
- J. Wiersig, Phys. Rev. A: At., Mol., Opt. Phys., 2003, 67, 023807 CrossRef.
- J. D. Jackson, Classical Electrodynamics, Wiley, New York, 1999 Search PubMed.
- K. Postava, H. Sueki, M. Aoyama, T. Yamaguchi, Ch. Ino, Y. Igasaki and M. Horie, J. Appl. Phys., 2000, 87, 7820 CrossRef CAS.
- A. K. Bhowmik, Appl. Opt., 2000, 39, 3071 CrossRef CAS.
| This journal is © The Royal Society of Chemistry 2011 |
