Forming transmembrane channels using end-functionalized nanotubes
Meenakshi
Dutt
,
Olga
Kuksenok
,
Steven R.
Little
and
Anna C.
Balazs
*
Chemical Engineering Department, University of Pittsburgh, Pittsburgh, PA 15261, USA. E-mail: balazs@pitt.edu
First published on 26th October 2010
Abstract
Using dissipative particle dynamics (DPD) simulations, we examine the interaction between amphiphilic nanotubes and lipid bilayer membranes. The nanotubes are represented by a hydrophobic shaft that is end-functionalized with hydrophilic groups. Nanotubes that are capped by a monolayer of hydrophilic beads or also encompass hydrophilic “hairs” on just one end of the shaft are found to spontaneously penetrate and assume a transmembrane position; the process, however, depends critically on the membrane tension. On the other hand, nanotubes that include hydrophilic hairs at both ends of the hydrophobic shaft are not observed to spontaneously self-organize into the bilayer. When the membrane is stretched to form a pore, the nanotubes with two hairy ends adsorb on the edge of the pore and become localized in the membrane, thus forming a transmembrane channel. The findings from these studies provide guidelines for creating biomimetic nanotube channels that are capable of selectively transporting molecules through the membrane in response to changes in the local environment.
I. Introduction
The functionality of transmembrane pores in regulating the transport of substances in and out of cells has inspired researchers to design analogous structures for controlling the selective passage of molecules through synthetic membranes. A possible route for creating selective synthetic pores is to insert end-functionalized carbon nanotubes (CNTs) vertically into the membranes so that the functional groups could be harnessed to control the migration of molecules. Indeed, investigators have recently used this approach to explore the rapid, single-file transport of water molecules through thick CNT-containing membranes and to investigate the selective transport of ions through these nanotubes.1 In the latter studies, the composite membrane was initiated by growing an aligned array of multi-walled CNTs viachemical vapor deposition, then cast by filling the volume between the CNTs with polystyrene (without disrupting the initial nanotube alignment), and the final structure was realized through removal of the resulting film from the quartz substrate viaHF etching.1 Alternatively, membranes that encompass layer-spanning, functionalized CNTs could potentially be formed through a simpler and less expensive self-assembly process. To provide guidelines for creating such structures, we use a coarse-grained computational technique to examine the interactions between nanotubes that are capped by short chains and a lipid bilayer in solution. Herein, we isolate architectures that enable the functionalized tubes to spontaneously penetrate and span the membrane so that the desired structures are created through self-organization. To the best of our knowledge, these are the first simulations to capture the approach, docking and absorption of end-functionalized cylinders into lipid bilayer membranes.To date, there have been a number of computational studies on the interactions of bare nanotubes (i.e., they do not encompass end-tethered chains) with tensionless membranes.2–7 These investigations have revealed how the hydrophobic nanotubes reorient to achieve their final transmembrane structure. The studies have also indicated how hydrophobic mismatch between the length of the tubes and the width of the bilayers affects the structure of the membrane.4–6 One area that has not, however, been extensively explored is the interaction of nanoscopic cylinders with membranes under tension.8 There are a number of processes that perturb the tension of biological and synthetic membranes,9 and in particular, can lead to undulated or wrinkled structures, which encompass a negative membrane tension. For example, negative membrane tensions can be induced by thermal variations,10,11 imposed flows,12lipid uptake,13 or active proteins embedded within the bilayers.14 Certain toxins also induce negative membrane tensions to facilitate their uptake into cells.15 On the other hand, micropipette techniques,10 which are commonly used to examine the properties of bilayers, induce a positive tension within the membrane.
We anticipate that the crowded lipids within a negative tension membrane would interact with inclusions differently than lipids within a tensionless membrane. Furthermore, the enhanced separation between the lipids for membranes under positive tension could also affect the interactions between the bilayer and potential inclusions. To test these hypotheses, we examine the insertion of bare and end-functionalized nanotubes into the bilayer for a range of membrane tensions, both negative and positive. As we show below for the various nanotubes considered herein, relatively small deviations from the tensionless state can cause significant variations in the nature of the insertion process.
To carry out this study, we use dissipative particle dynamics (DPD) simulations.16,17 The DPD is essentially a course-grained molecular dynamics (MD) method that can capture effectively the hydrodynamics of complex fluids while retaining essential information about the structural properties of the system's components. An advantageous feature of DPD is that it utilizes soft repulsive interactions between the beads, which represent clusters of molecules.16 Consequently, one can use a significantly larger time step Δt between successive iterations than those required by MD simulations. This, in turn, allows one to model physical phenomena occurring at time and spatial scales orders of magnitude greater than that captured by MD.
The DPD method has been widely used to study both the equilibrium and kinetic properties of complex mixtures. Of particular relevance here, DPD simulations have successfully captured the mesoscale behavior of bilayer membranes,18–28 as well as the interactions between bilayers and peptides4–6 or nanoparticles.29–31 More broadly, the DPD method has been utilized to examine the equilibrated structures of self-assembling lipid systems32 and block co-polymers.33 The technique has also been used to investigate the dynamic behavior of dense colloidal suspensions,34polymers in dilute solutions or in melts,35 chains in microfluidic channels,36,37 and phase separating binary lipid mixtures.21
In our simulations, the hydrophobic nanotubes are capped by a monolayer of hydrophilic beads; to this basic structural unit, we tether hydrophilic chains at one or both ends of the tube. This amphiphilic architecture could prove particularly advantageous since the shaft of the CNTs would be compatible with the hydrophobic interior of the bilayer and the hydrophilic “tuffs” could stabilize the tubes in the membrane. Furthermore, these hydrophilic tethers could extend into the surrounding solution and thereby contribute to regulating the traffic through the transmembrane nanochannels. We consider three distinct types of end-functionalized nanotubes, which all have an A–B–A structure, with A indicating the hydrophiles and B indicating the hydrophobic shaft (see Fig. 1a–c). In addition to forming a single layer of beads at both ends of the tube, the A hydrophiles form the tethered chains lying at just one end of the nanotube (as in Fig. 1b), or at both ends (as in Fig. 1c). By comparing the interactions of the lipid bilayer with these tubular structures, we can isolate the role that the different hydrophilic moieties play in the nanotube's insertion into the membrane and its reorientation into the transmembrane position.
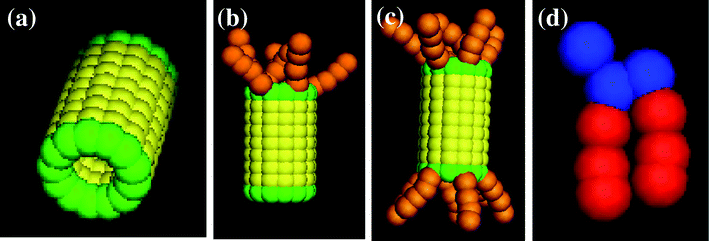 | ||
| Fig. 1 Images of the nanotube with (a) no, (b) one, and (c) two end-functional groups, and (d) the amphiphilic lipid. | ||
II. Methodology
Similar to MD simulations, DPD captures the time evolution of a many-body system through the numerical integration of Newton's equation of motion, mdvi/dt = fi, where the mass m of a bead of any species is set to one. Unlike MD simulations, DPD involves the use of soft, repulsive interactions (as noted above) and a momentum-conserving thermostat.16 The force acting on a bead contains three parts, each of which is pairwise additive: fi(t) = ∑(FCij + FDij + FRij), where the sum runs over all beads j within a certain cutoff radius rc. The conservative force is a soft, repulsive force given by FCij = aij(1 − rij)![[r with combining circumflex]](https://www.rsc.org/images/entities/b_i_char_0072_0302.gif) ij, where aij is the maximum repulsion between beads i and j, rij = |ri − rj|/rc, and
ij, where aij is the maximum repulsion between beads i and j, rij = |ri − rj|/rc, and ![[r with combining circumflex]](https://www.rsc.org/images/entities/b_i_char_0072_0302.gif) ij = rij/|rij|. The drag force is FDij = −γωD(rij)(
ij = rij/|rij|. The drag force is FDij = −γωD(rij)(![[r with combining circumflex]](https://www.rsc.org/images/entities/b_i_char_0072_0302.gif) ij × vij)
ij × vij)![[r with combining circumflex]](https://www.rsc.org/images/entities/b_i_char_0072_0302.gif) ij, where γ is a simulation parameter related to viscosity, ωD is a weight function that goes to zero at rc, and vij = vi − vj. The random force is FRij = σωR(rij)ξij
ij, where γ is a simulation parameter related to viscosity, ωD is a weight function that goes to zero at rc, and vij = vi − vj. The random force is FRij = σωR(rij)ξij![[r with combining circumflex]](https://www.rsc.org/images/entities/b_i_char_0072_0302.gif) ij, where ξij is a zero-mean Gaussian random variable of unit variance and σ2 = 2kBTγ. Finally, we use ωD(rij) = ωR(rij)2 = (1 − rij)2 for rij < rc.16 Because all three of these forces conserve momentum locally, hydrodynamic behavior emerges even in systems containing only a few hundred particles.16 The equations of motion are integrated in time with a modified velocity-Verlet algorithm.38
ij, where ξij is a zero-mean Gaussian random variable of unit variance and σ2 = 2kBTγ. Finally, we use ωD(rij) = ωR(rij)2 = (1 − rij)2 for rij < rc.16 Because all three of these forces conserve momentum locally, hydrodynamic behavior emerges even in systems containing only a few hundred particles.16 The equations of motion are integrated in time with a modified velocity-Verlet algorithm.38
We take rc as the characteristic length scale and kBT as the characteristic energy scale in our simulations. A characteristic time scale is then defined as  . The remaining simulation parameters are σ = 3 and Δt = 0.02τ with a total bead number density of ρ = 3 and a dimensionless value of rc = 1.29
As shown in Fig. 1d, our system contains short-chain lipids. The bonds between beads in the chain are represented by the harmonic spring potential Ebond = Kbond((r − b)/rc)2, where Kbond is the bond constant and b is the equilibrium bond length. We use Kbond = 64 and b = 0.5.29 We also insert a weaker bond (K′bond = 16) between the first beads on the two tails to keep the tails oriented in the same direction. Additionally, we include a three-body stiffness potential27 along the tails of the form Eangle = Kangle(1 + cosθ) where θ is the angle formed by three adjacent beads29 and we set the coefficient to Kangle = 20. This stiffness term increases the stability and bending rigidity of the bilayers.29
The hydrophobic shaft of the nanotube is formed from a stack of seven concentric rings. Each ring has a radius of 1.0 (distance between the nanotube’s cylindrical axis and the bead’s center of mass) and contains 13 beads; the spacing between the centers of neighboring beads on a given ring is 0.5 and the distance between the center of a bead and its nearest neighbor on an adjacent layer is also 0.5. (All distances here and below are given in units of rc, which is the characteristic interaction range and as noted above, is set to rc = 1 in dimensionless units.) There is perfect hydrophobic matching between the nanotube and the bilayer: namely, the length of the nanotube's hydrophobic shaft is chosen to be equal to the width of the hydrophobic part of the lipid membrane. For the case in Fig. 1a, the hydrophilic domain in the nanotube is formed from a single ring of beads (drawn in green) that are located on both ends of the shaft. In Fig. 1b and c, the nanotubes encompass end-tethered chains, which emanate from the one or both hydrophilic end rings and are attached at equally spaced intervals. The length of the tethers for both cases is fixed at four hydrophilic beads. Within the nanotube, there is no interaction between the hydrophilic end and hydrophobic shaft beads; the hydrophilic tethers can interact with each other. The bond and angle potential parameters for the hydrophilic tethers are the same as those for the lipid tails.
The amphiphilic nature of the lipids is captured by specifying the repulsive interactions between the components. Our choices for the interaction parameters between the components, aij, are based on the available data, as explained below. For any two beads of the same type, we take the repulsion parameter to be aii = 25 (measured in units of kBT). This aii is equal to the value calculated by Groot and Warren16 based on the compressibility of water for the chosen dimensionless density of ρ = 3. The excess repulsion between the hydrophobic and hydrophilic beads can be calculated based on the Flory–Huggins interaction parameters, χ, as aij = aii + 3.496χ.16 Note that the latter expression is written for the fixed density ρ = 3 and is valid for relatively high values of χ, i.e., sufficiently far from the critical point.16 Here, we chose the value of the interaction parameter between the different hydrophobic and hydrophilic moieties as aij = 100. Given that S stands for solvent, H stands for a lipid head bead and T stands for a lipid tail bead, we specifically set aSS = 25, aHS = 25, aHT = 100, and aST = 100. These values were used in a number of previous DPD simulations of lipid bilayers29,30 and as previously observed,27,29 we find that lipids spontaneously self-assemble into bilayers for these interaction parameters.
To capture the amphiphilic nature of the nanotube, we specify an additional set of interaction parameters to account for the unfavorable interactions between the tube's hydrophobic shaft and the solvent, and between this shaft and the hydrophilic tethered chains. In the following notation, s stands for the hydrophobic shaft beads, e stands for the band of hydrophilic beads at both ends of the hydrophobic shaft and t stands for beads making up the hydrophilic tethered chains. Given this notation, we set aTt = 100, aTs = 25, aTe = 100, aHt = 25, aHs = 100, aHe = 25, aSt = 25, aSs = 100, aSe = 25, att = 25, ats = 100 and ate = 100. Note that in our reference set of parameters, we chose the values of the parameters describing the interactions between all the hydrophobic and hydrophilic moieties to be aij = 100. The same values were previously used to describe the respective interactions between the hydrophobic and hydrophilic beads of hard Janus particles and a lipid bilayer.30 Because the nanotube shaft and the lipid tails are composed of chemically different moieties, in one series of studies described below, we vary the parameter that describes the repulsion between the nanotube's shaft and lipid tails, aTs, and focus on the effects of the shaft/tail interactions on the dynamics of this system.
Our three-dimensional simulation box is 40 × 40 × 20 r3c in size with periodic boundary conditions in all three directions. We begin with a pre-assembled lipid bilayer that is surrounded by solvent beads. We keep the size of the simulation box constant for all the values of the initial projected area per lipid, A0. We introduce the nanotubes into the simulation box such that the cylindrical axis of the nanotube lies parallel to the membrane plane and the initial distance between the nanotube and the bilayer is greater than 2rc. We monitor the system's energy to ensure that the nanotubes approach to and capture by the bilayer occurs after the bilayer has become equilibrated with the surrounding solvent.
For the above membrane parameters, the area per lipidA0 in a tensionless membrane29 is A0 = 1.28. For the size of our simulation box, this value of A0 is achieved by using a total of 2500 lipids. To simulate membranes with small positive tensions, we chose the projected area per lipid to be A0 = 1.30 and 1.35 (and the total number of lipids to be 2462 and 2370, respectively). Finally, to simulate membranes with the negative tensions, we chose the projected area per lipid to be A0 = 1.21 and 1.26 (and the total number of lipids to be 2644 and 2540, respectively). The tensionless membranes and membranes with the above positive tensions remain mostly flat throughout the course of the simulations, even after the insertion of the nanotube.39 The initially compressed membranes (cases of A0 = 1.21 and 1.26), however, have an excess number of lipids and hence, undergo noticeable undulations. The corresponding values of the dimensionless tension for all of the above values of the initial projected area, A0, for membranes with identical parameters are provided in ref. 29. Finally, in all our simulations we fix the total number of beads (including solvent beads) at 96![[thin space (1/6-em)]](https://www.rsc.org/images/entities/char_2009.gif) 000.
000.
The simulation parameters can be related to physical length and time scales by examining the properties of a tensionless membrane.29 Typical experimental measurements of dipalmitoylphosphatidylcholine (DPPC) membranes40 in a tensionless state yield an equilibrium area per lipid of approximately 0.6 nm2. This value can be used to establish a dimensional length scale in the DPD simulations and gives rc = 0.67 nm.29 The DPD time scale τ can be estimated from the in-plane diffusion constant of lipids, which, for a flat DPPC membrane, has been measured29 as D = 5 µm2s−1. By matching the latter value to the diffusion constant in a simulation, we obtain τ = 7.2 ns and, for a single time step, Δt = 0.02τ = 0.14 ns.29
III. Results and discussion
A. Interaction between a lipid bilayer and bare nanotubes
At early times in our simulations, the nanotube is beyond the range of interaction with the membrane. Once this diffusing nanotube comes within a critical distance from the top leaflet, it effectively docks onto the surface of the bilayer (Fig. 2a); we refer to this instant of time as the moment of capture. The critical distance refers to a separation between the hydrophobic shaft and lipid tails that is smaller than rc, so that the hydrophobic part of the nanotube interacts with the hydrophobic portion of the bilayer. The lipid tails then reorient and wet the hydrophobic shaft (see Fig. 2b), thus shielding this shaft from energetically unfavorable interactions with the hydrophilic head groups and the surrounding solvent. In this manner, the nanotube becomes adsorbed or partially immersed in the membrane.
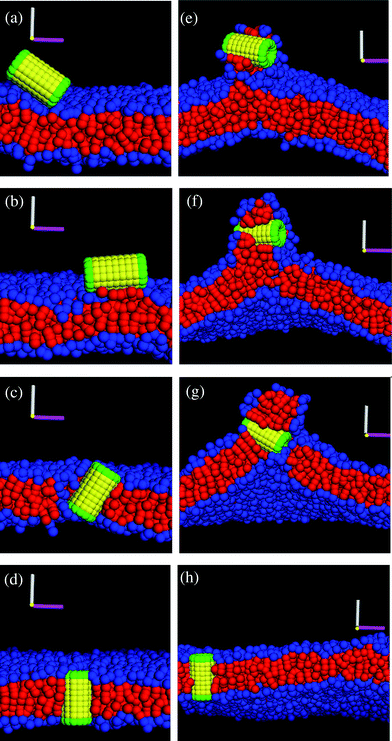 | ||
| Fig. 2 (a–d) Snapshots of the interaction between the nanotube and the tensionless (A0 = 1.28) membrane. The corresponding simulation times calculated from the moment of capture are: t = 0, t = 450, t = 1160, and t = 1230 in a–d, respectively. (e–h) Snapshots of the interaction between the nanotube and the membrane with a negative tension (A0 = 1.21). The corresponding simulation times calculated from the moment of capture are: t = 480, t = 600, t = 720, and t = 880 in e–h, respectively. | ||
Fig. 3 details the steps that occur between the images in Fig. 2b and d, giving further insight into the events that lead to the nanotube reorientation. For clarity, Fig. 3 shows only those lipids that are driven to change their orientation from the top to the bottom layer and have their head groups within the interaction radius with the nanotubes' lower end when it reaches its transmembrane position (more specifically, at the simulation time in Fig. 2d). (Here, we tracked the motion of all the lipids from the bottom layer that are in contact with the hydrophilic end of the tube at the simulation time in Fig. 2d, and plotted in Fig. 3 only those lipids that were initially in the top layer of the membrane.) We observe that head groups in the top layer localize around one of the nanotube's hydrophilic ends (the specific end is determined by thermal fluctuations). Concurrently, some of the lipid tails align along the shaft of the tube. As the tube becomes more tilted and moves into the interior hydrophobic domain, the lipids essentially form a micellar-like cap around this end, with the head groups surrounding the hydrophilic ring and the tails extending away from this region (and towards the hydrophobic domain in the bilayer). In effect, these associated lipids protect the descending end from the unfavorable enthalpic interactions and in this manner, chaperon the tube through the interior of bilayer.
 | ||
| Fig. 3 Snapshots of the nanotube being chaperoned by neighboring lipids during its insertion into the tensionless membrane (A0 = 1.28). Time elapsed since the nanotube capture for each frame is (a) 450 τ, (b) 1120 τ, (c) 1150 τ, (d) 1170 τ, and (e) 1230 τ. For clarity, we show here only those lipids that undergo a “flip-flop” and in the final snapshot (see Fig. 2d) have the head groups within the interaction radius with the nanotube's hydrophilic end immersed into the lower layer. (The images in (a) and (e) correspond to exactly the same time step as images in Fig. 2a and d, respectively). | ||
The images in Fig. 3 clearly illustrate a “flip-flop” phenomenon, where lipids in the vicinity of the nanotube move from the upper to the lower monolayer, as can be seen by comparing Fig. 3a and d. While for clarity the images in Fig. 3 depict just five lipids that undergo the flip-flop and come into a contact with the hydrophilic end of the tube, we in fact observe more flip-flops of the lipids in the vicinity of the nanotube during its reorientation. In particular, a total number of ten lipids undergo a flip-flop in the case depicted in Fig. 3a–e. Additional simulations showed that the flip-flop effect caused by the insertion of the nanotube is highly robust; on average (taken over six independent simulations), 7 lipids underwent this flip-flop. Analogous chaperoning behavior during the nanotube insertion process was noted by Lopez et al.2,3 and Illya and Deserno7 for the tensionless membrane. Here, we not only show the flip-flop phenomena, but also quantify the number of flip-flops during the nanotube insertion for bilayers with different membrane tensions (see Discussion below). We note that once the nanotube is inserted (see Fig. 2d), it remains localized in the bilayer, but can diffuse laterally within this membrane.
To quantify both the dynamics of the nanotube insertion and the resultant perturbations of the membrane seen in Fig. 2, we first calculated the total number of hydrophobic shaft/lipid tail interactions; these data are plotted in Fig. 4a. (Note that the solid symbols on the curves in Fig. 4 correspond to specific instances shown in Fig. 2.) The number of interactions is defined as the number of pairs of lipid tail–hydrophobic shaft beads that are separated by a distance smaller than rc. Monitoring this number is important for the following two reasons. First, it allows us to define the moment in time when the capture (or docking) of the nanotube occurs (namely, when this count is greater than zero). Here and in all the following plots in Fig. 4, we show the temporal evolution from the moment the capture occurs. Second, it allows us to quantify an effective coverage of the nanotube's hydrophobic shaft by the lipid tails during each of stages of the insertion process. For example, one can see that the coverage during the partial immersion phase is approximately one third of the full coverage (when the hydrophobic shaft interacts mostly with the lipids tails). In a similar manner, the dashed lines in Fig. 4a show the total number of hydrophilic end–lipid tail interactions. The latter plot shows a relatively small increase in these interactions during the insertion process due to the chaperoning effect described above (i.e., the hydrophilic end remains to a large extent shielded from the hydrophobic interior by the heads of the chaperoning lipids).
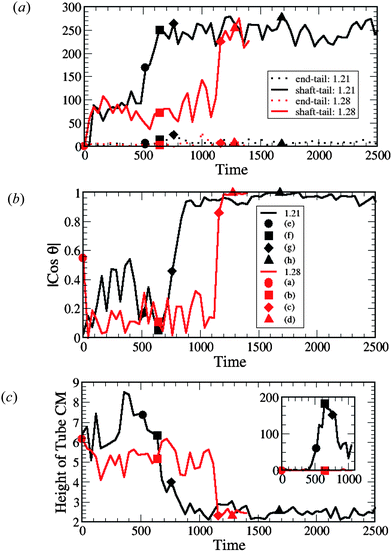 | ||
| Fig. 4 Measurements of (a) the interaction count, (b) the nanotube orientation θ with respect to the z-axis (see Fig. 5(a)) and (c) the height of the nanotube center of mass (CM) from the lower monolayer–solvent interface for membranes, as shown in Fig. 5(b). The inset in (c) shows the number of lipid tail and head beads above the nanotube CM (see Fig. 5(c)). The data points labeled by the solid symbols in each graph (and by (a)–(h) in (b)) correspond to the configuration snapshots in Fig. 2. In (a)–(c) the red lines correspond to the tensionless membrane (A0 = 1.28) and black lines correspond to the membrane with the negative tension (A0 = 1.21). | ||
We also determined the orientation of the nanotube with respect to the z-axis by measuring the angle θ, which is indicated in the schematic in Fig. 5a. For the tensionless membrane, the hydrophobic shaft–lipid tail interaction number reaches its maximal value only when the nanotube becomes inserted and is oriented vertically within the membrane (see Fig. 4b). For the case with A0 = 1.21, however, this interaction number attains its maximal value even before the entire tube is inserted and reoriented within the membrane. The latter data reflect the fact that the tails effectively reach up to grab the nanotubes' hydrophobic shaft and wrap around it, as seen in Fig. 2e–g.
 | ||
| Fig. 5 Schematic diagrams for calculating (a) the angle between the membrane normal and the cylindrical axis of the nanotubes, (b) the height of the nanotube center of mass from the lower monolayer–solvent interface, and (c) the number of lipid beads above the nanotubes center of mass prior to its reorientation into the membrane. | ||
To further characterize the nanotube insertion process seen in Fig. 2 and to isolate the effect of membrane tension on the above processes, we determined the height of the nanotube's center of mass with respect to the lower monolayer–solvent interface (as schematically shown in Fig. 5b). The red line in Fig. 4c for the A0 = 1.28 case shows that the tube's height fluctuates around a constant value during the partial immersion process and rapidly decreases during the reorientation process. For the A0 = 1.21 case, however, the wrapping of the nanotube by neighboring lipids results in relatively large separation distances between the nanotube and the lower monolayer–solvent interface. During the reorientation process, this distance decreases more gradually than in the case of the tensionless membrane.
Finally, as can be seen by comparing the images in the two columns of Fig. 2, the distortions of the membrane caused by the nanotube insertion are greater in the case of A0 = 1.21. To quantify this distortion, we calculated the number of lipid head and tail beads above the tube center of mass (as schematically shown in Fig. 5c). The data for both cases are shown in the inset to Fig. 4c. The black line in the inset corresponds to the formation of the large domain above the nanotube in the case of the negative tension membrane, while the red line (=zero) verifies that for the case of the tensionless membrane, no lipids wrap around the tube at any moment in time.
While we described only one simulation run for each value of A0 in generating the plots in Fig. 4, we nonetheless found that in both cases, the insertion processes described above are reproducible and highly robust. In particular, when we repeated the above simulations with different initial placements of the nanotubes for the tensionless membrane, we found the same behavior with similar characteristic times for the reorientation and insertion phase; we did, however, observe a large variability of characteristic times for the partial immersion phase. For the negative tension membrane, we observed that the wrapping process begins relatively shortly after the capture of the nanotubes in all of the cases; the data obtained from averaging over six independent runs are discussed below. We found that the time interval from the capture of the nanotube to the instant when it assumes a transmembrane position averaged over the six independent runs is shorter for the undulating membrane than for the tensionless membrane due to the large variability of characteristic times of the partial immersion phase in the latter case.
It is noteworthy that changing the membrane tension strongly affects the number of flip-flops. From data averaged over six independent runs, we observe more than a four fold increase in the number of flip-flops in the membrane with negative tension relative to the tensionless membrane case. (In particular, there are on average 33 lipids that undergo flip-flops at A0 = 1.21, for the case shown in Fig. 2e–h.) This difference in the number of flip-flops indicates that the perturbation of the membrane during this process is significantly greater for the case of A0 = 1.21.
B. Interaction between a bilayer and nanotubes decorated with hairs at just one end
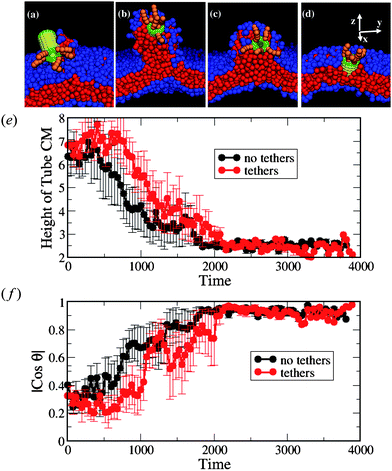 | ||
| Fig. 6 (a–d) Snapshots of the interaction between the nanotube decorated with tethers at one end and the membrane with small negative tension (A0 = 1.21). The corresponding simulation times calculated from the moment of capture are: t = 120, t = 400, t = 920, and t = 1120 in a–d, respectively. (e) The height of the nanotube CM from the lower monolayer–solvent interface and (f) the orientation of the nanotubeθ with respect to the z-axis. In (e) and (f), the black lines correspond to the bare nanotubes (as in the case shown in Fig. 2e–h) and the red lines correspond to nanotube decorated with tethers. We have used six independent runs for each nanotube design. | ||
As in the case of the non-decorated tube, the nanotube in Fig. 6a–d drags neighboring lipids from the upper to the lower monolayer during the insertion process. The number of lipids participating in the flip-flop is significantly higher for the cases of the undulated membrane (A0 = 1.21) than for the case of the tensionless membrane. On average (taken over six independent simulations), 32 lipids undergo this migration in the case of decorated nanotubes with A0 = 1.21, while only three lipids undergo flip-flops at A0 = 1.28. The total number of flip-flops is about the same for the decorated and non-decorated nanotubes interacting with the negative tension membrane.
Our simulations show that the dynamics of the nanotube insertion is qualitatively similar for the tensionless membrane and a membrane with positive tension, and is significantly different for the cases involving membranes with negative tension. Namely, we do not observe the wrapping of the nanotube shaft by the lipid tails for the membrane with zero or positive tension due to the lack of the excess membrane area. Hence, the number of lipid beads above the nanotube center of mass (which we count from the time of the nanotube capture to shortly prior to its reorientation into the membrane) is very close to or zero for the tensionless and positive tension membranes, as shown in Fig. 7. For the cases of the membranes with negative tension, the number of lipid beads above the nanotube's center of mass is relatively high for both cases considered here, with the largest cluster occurring at A0 = 1.21, reflecting the fact that the perturbation of the membrane is the largest for A0 = 1.21 (due to the largest excess membrane area).
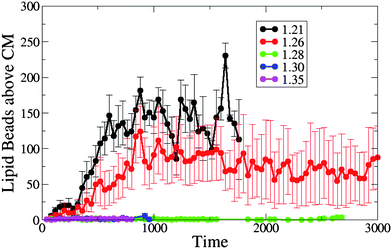 | ||
| Fig. 7 The number of lipid beads above the single end-functionalized nanotube's CM prior to its reorientation into the membrane, for different values of initial projected area per lipid (A0 = 1.21, 1.26, 1.28, 1.30 and 1.35). | ||
We further characterize the interaction between the membranes and this hairy nanotube by measuring both the height of the nanotube's center of mass with respect to the lower monolayer–solvent interface and the angle between the nanotube cylindrical axis and the z-axis (see Fig. 8). For the tensionless membrane (marked by the green lines), we observe that the partial immersion phase lasts for a relatively long period of time (this phase was also discussed for the case of a bare nanotube, see Fig. 2b). During this phase, the height of the center of mass of the nanotube remains approximately constant. The partial immersion phase is followed by the reorientation of the nanotube (with the decorated end remaining outside the top leaflet of the membrane at all times). Our simulations show the large variability of characteristic times of the partial immersion phase for the tensionless membrane; this variability results in the large error bars (see error bars on the green line in Fig. 8b).
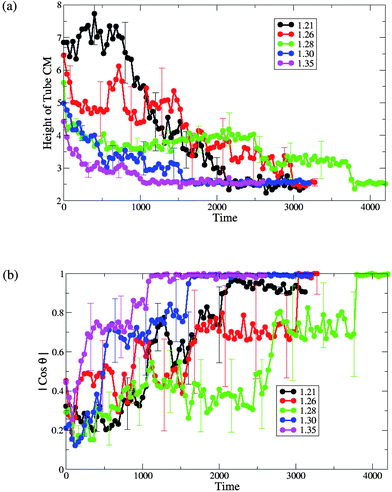 | ||
| Fig. 8 (a) The height of the single end-functionalized nanotube CM from the lower monolayer–solvent interface and (b) the orientation of the nanotubeθ with respect to the z-axis, for different values of initial projected area per lipid (A0 = 1.21, 1.26, 1.28, 1.30 and 1.35). | ||
The time interval from the capture of the nanotube to the instant when it assumes a transmembrane position (as obtained by averaging over the six independent runs) is the longest for the case of the tensionless membrane. The latter can be seen from the plots in Fig. 8b, as well as from the list of the respective average times given in Table 1. Hence, one can effectively speed-up the formation of the transmembrane pore by either increasing or decreasing the membrane tension, with the speed-up being much more pronounced for the membrane with the highest positive tension considered here (see Table 1 for the characteristic dimensionless times).
| Area per lipidA0 | Time for insertionτ |
|---|---|
| 1.21 | 2160 |
| 1.26 | 3040 |
| 1.28 | 3800 |
| 1.30 | 1600 |
| 1.35 | 1080 |
For the case of membranes with positive tension, the increased spacing between the lipids is responsible for the faster insertion of the nanotube into the membrane. Correspondingly, the average time from the moment of capture until the moment the nanotube attains a transmembrane position is the shortest for the membrane with the highest value of A0 = 1.35 (see Fig. 8 and Table 1).
For both cases of the membrane with negative tension, the average times of the nanotube insertion are also shorter than that for the tensionless membrane. The membrane restructuring due to the wrapping of the nanotube's shaft by the lipids effectively aids the process of the nanotube's insertion and results in a somewhat faster insertion compared to the tensionless membrane. We observe that the overall process is faster for the case of A0 = 1.21 than for A0 = 1.26 (see Table 1).
Most of the lipids that flip-flop from one monolayer to another from the inception of the nanotube's capture by the membrane are involved at some stage in the nanotube insertion into the membrane. As shown in Fig. 9, the tensionless membrane is found to have the lowest number of flip-flops. The increase in the inter-lipid spacing with positive tension reduces the energetic barrier for a lipid to cross the membrane leaflets, thereby making the flip-flop process more favorable. We find that the number of flip-flops increases with positive tension with respect to the tensionless membrane (with the number of flip-flops being highest at A0 = 1.35). These results are consistent with the work by Cooke and Deserno,42 who showed the spontaneous flip-flop rate increases with an increase in the membrane tension.
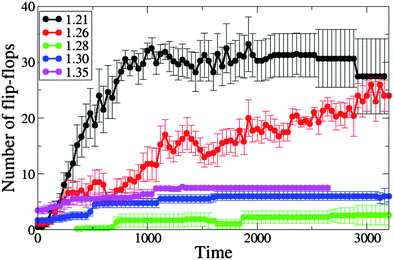 | ||
| Fig. 9 The number of lipids participating in the flip-flop process from the moment of capture of the single end-functionalized nanotube by the membrane, for different values of initial projected area per lipid (A0 = 1.21, 1.26, 1.28, 1.30 and 1.35). | ||
As can be seen from Fig. 9, the number of flip-flops also increases for the cases involving negative membrane tension, but here the increase is much more pronounced than that noted above. We demonstrated in the previous section that a membrane under negative tension has an excess area that enables the lipids to wrap around the nanotube shaft and assist its reorientation into the transmembrane position. The process of wrapping the tube and its reorientation causes many lipids to flip-flop across the membrane leaflets. For each measurement, we averaged over six independent runs for each area per lipid. Our results reveal that while the flip-flop phenomena occur during the nanotubes insertion in all of the cases studied, it is much more pronounced for the cases of the negative membrane tension due to the significantly higher degree of membrane perturbations.
We repeated our simulations with aTs = 15, 35, 50 and 70 (keeping A0 = 1.28). We did not observe the nanotube's insertion for aTs = 50 and 70 (even up to 1.8 × 10⁶ iterations, corresponding to approximately 260 µs). While these values of aTs are less than the shaft–solvent interaction (aSs = 100), it appears that the enthalpic gains are not sufficient to offset both the tube's loss of translational entropy and the local crowding of the neighboring lipids that accompany the nanotube insertion.
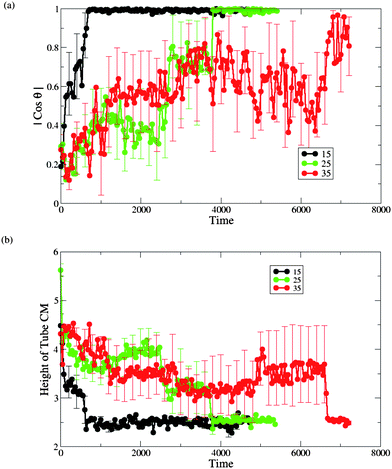
We did observe that for aTs = 15 and 35 the process of nanotube capture and reorientation into its transmembrane position is qualitatively similar to this process for aTs = 25. For the latter two cases, we repeated the calculations for the angle between the nanotube's cylindrical axis and the membrane normal (Fig. 10a), and the height of nanotube's CM with respect to the lower monolayer–solvent interface (Fig. 10b). Again, we calculated those plots from the moment of the nanotube's capture in each of the six independent runs. Relative to our reference case of aTs = 25 (which is replotted in the green curves in Fig.10), we find that the average time for the insertion process is much shorter for the case of aTs = 15 and is much longer for the case of aTs = 35. These results can be rationalized by the more favorable enthalpic interactions in the aTs = 15 example.
C. Interaction of bilayer with nanotubes decorated with hairs at both ends
Finally, we performed simulations to probe the interactions between the membrane and the nanotube in Fig. 1c, which encompasses two hydrophilic hairy ends. The latter nanotube architecture could be particularly advantageous for regulating transport in the membrane since both ends could be harnessed to control the passage of molecules in the system. We studied the following three cases of membrane tension: negative (A0 = 1.21), positive (A0 = 1.35) and tensionless (A0 = 1.28). For all these cases, for multiple independent runs and simulation times of t = 1.8 × 10⁶ (∼260 µs), this decorated nanotube was never observed to spontaneously insert into the bilayer; rather, it remained localized in solution, as shown in Fig. 11a. In effect, dragging an end with hydrophilic hairs across the hydrophobic interior of the bilayer poses too large of an enthalpic barrier for the tubes in Fig. 1c to self-organize into the membrane.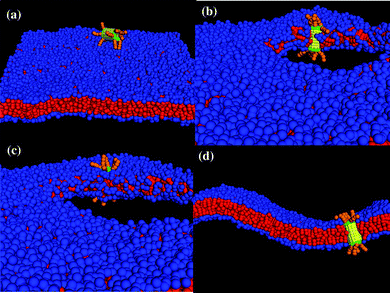 | ||
| Fig. 11 Interaction between the nanotube decorated with tethers at both ends. (a) The nanotube remains in solution and does not self-assemble into membrane until a stable pore is created in the membrane. The nanotube (b) interacts with the bilayer at the pore edge, (c) gets inserted in the membrane and (d) remains in the membrane after the tension is released to close the pore (cross-section of the nanotube in membrane). | ||
In an attempt to circumvent the energetic barrier imposed by the end-tethers, we introduced a pore into the membrane. The inspiration for this strategy came from previous findings on the interaction of Janus particles with lipid bilayers;30,31 these studies revealed that particles with comparable hydrophilic and hydrophobic content could be inserted into a perforated membrane. To create a stable pore, we gradually applied a uniform tension that expanded the membrane to 30% of its original area.30 Once the pore was formed, the lipids rearranged to minimize the contact between the hydrophilic solvent and the lipids' hydrophobic tails. As can be seen in Fig. 11b, the majority of the hydrophilic head groups point toward the solvent, forming a “hydrophilic” pore.
While the formation of a hydrophilic pore diminishes unfavorable enthalpic interactions, the lipids now form a highly curved interface at the pore's edge.30 When the diffusing nanotube comes within a distance of rc to this edge, the lipid tail groups wrap around the nanotube's hydrophobic shaft such that the tube is adsorbed into the membrane (this configuration simultaneously optimizes all the enthalpic interactions). Hence, as long as the membrane is kept stretched, the nanotube remains oriented in a transmembrane configuration, with the hydrophilic end-tethers protruding into the aqueous solution (see Fig. 11c).
The nanotube can be effectively “locked” into the bilayer by gradually reducing the membrane tension. In particular, when the tension is reduced, the pore closes and the membrane returns to its undulating fluid state with the nanotube inserted in a transmembrane configuration, as shown in Fig. 11d. (The nanotube can still diffuse laterally within the bilayer.)
IV. Conclusions
Our motivation for considering the interaction between end-functionalized nanotubes and lipid bilayers was to isolate cases where the decorated nanotubes would form biomimetic channels, which could be tailored to regulate the transport of molecules across the membrane. While researchers have modeled the interactions between bilayers and nanotubes that encompassed a ring of hydrophilic monomers at the ends of the cylinders, to the best of our knowledge, there have been no prior computational studies involving bilayers and nanotubes with hydrophilic hairs. Consideration of the hairs is particularly important since these end-groups can be harnessed to actively control the selectivity of the transmembrane channel.1To provide effective functionality, the decorated tubes would need to orient across the width of the membrane, with the hydrophilic moieties extending into the surrounding solution. We found that tubes with hairs at just one end of the cylinder could spontaneously self-organize into the desired transmembrane configuration. For nanotubes with hairs at both ends, however, the desired configuration only occurred when a pore was introduced into the membrane. Such pores can be introduced experimentally via micropipette techniques10 for example. Thus, routes for exploiting this nanotube architecture are in place.
In addition to probing the effects of the hairs on the penetration of the nanotubes into the membranes, we examined how membrane tension affects this insertion process. For a small negative tension, we anticipated that the compressed bilayer would exhibit qualitatively different behavior towards the nanotube than the tensionless system. Indeed, we observed that the compressed layer engulfs the nanotube in a manner that resembles the initial stages of cellular phagocytosis, with the lipids from the top monolayer extending up and over the nanoparticle. This phagocytic behavior occurred for both the hairless tube and the tube with hairs at just one end. For a small positive tension, the insertion process is observed to be similar to that for a tensionless membrane. These findings reveal that the interaction between the nanotubes and bilayer is strongly affected by the membrane's tension. Furthermore, the dynamics of the nanotube insertion into the transmembrane configuration show a dependence on the membrane tension. In particular, we found that one can effectively speed-up the formation of the transmembrane pore by either increasing or decreasing the membrane tension, with the speed-up being much more pronounced for the membrane with the highest positive tension considered here.
The findings described herein can provide design rules for fabricating end-functionalized nanotubes that act as synthetic channels, where the tethered hairs could serve to regulate traffic through the channel. Additionally, the results yield guidelines for driving the self-organization of the nanotubes into the bilayer and controlling the mode of self-organization (i.e., by varying the membrane tension). In future studies, we will consider the interaction of these nanotubes with vesicles to determine how the membrane curvature affects the uptake of these particles. We will then determine how to drive the self-assembly of lipids and nanotubes in solution to form a vesicle that encompasses a number of the nanotube pores.
Acknowledgements
The authors gratefully acknowledge funding from the National Science Foundation. We thank Dr Alexander Alexeev for fruitful discussions. Portions of the research were conducted using high performance computational resources at the Louisiana Optical Network Initiative (http://www.loni.org).References and notes
- M. Majumdar, N. Chopra and B. J. Hinds, Effect of tip functionalization on transport through vertically oriented carbon nanotube membranes, J. Am. Chem. Soc., 2005, 127, 9062–9070 CrossRef CAS.
- C. F. Lopez, S. O. Nielsen, P. B. Moore and M. L. Klein, Understanding nature's design for a nanosyringe, Proc. Natl. Acad. Sci. U. S. A., 2004, 101, 4431–4434 CrossRef CAS.
- C. F. Lopez, S. O. Nielsen, B. Ensing, P. B. Moore and M. L. Klein, Structure and dynamics of model pore insertion into a membrane, Biophys. J., 2005, 88, 3083–3094 CrossRef CAS.
- M. Venturoli, B. Smit and M. M. Sperotto, Simulation studies of protein-induced bilayer deformations, and lipid-induced protein tilting, on a mesoscopic model for lipid bilayers with embedded proteins, Biophys. J., 2005, 88, 1778–1798 CrossRef CAS.
- M. Venturoli, M. M. Sperotto, M. Kranenburg and B. Smit, Mesoscopic models of biological membranes, Phys. Rep., 2006, 437, 1–54 CrossRef CAS.
- E. Vanden-Eijnden and M. Venturoli, Markovian milestoning with voronoi tessellations, J. Chem. Phys., 2009, 130, 194101 CrossRef.
- G. Illya and M. Deserno, Coarse-grained simulation studies of peptide-induced pore formation, Biophys. J., 2008, 95, 4163–4173 CrossRef CAS.
- J. Neder, B. West, P. Nielaba and F. Schmid, Coarse-grained simulations of membranes under tension, J. Chem. Phys., 2010, 132, 115101 CrossRef.
- H. T. McMahon and J. L. Gallop, Membrane curvature and mechanisms of dynamic cell membrane remodeling, Nature, 2005, 438, 590–596 CrossRef CAS.
- R. Kwok and E. Evans, Thermoelasticity of large lecithin bilayer vesicles, Biophys. J., 1981, 35, 637–652 CAS.
- K. Zeman, H. Engelhard and E. Sackmann, Bending undulations and elasticity of the erythrocyte membrane: effects of cell shape and membrane organization, Eur. Biophys. J., 1990, 18, 203–219 CAS.
- K. S. Turitsyn and S. S. Vergeles, Wrinkling of vesicles during transient dynamics in elongational flow, Phys. Rev. Lett., 2008, 100, 028103 CrossRef CAS.
- J. Solon, J. Pecreaux, P. Girard, M.-C. Faure, J. Prost and P. Basserau, Negative tension induced by lipid uptake, Phys. Rev. Lett., 2006, 97, 098103 CrossRef.
- N. Gov, Membrane undulations driven by force fluctuations of active proteins, Phys. Rev. Lett., 2004, 93, 268104 CrossRef CAS.
- W. Romer, L. Berland, V. Chambon, K. Gaus, B. Windschiegl, D. Tenza, M. R. E. Aly, V. Fraisier, J.-C. Florent, D. Perrais, C. Lamaze, G. Raposo, C. Steinem, P. Sens, P. Basserau and L. Johannes, Shiga toxin induces tubular membrane invaginations for its uptake into cells, Nature, 2007, 450, 670–675 CrossRef.
- R. D. Groot and P. B. Warren, Dissipative particle dynamics: bridging the gap between atomistic and mesoscopic simulation, J. Chem. Phys., 1997, 107, 4423–4435 CrossRef CAS.
- J. Plimpton, Fast parallel algorithms for short-range molecular dynamics, J. Comput. Phys., 1995, 117, 1–19 CrossRef CAS http://lammps.sandia.gov/cite.html .
- S. Yamamoto and S. Hyodo, Budding and fission dynamics of two-component vesicles, J. Chem. Phys., 2003, 118, 7937–7943 CrossRef CAS.
- M. Laradji and P. B. Kumar, Anomalously slow domain growth in fluid membranes with asymmetric transbilayer lipid distribution, Phys. Rev. E: Stat., Nonlinear, Soft Matter Phys., 2006, 73, 040910(R).
- M. Laradji and P. B. S. Kumar, Domain growth, budding and fission in phase-separating self-assembled fluid bilayers, J. Chem. Phys., 2005, 123, 224902 CrossRef.
- M. Laradji and P. B. Sunil Kumar, Dynamics of domain growth in self-assembled fluid vesicles, Phys. Rev. Lett., 2004, 93, 198105 CrossRef.
- L. H. Gao, J. Shillcock and R. Lipowsky, Improved dissipative particle dynamics simulations of lipid bilayers, J. Chem. Phys., 2007, 126, 015101 CrossRef.
- G. Illya, R. Lipowsky and J. C. Shillcock, Two-component membrane material properties and domain formation from dissipative particle dynamics, J. Chem. Phys., 2006, 125, 114710 CrossRef CAS.
- V. Ortiz, S. O. Nielsen, D. E. Discher, M. L. Klein, R. Lipowsky and J. Shillcock, Dissipative particle dynamics simulations of polymerosomes, J. Phys. Chem. B, 2005, 109, 17708–17714 CrossRef CAS.
- A. Grafmüller, J. Shillcock and R. Lipowsky, Pathway and energy barriers from dissipative particle dynamics, Biophys. J., 2009, 96, 2658–2675 CrossRef.
- J. C. Shillcock and R. Lipowsky, Tension-induced fusion of bilayer membranes and vesicles, Nat. Mater., 2005, 4, 225–228 CrossRef CAS.
- J. C. Shillcock and R. Lipowsky, Equilibrium structure and lateral stress distribution of amphiphilic bilayers from dissipative particle dynamics simulations, J. Chem. Phys., 2002, 117, 5048–5061 CrossRef CAS.
- L. Gao, R. Lipowsky and J. Shillcock, Tension-induced vesicle fusion: pathways and pore dynamics, Soft Matter, 2008, 4, 1208–1214 RSC.
- K. A. Smith, D. Jasnow and A. C. Balazs, Designing synthetic vesicles that engulf nanoscopic particles, J. Chem. Phys., 2007, 127, 084703 CrossRef.
- A. Alexeev, W. E. Upsal and A. C. Balazs, Harnessing Janus nanoparticles to create controllable pores in membranes, ACS Nano, 2008, 2, 1117–1122 CrossRef CAS.
- L.-T. Yan and X. Yu, Enhanced permeability of charged dendrimers across tense lipid bilayer membranes, ACS Nano, 2009, 3, 2171–2176 CrossRef CAS.
- S. Yamamoto, Y. Maruyama and S. Hyodo, Dissipative particle dynamics study of spontaneous vesicle formation of amphiphilic molecules, J. Chem. Phys., 2002, 116, 5842–5849 CrossRef CAS.
- S. Chou, H.-K. Tsao and Y.-J. Sheng, Morphologies of multicompartment micelles formed by triblock copolymers, J. Chem. Phys., 2006, 125, 194903 CrossRef.
- E. S. Boek, P. V. Coveney, H. N. W. Lekkerkerker and P. van der Schoot, Simulating rheology of dense colloidal suspensions using dissipative particle dynamics, Phys. Rev. E: Stat. Phys., Plasmas, Fluids, Relat. Interdiscip. Top., 1997, 55, 3124–3133 CrossRef CAS.
- N. A. Spenley, Scaling laws for polymers in dissipative particle dynamics, Europhys. Lett., 2000, 49, 534–540 CrossRef CAS.
- X. Fan, N. Phan-Thien, S. Chen, X. Wu and T. Y. Ng, Simulating flow of DNA suspension using dissipative particle dynamics, Phys. Fluids, 2006, 18, 063102 Search PubMed.
- S. Chem, X. J. N.Phan-ThienFan and B. C. Khoo, Dissipative particle dynamics of polymer drops in periodic shear flow, J. Non-Newtonian Fluid Mech., 2004, 118, 65–81 CrossRef CAS.
- M. P. Allen and D. J. Tildesley, Computer Simulation of Liquids, Clarendon, Oxford, 1987 Search PubMed.
- Given that the cross-sectional area of the nanotube relative to the total membrane area is 0.44%, the change in the membrane area post-insertion is negligible. Therefore, the projected area per lipid is assumed to remain approximately the same.
- J. F. Nagle, Area/lipid of bilayers from NMR, Biophys. J., 1993, 64, 1476–1481 CrossRef CAS.
- M. Herant, V. Heinrich and M. Dembo, Mechanics of neutrophil phagocytosis: behavior of the cortical tension, J. Cell Sci., 2005, 118, 1789–1797 CrossRef CAS.
- I. R. Cooke and M. Deserno, Solvent-free model for self-assembling fluid bilayer membranes: stabilization of the fluid phase based on broad attractive tail potentials, J. Chem. Phys., 2005, 123, 224710 CrossRef.
| This journal is © The Royal Society of Chemistry 2011 |

