Surface polymerization of (3,4-ethylenedioxythiophene) probed by in situ scanning tunneling microscopy on Au(111) in ionic liquids†
Shahzada
Ahmad
*a,
Timo
Carstens
b,
Rüdiger
Berger
a,
Hans-Jürgen
Butt
a and
Frank
Endres
b
aMax Planck Institute for Polymer Research, Ackermannweg 10, D-55128, Mainz, Germany. E-mail: ahmad@mpip-mainz.mpg.de; Fax: +49 (0)6131 379310; Tel: +49 (0)6131 379115
bInstitute of Particle Technology, Clausthal University of Technology, Arnold-Sommerfeld-Strasse 6, 38678, Clausthal-Zellerfeld, Germany
First published on 9th November 2010
Abstract
The electropolymerization of 3,4-ethylenedioxythiophene (EDOT) to poly(3,4-ethylenedioxythiophene) (PEDOT) was investigated in the air and water-stable ionic liquids 1-hexyl-3-methylimidazolium tris(pentafluoroethyl) trifluorophosphate [HMIm]FAP and 1-ethyl-3-methylimidazolium bis(trifluoromethylsulfonyl) amide [EMIm]TFSA. In situscanning tunnelling microscopy (STM) results show that the electropolymerization of EDOT in the ionic liquid can be probed on the nanoscale. In contrast to present understanding, it was observed that the EDOT can be oxidised in ionic liquids well below its oxidation potential and the under potential growth of polymer was visualized by in situSTM. These results serve as the first study to confirm the under potential growth of conducting polymers in ionic liquids. Furthermore, ex situmicroscopy measurements were performed. Quite a high current of 670 nA was observed on the nanoscale by conductive scanning force microscopy (CSFM).
1. Introduction
Polymer based organic electronics promote the creation of inexpensive, flexible devices and also the possibility of integration with fabrics. Thiophene and its derivatives have occupied a top position among various other conjugated polymers. In particular poly(3,4-ethylenedioxythiophene) (PEDOT) is a prominent conducting polymer owing to the multiple well-established technological applications of its various conducting forms.1,2PEDOT displays a range of interesting properties including low half-wave potential and band gap (1.6 eV), outstanding electrochemical stability upon cycling, high environmental stability, high conductivity, and excellent transparency in its doped state, along with high air and thermal stability as compared to other members of the polythiophene family. In addition to a strong electron donor effect, PEDOT gives rise to a certain self-rigidification of linearly π-conjugated structures by means of intramolecular non-covalent interactions between oxygen and sulfur and this represents an important result for the synthetic chemistry of functional π-conjugated systems.3 The enhancement of the electrochemical signals relative to the oxidation of different analytes, when using PEDOT modified electrodes with respect to bare support, has also been reported.4On account of its high thermal stability and its outstanding electronic properties, PEDOT is now used for the production of polymer capacitors and also as antistatic coatings on X-ray tubes. PEDOT shows high transmission in the visible region with an acceptable conductivity and colorless to bluish coatings with a minimum surface resistivity of ∼150 ohm cm−2 can be achieved. Thus, it can be used as a replacement for transparent coatings made of conducting metal oxides. However, the commercial product PEDOT:PSS [poly(3,4-ethylenedioxythiophene):poly(styrenesulfonate)] is an aqueous suspension, which is subject to some aging. PEDOT alone is an insoluble material and hence its processing by using wet chemistry technique has its limits. Electrodeposition is a classical but technically—in principle—simple film deposition technique that is widely used in the making of materials and devices.5–8 Particularly PEDOT can be deposited by using electropolymerization directly on conductive substrates. Thin layers of PEDOT can easily be made on flexible substrates, and an electrochemical routine offers the prospect of low cost fabrication without the need of expensive and energy intensive high temperature and high vacuum processes.
The electrolyte used for the synthesis of conducting polymers can influence the properties of the resulting materials including electrochemical properties. Room temperature ionic liquids have attracted a growing interest as media for the growth of polymers.7–10 Recently the use of electropolymerized PEDOT as neural electrodes, to record neural signals,11 and as drug carriers12 has been reported as well as functionalized PEDOT nanowires as a label free detection of target proteins.13 Also, the application of PEDOT layers in dye-sensitized solar cells (DSSCs) as a replacement for platinum to be used as counter electrodes10 has been demonstrated. The splendid properties of these monolayers of PEDOT are due to the insertion of both cations and anions in the polymer matrix during synthesis/cycling.6 With the use of ionic liquids, the growth conditions can be altered to produce grains with diameters in the nanometre regime. The grain size will influence hardness and electrocatalytic activity. Recently in the electrodeposition of metals, one of us has observed that even slight changes in the ionic liquid cation structure can alter the grain size. With the introduction of an ether-group into the side chain of an imidazolium ion instead of microcrystalline Al, nanocrystalline Al is obtained.14 As the interaction of ionic liquids with electrode surfaces is to current knowledge different from that of conventional electrolytes, ionic liquids will lead to other structures and such studies are currently at their infancy. The use of ionic liquids with the pyrrolidinium ion leads to rather smooth films, but the polymerization rate is lower than in conventional solvents due to the higher viscosity of ionic liquids.15PEDOT forms stacks and the charge is balanced by counter ions, furthermore the conductivity seems to remain unaltered after aging under environmental conditions. Its high stability is attributed to favorable ring geometry and the electron-donating effect of the oxygen atoms at the 3,4-positions stabilizing the positive charge in the polymer backbone.1,3
The deposition of metals and conducting polymers from ionic liquids can be probed by using in situ scanning tunneling microscopy (STM).16 Especially for in situ studies extremely pure electrolytes and single crystalline surfaces are required as the purification of ionic liquids is not straightforward. In conventional solvents single molecular wires were formed by electrochemical epitaxial polymerization and studied by ex situSTM studies,17,18 while in situSTM studies were also reported to confirm the adsorption of polyaniline molecule on Au surface by using sulfuric acid as an electrolyte.19,20 Furthermore poly(para-phenylene) growth was studied by in situSTM.21 So far no report has been published yet to study the growth of PEDOT in ionic liquids using in situSTM. The macroscopic properties of polymers, i.e.PEDOT, are influenced by the microscopic structure. The understanding of the molecular orientation of EDOT/PEDOT at the interface might help to understand the kinetics of electron transport across the surface.
Here we report on the electropolymerization of EDOT on Au(111) in the air and water stable ionic liquids, 1-hexyl-3-methylimidazolium tris(pentafluoroethyl) trifluorophosphate [HMIm]FAP and 1-ethyl-3-methylimidazolium bis(trifluoromethylsulfonyl) amide [EMIm]TFSA, respectively. The in situSTM results show that the electropolymerization of EDOT can be probed in these ionic liquids on the nanometre scale. In situSTM studies visualized nucleation and thus the initial polymerization state can be observed. Additionally ex situscanning force microscopy (SFM) and conductive scanning force microscopy (CSFM) were performed to probe local heterogeneities in the topography and conduction properties of the synthesized PEDOT films.
2 Results and discussions
2.1 In situ STM studies
Prior to polymerization we observed adsorption of the ionic liquid species on the Au(111) surface. Fig. 1(a) illustrates an in situSTM image of Au(111) at 0 V vs.Pt, close to the open circuit potential in the pure ionic liquid [HMIm]FAP. It can be seen from the STM image (Fig. 1(a)) that instead of a flat Au(111) surface with terraces the gold surface is rough with many monoatomic vacancy islands all over the gold surface. The vacancy islands are between 10 and 20 nm in diameter and a step height of 250 ± 30 pm can be observed. Such a behaviour is attributable to the adsorption of ionic liquid species at the gold surface leading to a reorientation of gold at the surface. A multilayer structure is present, with the number of layers determined by the ionic liquid species and the properties of the surface: up to five discrete interfacial solvent layers have already been observed on electrode surfaces, and consequently there is no simple electrochemical double layer.22Fig. 1(b)–(f) shows a series of in situSTM images on Au(111) in [HMIm]FAP + EDOT on the application of different electrode potentials. Fig. 1(b) illustrates the STM image obtained at +0.4 V vs.Pt. The surface is smoother than in Fig. 1(b), but there are no hints for a polymer deposition.![In situ
STM images of (a) Au(111) and (b–f) the beginning growth of PEDOT at different electrode potentials using [HMIm]FAP as a polymerizing medium.](/image/article/2011/NR/c0nr00579g/c0nr00579g-f1.gif) | ||
| Fig. 1 In situ STM images of (a) Au(111) and (b–f) the beginning growth of PEDOT at different electrode potentials using [HMIm]FAP as a polymerizing medium. | ||
At +0.5 V vs. Pt-quasi-reference electrode, a number of randomly distributed 2-dimensional islands with heights of 1–2 nm are formed on the gold surface. The appearance of islands indicates the beginning of oxidation of 3,4-ethylenedioxythiophene (EDOT) to poly(3,4-ethylenedioxythiophene) (PEDOT), especially as in the pure liquid such structures do not appear at a comparable electrode potential.
Interestingly, PEDOT deposition can already be seen in ionic liquids at a relatively low electrode potential of just +0.5 V vs.Pt. Information in the literature reveals that the oxidation potential of the EDOT monomer is about +1.0 V vs.Ag/AgCl in the classical salt solvent based electrolytes. Our STM results show that the nucleation starts at +0.5 V vs.Pt. The cyclic voltammograms of Fig. 2 show that macroscopic growth of PEDOT on this potential scale starts at ∼300 mV more positive potentials. This nucleation corresponds to an under potential deposition of the conducting polymer in ionic liquids. In order to confirm the under potential growth the polymer was imaged at +0.5 V vs.Pt for 4 minutes, giving rise to an ongoing surface growth and a more dense structure was obtained (Fig. 1(d)). These results make it likely that an under potential deposition of PEDOT takes place and nucleation starts (Fig. 1(c) and (d)) ∼300 mV before the bulk growth. We have also exploited the adsorption/growth of PEDOT molecules as a function of the electrode potential. When the potential is increased step by step the polymer deposition rate slowly increases, and we noted that a change in potential beyond +0.8 V vs.Pt results in a very fast polymerization rate which can no longer be probed by in situSTM. Layers of PEDOT were obtained, and this also depends on the amount of charge passed on the substrate. High quality STM images can only be obtained for the initial nucleation and growth process (Fig. 1(c)–(f)) below +0.8 V in the case of PEDOT, while at higher potentials the STM tip is in multiple contact with the growing polymer resulting in noisy images (ESI, Fig. S1†). The STM images of PEDOT on Au(111) at lower electrode potentials illustrate a two-dimensional island like structure, which becomes denser on changing the electrode potential from +0.5 V to +0.7 V. When the electrode potential was set to +0.8 V vs.Pt, the surface changes drastically and it adopted a shape of fibrils like with continuous films.
![Cyclic voltammograms of PEDOT growth recorded at 20 mV s−1 on Au(111) in [HMIm]FAP containing 0.05 M EDOT (the arrow indicates the increasing number of CV cycles).](/image/article/2011/NR/c0nr00579g/c0nr00579g-f2.gif) | ||
| Fig. 2 Cyclic voltammograms of PEDOT growth recorded at 20 mV s−1 on Au(111) in [HMIm]FAP containing 0.05 M EDOT (the arrow indicates the increasing number of CV cycles). | ||
Successive oxidation of EDOT by cyclic potential scans in the ionic liquid [HMIm]FAP on Au(111) is shown in Fig. 2. In the anodic scan of the first cycle (black curve) an anodic current starts to rise at an electrode potential of about +0.8 V vs. Pt-quasi-reference-electrode. The current rises strongly, indicating the polymerization of EDOT. In the back scan two reduction waves at 0.5 V and at −0.4 V can be observed. The second cycle and the following ones reveal oxidation peaks at 0.2 V and 0.6 V, respectively. The current density increases with the number of cycles indicating the ongoing growth of PEDOT on the gold electrode.
The other less pronounced waves might be explained with the postulated structure or morphology of the PEDOT film which contains usually two types of coexisting zones: a compact and an open structure.23 Our PEDOT film showed a bluish appearance on the Au surface.
Further experiments showed that the polymerization of PEDOT is much faster in [EMIm]TFSA (ESI, Fig. S2†). This is mainly due to the lower viscosity (41 mPa s) relative to that of [HMIm]FAP (116 mPa s). The low viscosity of [EMIm]TFSA leads to a better mass transport of ions, and thus to a faster polymerization rate. Consequently the growth rate of the same polymer can differ greatly and might depend upon local environments, here mainly due to the different physico-chemical properties of the ionic liquids used (Table 1).
| Ionic liquids | Mol. wt | Viscosity/cP at 20 °C | Conductivity/mS cm−1 at 20 °C | Density at 20 °C | Electrochemical window/V | Molar concentration/mol L−1 |
|---|---|---|---|---|---|---|
| [HMIm]FAP | 612.28 | 116 | 1.3 | 1.557 | 5.7 | 2.54 |
| [EMIm]TFSA | 391.32 | 41 | 7.6 | 1.524 | 4.4 | 3.88 |
From the in situ images we can conclude that the macroscopic growth starts at nuclei formed in the under potential deposition regime. The initial oxidation of EDOT leads to oligomer chains or nucleating sites on the electrode surface, and after reaching a sufficient molecular weight these oligomers then form microclusters followed by macroscopic growth finally resulting in layers of PEDOT (Scheme 1).9 In the initial stage it appears that the polymer is adsorbed on the electrode forming a smooth surface (Scheme 1), and then a layering of the polymer takes place. The vacancies on the surface Au(111) (Fig. 1(a)) can be explained with solvation layers that interact with the surface while at higher electrode potentials the polymer completely covers the gold terraces.
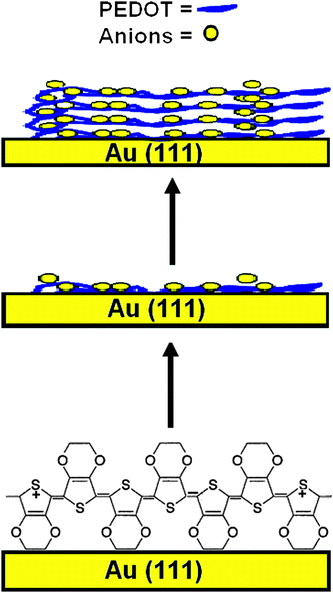 | ||
| Scheme 1 Possible layering of PEDOT on Au(111) surface. | ||
These results will pave the way for an understanding of nucleation and growth phenomena by direct visualization with in situSTM and reveal insights into under potential deposition of conducting polymers. We would like to mention that linear structures of aniline and polyaniline on Au(111) were observed using sulfuric acid as an electrolyte,18 an epitaxial organization was observed for drop casted poly(3-dodecylthiophene) on HOPG in chloroform by STM.24 Recently epitaxially aligned PEDOT obtained by a surface confined reaction25 was reported too. A molecular or even atomic resolution of the surface processes in ionic liquids is still a challenge. Both the viscosity and adsorbed layers of ionic liquids make this aim demanding.
2.2 Ex situ measurements
The microstructures of two unevenly thick PEDOT layers made in [HMIm]FAP are shown in Fig. 3. Thick layers >1000 nm (Fig. 3(a) and (b)) show a highly porous structure and originate from three-dimensional hierarchical growth of polymer,9 whereas thin layers <200 nm film (Fig. 3(c) and (d)) exhibit a stacking like microstructure with uniform grains. It is known that PEDOT forms stack and the charge is balanced by counter ions. These stacking like structures are the result of counter ion uptake (charge compensation) in the matrix of the polymer. The obtained mesoscopic morphology will create an interface with a huge surface area endowing these systems with intriguing optoelectronic properties. Particularly the use of [HMIm]FAP produces a more porous structure than [EMIm]TFSA.10![SEM micrographs of ∼1000 nm thick PEDOT (a and b) and of ∼200 nm thick PEDOT layers (c and d) obtained by using [HMIm]FAP as a polymerizing medium.](/image/article/2011/NR/c0nr00579g/c0nr00579g-f3.gif) | ||
| Fig. 3 SEM micrographs of ∼1000 nm thick PEDOT (a and b) and of ∼200 nm thick PEDOT layers (c and d) obtained by using [HMIm]FAP as a polymerizing medium. | ||
The porous structures (inset of Fig. 3(b)) with its high specific surface area will result in good catalytic properties and facilitate ion intercalation for a rapid charge transport behavior. Nanoporous PEDOT layers might influence the post-functionalization of these layers when used in the presence of electrolytes. Such highly porous polymers are envisioned as potential energy materials e.g. as electrode materials due to their catalytic behavior.26
Scanning force microscopy (SFM) measurements were performed to get information on the roughness and phase contrast. The microstructure observed in the SEM images was also seen in SFM measurements. The topography shown in Fig. 4(a) exhibits a homogeneous morphology with quite a uniform grain size as well as a highly porous structure for thick films.
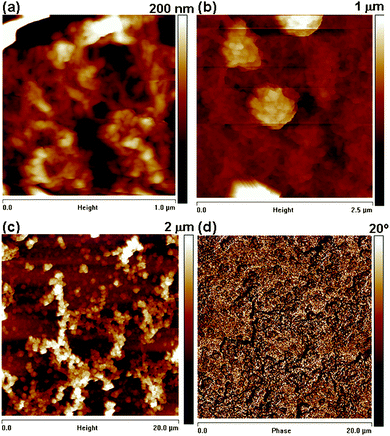 | ||
| Fig. 4 SFM height images (a–c) of PEDOT at different length and height scales. As features are up to 100 nm in height the height images are convoluted with the shape of the tip and (d) corresponding phase image. | ||
We have found that the surface exhibits a granular structure (Fig. 4(a) and (b)) for these PEDOT layers. The RMS roughness value of PEDOT was found to be 38 nm, estimated on an area of 1 × 1 µm2, and this value increases to 308 nm for the surface imaged at 20 × 20 µm2. The significant increase in RMS is attributed to the hierarchical growth of the polymer with embedded domains having a diameter of 100 nm (Scheme 1). The phase contrast recorded at the scale of 20 × 20 µm2 did not reveal a significant contrast (Fig. 4(d)). We can conclude that the substrate is covered entirely with the polymer film of uniform deformability having an RMS value of 5.81°. With increasing electropolymerization time, the grain size becomes larger and also changes the morphology. The ex situ and in situ results can be correlated as the data were obtained with the same samples.
The charge transport behavior on the nanoscale is crucial for determining device performance. The device lifetime can be increased if the current is uniformly distributed across the surface. In order to probe the homogeneity of the current on the micro-/nanoscale of PEDOT layers, derived from [HMIm]FAP (thickness ∼1000 nm), CSFM measurements were performed. CSFM allows to simultaneously measure topography and the current variation between the CSFM tip and the sample.27 The samples were imaged several times at the same site in order to obtain reproducible results and to test the stability of the sample surface. Fig. 5(a) shows a map of the current variation in PEDOT at 2.5 × 2.5 µm2 while (b) depicts a 5 × 5 µm2 area. The CSFM experiment revealed consistent distribution of current throughout the polymer film. The measurements were repeated at various positions (not shown here) and the results were confirmed even on a larger area. The average RMS current value that flows through these layers is 63 nA for an area of 2.5 × 2.5 µm2 and a bias of 50 mV while this value rises to 94 nA when the bias was increased to 100 mV (5 × 5 µm2), which shows that the current follows ohmic law and is directly dependent on the applied voltage. The maximum observed current on the surface of PEDOT is 383 nA and 670 nA for 2.5 × 2.5 µm2 and 5 × 5 µm2, respectively. The bright features in the images (Fig. 5(a)) are due to grains of higher conductance compared to the surrounding. We might attribute these grains to PEDOT rich areas, while the areas with the lower current represent an ion rich area.
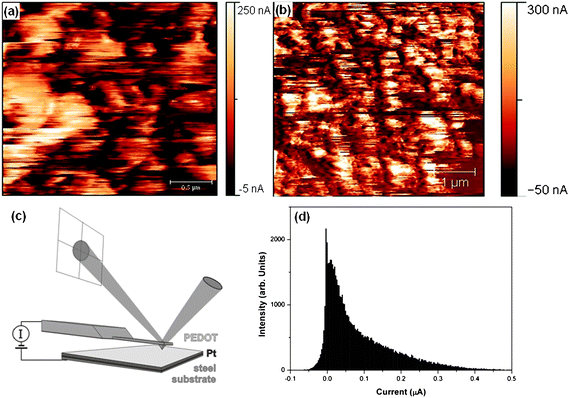 | ||
| Fig. 5 Current distribution of PEDOT layers (a) at a bias of 50 mV and (b) at a bias of 100 mV at different length scales, (c) scheme of CSFM used and (d) histogram of (b). | ||
Our results show that the conductivity of PEDOT made in ionic liquids is quite high and uniformly distributed over the surface, even at a low dc bias voltage of 50 mV. In our opinion these results are particularly interesting for electrochemical devices based on conjugated polymers and will contribute to a high cycling lifetime of the end product. It is more difficult to obtain this aim with chemical processes and other media. The properties of conducting polymers depend directly on the experimental conditions, for example on the water content as well as on concentration/conductivity of the polymerizing bath.28 This can lead to defects on the nanometre scale and to an island like growth of conducting domains instead of a uniform distribution, resembling polaron domains embedded in an insulating matrix.29 We might speculate that in spite of this charge transfer by intra-polaronic islands, it is also taking place through the shortest available path. We cannot observe this as higher/molecular resolution images are not possible with CSFM and this can be observed from our STM images which are more pronounced, as STM measures conductivity. PEDOT films made in [HMIm]FAP seem to be much more uniform, which might be due to an interaction of the ionic liquid with the growing polymer. The low surface tension (33.2 mN m−1 for [HMIm]FAP) of ionic liquids might facilitate a more uniform growth.
Furthermore, the nucleophilicity of the solvent will play a role, as more nucleophilic solvents will react with free radical intermediates of the polymer, in the case of aqueous solvent carboxyl groups are produced inhibiting further growth of the polymer chains. The use of imidazolium cation will stabilize the π-segments along the polymer chain improving the electronic properties and the stability of the polymer. Since [HMIm]FAP is very hydrophobic there will be no attack by water molecules during the reaction process,30 and thus result in better properties. Such structure–property co-relationships might enable us to tailor the material and to understand the charge transport behavior at localized level in PEDOT layers for device fabrication.
3. Experimental
[HMIm]FAP was purchased from Merck KGaA in ultrapure quality (H2O, metals, halide < 10 ppm), while [EMIm]TFSA was delivered by IoLiTec GmbH in the highest available quality. The liquids were dried under vacuum at an elevated temperature of 100 °C to obtain water contents of below 3 ppm. EDOT (Bayer >99.5%) with a water content of below 0.005% was used as received, its concentration in the liquid was 0.05 mol L−1. All electrochemical experiments were performed inside an argon filled glove box (Vacuum Atmospheres OMNILAB) with water and oxygen below 1 ppm. All electrochemical experiments were performed using a PARSTAT 263A potentiostat/galvanostat controlled by PowerSuite software. The electrochemical cell was made of polytetrafluoroethylene (Teflon). A gold substrate served as a working electrode and platinum wires were used as quasi-reference and counter electrodes respectively. For STM measurements, Au(111) on mica purchased from Agilent was employed as working electrode. Directly before use, the gold substrates were very carefully heated in a hydrogen flame to red glow. Platinum electrodes were cleaned by heating to red heat in a hydrogen flame. The electrochemical cell was cleaned in a mixture of 50/50 vol% concentrated H2SO4 and aqueous hydrogen peroxide (30%) followed by refluxing in distilled water.The initial stages of the polymer deposition onto Au(111) were investigated by cyclic voltammetry, and in situ scanning tunneling microscopy. The STM experiments were performed with in-house designed STM heads and scanners under inert gas conditions with a Molecular Imaging PicoScan 2500 STM controller in feedback mode connected with a Picostat. Assembling of the STM head and filling of the electrochemical cell were performed in another glove box solely reserved for assembling of STM heads. The STM head was placed inside an argon-filled stainless steel cylinder, thus ensuring inert gas conditions during the STM experiment, transferred to the laboratory with a constant temperature of 23 ± 1 °C, and placed onto a vibration-damped table from IDE. To reduce thermal drift and hysteresis of the piezo to a minimum, the retracted STM scanner was kept scanning overnight with maximum scan range, thus reducing thermal drift as far as possible. STM tips were prepared by electrochemical etching of 0.25 mm 90![[thin space (1/6-em)]](https://www.rsc.org/images/entities/char_2009.gif) :10 Pt/Ir wires in 4 M NaCN solution followed by electrophoretic coating with an electropaint from BASF (ZQ 84-3225 0201). During the STM experiments the potential of the working electrode was controlled by the Picostat from Molecular Imaging. In all experiments the STM images were obtained by scanning from the bottom to the top with a scan rate of 2 Hz and a resolution of 512 pixels per line. The potential was held constant for each image and changed at the bottom of each new image starting up from the open circuit potential in 0.1 V steps. The scanning time of each image is about four minutes.
:10 Pt/Ir wires in 4 M NaCN solution followed by electrophoretic coating with an electropaint from BASF (ZQ 84-3225 0201). During the STM experiments the potential of the working electrode was controlled by the Picostat from Molecular Imaging. In all experiments the STM images were obtained by scanning from the bottom to the top with a scan rate of 2 Hz and a resolution of 512 pixels per line. The potential was held constant for each image and changed at the bottom of each new image starting up from the open circuit potential in 0.1 V steps. The scanning time of each image is about four minutes.
Scanning electron microscopy (SEM) images were acquired with a low voltage LEO 1530 instrument, and the samples were imaged without coating. SFM images were recorded in intermittent contact mode (Dimension 3100, Veeco), by using Si-probes OMCL 160TS, Olympus. The cantilever has a nominal spring constant of 42 N m−1 and a resonance frequency of 300 kHz. CSFM measurements were performed in contact mode (Multimode, Veeco) extended with a TUNA current amplifier module for conductivity measurements at ambient conditions. For CSFM, Pt/Ir coated probes were used (Nanosensors PPP-EFM-50, 70 kHz). The sample was glued on steel substrate by silver paste. Positive and negative bias voltages were applied always to the steel substrate and thus to the PEDOT layer. In order to minimize possible changes on PEDOT surface we used the minimum possible force to record the surface topography. To shield electromagnetic noise, the scanner was shielded by wrapping Al foil around the SFM recording setup.
4. Conclusions
PEDOT layers were grown on Au(111) by electropolymerization of EDOT in ionic liquids. In situSTM studies of the growth process reveal the under potential growth of PEDOT in the employed ionic liquid. This under potential deposition is a new observation and occurs presumably due to low surface potential of ionic liquids. The polymerization rate as observed by in situSTM was faster in [EMIm]TFSA mainly due to the lower viscosity and higher mass transport of [EMIm]TFSA (41 mPa s) compared to [HMIm]FAP (116 mPa s). Highly porous polymers can be grown in [HMIm]FAP due to its hydrolytic and electrochemical stability. PEDOT thin films illustrate reproducible, high electrocatalytic activity as seen from cyclic voltammograms, along with high current values at localized level. The porous structure can be advantageous to improve the catalytic activity in redox reaction for sensors as well as electrode materials in energy devices.Acknowledgements
One of us (S.A.) gratefully acknowledges the Alexander von Humboldt-Foundation for a financial assistance and R.B. to Deutsche Forschungsgemeinschaft-IRTG 1404. We wish to thank Uwe Rietzler and Maren Müller for their help.References
- B. L. Groenendaal, F. Jonas, D. Freitag, H. Pielartzik and J. R. Reynolds, Adv. Mater., 2000, 12, 481–494 CrossRef CAS.
- B. W. Jensen, O. W. Jensen, M. Forsyth and D. R. MacFarlane, Science, 2008, 321, 671–674 CrossRef CAS.
- Y. H. Ha, N. Nikolov, S. K. Pollack, J. Mastrangelo, B. D. Martin and R. Shashidhar, Adv. Funct. Mater., 2004, 14, 615–622 CrossRef CAS.
- A. Bello, M. Giannetto, G. Mori, R. Seeber, F. Terzi and C. Zanardi, Sens. Actuators, B, 2007, 121, 430–435 CrossRef.
- F. Endres, A. P. Abbott and D. R. MacFarlane, Electrodeposition from Ionic Liquids, WILEY-VCH, Weinheim, Germany, 2008 Search PubMed.
- S. Ahmad, M. Deepa and S. Singh, Langmuir, 2007, 23, 11430–11433 CrossRef CAS.
- M. Armand, F. Endres, D. R. MacFarlane, H. Ohno and B. Scrosati, Nat. Mater., 2009, 8, 621–629 CrossRef CAS.
- P. Hapiot and C. Lagrost, Chem. Rev., 2008, 108, 2238–2264 CrossRef CAS.
- S. Ahmad, R. Berger, H. U. Khan and H.-J. Butt, J. Mater. Chem., 2010, 20, 5325–5334 RSC.
- S. Ahmad, J.-H. Yum, Z. Xianxi, M. Grätzel, H.-J. Butt and M. K. Nazeeruddin, J. Mater. Chem., 2010, 20, 1654–1658 RSC; S. Ahmad, J.-H. Yum, H.-J. Butt, M. K. Nazeeruddin and M. Grätzel, ChemPhysChem, 2010, 11, 2814–2819 CrossRef CAS.
- M. R. Abidian, K. A. Ludwig, T. C. Marzullo, D. C. Martin and D. R. Kipke, Adv. Mater., 2009, 21, 3764–3770 CrossRef CAS.
- M. R. Abidian, D. H. Kim and D. C. Martin, Adv. Mater., 2006, 18, 405–409 CrossRef CAS.
- H. Xie, S.-C. Luo and H.-H. Yu, Small, 2009, 5, 2611–2617 CrossRef CAS.
- S. Z. El Abedin, P. Giridhar, P. Schwab and F. Endres, Electrochem. Commun., 2010, 12, 1084–1086 CrossRef.
- K. Wagner, J. M. Pringle, S. B. Hall, M. Forsyth, D. R. MacFarlane and D. L. Officer, Synth. Met., 2005, 153, 257–260 CrossRef CAS.
- F. Endres and S. Z. El Abedin, Z. Phys. Chem., 2007, 221, 1407–1427 CrossRef CAS.
- H. Sakaguchi, H. Matsumura, H. Gong and A. M. Abouelwafa, Science, 2005, 310, 1002–1006 CrossRef CAS.
- H. Sakaguchi, H. Matsumura and H. Gong, Nat. Mater., 2004, 3, 551–557 CrossRef CAS.
- Y. Lee, C. Chang, S. Yau, L. Fan, Y. Wang, L. O. Yang and K. Itaya, J. Am. Chem. Soc., 2009, 131, 6468–6474 CrossRef CAS.
- L. Y. O. Yang, C. Chang, S. Liu, C. Wu and S. L. Yau, J. Am. Chem. Soc., 2007, 129, 8076–8077 CrossRef CAS.
- T. Carstens, S. Z. El Abedin and F. Endres, ChemPhysChem, 2008, 9, 439–444 CrossRef CAS.
- R. Atkin, S. Z. El Abedin, R. Hayes, L. H. S. Gasparotto, N. Borisenko and F. Endres, J. Phys. Chem. C, 2009, 113, 13266–13272 CrossRef CAS.
- H. Randriamahazaka, C. Plesse, D. Teyssié and C. Chevrot, Electrochem. Commun., 2003, 5, 613–617 CrossRef CAS.
- L. Scifo, M. Dubois, M. Brun, P. Rannou, S. Latil, A. Rubio and B. Grévin, Nano Lett., 2006, 6, 1711–1718 CrossRef CAS.
- J. A. Lipton-Duffin, J. A. Miwa, M. Kondratenko, F. Cicoira, B. G. Sumpter, V. Meunier, D. F. Perepichka and F. Rosei, Proc. Natl. Acad. Sci. U. S. A., 2010, 107, 11200–11204 CrossRef CAS.
- A. Thomas, P. Kuhn, J. Weber, M. M. Titirici and M. Antonietti, Macromol. Rapid Commun., 2009, 30, 221–236 CrossRef CAS.
- R. Berger, H.-J. Butt, M. B. Retschke and S. A. L. Weber, Macromol. Rapid Commun., 2009, 30, 1167–1178 CrossRef CAS.
- S. Sadki, P. Schottland, N. Brodie and G. Sabouraud, Chem. Soc. Rev., 2000, 29, 283–293 RSC.
- S. Timpanaro, M. Kemerink, F. J. Touwslager, M. M. De Kok and S. Schrader, Chem. Phys. Lett., 2004, 394, 339–343 CrossRef CAS.
- N. V. Ignatev, U. Welz-Biermann, A. Kucheryna, G. Bissky and H. Willner, J. Fluorine Chem., 2005, 126, 1150–1159 CrossRef CAS.
Footnote |
| † Electronic supplementary information (ESI) available: In situ image of PEDOT in [HMIm]FAP and in situ studies of PEDOT grown in [EMIm]TFSA and redox behavior of PEDOT. See DOI: 10.1039/c0nr00579g |
| This journal is © The Royal Society of Chemistry 2011 |