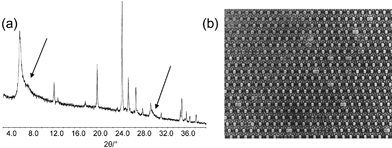
Pitfalls in the characterization of nanoporous and nanosized materials
Claudia
Weidenthaler
*
Max-Planck-Institut für Kohlenforschung, Kaiser-Wilhelm-Platz 1, 45470, Mülheim an der Ruhr, Germany. E-mail: weidenthaler@mpi-muelheim.mpg.de; Fax: +49 208 3062989; Tel: +49 208 3062181
First published on 13th January 2011
Abstract
With the advent of highly sophisticated analytical tools, numerous physical methods are nowadays available for comprehensive characterization of inorganic matter and, as special cases, of porous and nanosized materials. Intelligent experimental setup and correct evaluation of the experimental data can provide helpful insights into the chemical and physical properties of such materials. However, scanning of literature reports shows that in many cases evaluation and interpretation of experimental data are erroneous. As a result, the description of a new material can be useless or even worse, misleading. Wrong evaluation is even more critical if mechanistic theories are based on such data. Characterization of porous and/or nanosized materials is mainly performed by gas adsorption, X-ray powder diffraction, electron microscopy and surface spectroscopy. For correct interpretation of experimental data one should be aware of certain pitfalls. The present paper summarizes prominent faults and may show how they can be avoided. It is supposed to provide some hand-on knowledge on correct analysis of materials. Addressed are primarily non-experts and researchers being new to the field of characterization of inorganic nanosized or nanoporous materials.
 Claudia Weidenthaler | Claudia Weidenthaler studied Mineralogy at the University of Würzburg, where she received her doctorate in 1995 for her crystallographic studies on the structures of different zeolite materials. After this she worked as staff researcher in the department of crystallography at the University of Bremen. In 1998 she joined the group of Ferdi Schüth at the Faculty of Chemistry at the University of Frankfurt. Since 1999 she has a position as senior researcher at the Max-Planck-Institut für Kohlenforschung in Mülheim an der Ruhr. Her research focuses on the characterization of structure-property relationships of novel functional materials, especially by diffraction and spectroscopic methods. |
1. X-Ray diffraction
1.1 Broadening of X-ray diffraction peaks by small crystalline domains
Analysis of the broadening of Bragg reflections is a very convenient way to determine the size of crystalline domains from powder diffraction data. Albeit it seems to be a very simple correlation between peak broadening and the size of crystalline domains, it is a rather complex and demanding subject. This chapter will give a brief introduction into the determination of crystal size domains from powder diffraction data. Nowadays, powerful algorithms can be used for the analysis of microstructure properties. Even though these highly sophisticated methods are available, most of the times the classical Scherrer method is applied for evaluation of crystallite sizes.1 For this reason this review will focus mainly on problems and limitations with respect to the Scherrer equation and its unreflected application. For further reading the textbooks on microstructure analysis by Snyder et al.2 and Mittemeijer and Scardi3 are highly recommended. For a polycrystalline powder sample consisting of large, strain-free and perfect crystallites, the diffraction peaks of the powder pattern would be extremely narrow. Due to instrumental factors and materials properties, diffraction lines get broadened. The different materials properties leading to peak broadening can be summarized as follows:• size of crystalline domains
• strain
• shape of the crystalline domains
• size distribution
• dislocations
• twinning and stacking faults
• antiphase domains.
The list shows that not only the size of small crystallites but also several other microstructural properties can lead to broadening of reflections. A very crucial point for a reliable particle size determination is thus consideration of such additional factors and/or their exclusion. The physical reason for reflection broadening can be explained by a rather sophisticated mathematical approach based on diffraction conditions in reciprocal space but for simplicity it will be explained here via the simpler approach based on the Bragg equation. Due to the three-dimensional periodic arrangement of atoms in a crystal structure, a crystal will diffract monochromatic radiation in three-dimensional space. The angles at which diffraction occurs depend on the size and the symmetry of the unit cell. The intensity distribution of the diffraction maxima is mainly dependent on the position of the atoms in the unit cell and the scattering properties of these atoms. To predict diffraction phenomena and to express the relationship between the position of reflections and the wavelength of the radiation, father and son Bragg developed the famous Bragg relation.4–9 Crystal structures are built up by a periodic arrangement of atoms (Fig. 1).
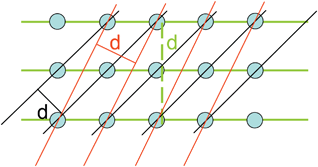 | ||
| Fig. 1 Periodically arranged atoms lying on different sets of parallel lattice planes, the distance between parallel planes is called the interplanar spacing d. | ||
The atoms can be interconnected in all three directions by imaginary planes representing different electron densities. Lattice planes of a given lattice are planes (or family of parallel planes) whose intersections with the lattice are periodic. All lattice planes can be described by a set of indices (Miller indices hkl) and the distance d between two parallel planes is called the interplanar spacing. Regarding to Snell's law, the angle θ of the incident beam and the angle of reflection are equal. For a constructive interference, it is mandatory that the waves reflecting from the different planes are in phase, requiring a path length difference of an integer multiple of λ. From Fig. 2 it can be seen that wave 2 has to travel a longer distance (ABC) than wave 1. Constructive interference occurs only if the phase lag for the distance ABC is an integer n of the wavelength λ. If the phase lag is not an integral integer of λ (e.g. 0.5λ), destructive interference will occur and the diffraction intensities will be canceled out.
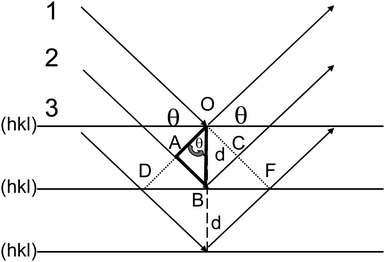 | ||
| Fig. 2 Bragg's law can be derived from the geometrical relation between the interplanar spacing d and the diffraction angle θ. For simplification, the atoms in this figure are omitted. | ||
Maximum amplitude or constructive interference is obtained at angles θ (eqn (1))
| nλ = 2dhklsin θ | (1) |
In large, perfect crystals, there is always a “deeper” lattice plane for which a path length distance of 0.5λ is valid. In case that the angle θ between the incoming beam and the lattice plane is deviating from the Bragg relation there is always a lattice plane to be found in the crystal which cancels out the deviating scattering. This produces sharp Bragg reflections at defined diffraction angles. However, for small crystals with finite dimensions, there might not always be a plane which could cancel out this scattering contribution. The relation between the broadening of reflections and the finite size of crystalline domains is clearly described by Jenkins and Snyder.10 As an example: if the incident beam is deviating 10% from the Bragg angle, the phase lag ABC would be 1.1λ. The sixth plane down from the surface will be exactly out of phase (phase lag 5.5λ) and will therefore cancel out the reflection from the first plane. For small deviations from the Bragg angle, say, a deviation of 0.01% corresponding to 1.0001λ, the wave of the first layer will be canceled out by layer number 5001. For small crystallites it could thus happen that plane number 5001 is not present and the slightly deviating wave will be not cancelled out. If this is the case then an intensity contribution will appear at somewhat lower θ angle and, thus, will lead to a broadening of the reflection. The relation between the thickness of a crystallite, Lhkl, number of lattice planes, N, and the interplanar distance, dhkl, is given by (eqn (2)):
| Lhkl = Ndhkl | (2) |
Crystals having sizes larger than roughly 100 nm do not contribute to the broadening of reflections. Such crystals have a sufficiently large number of lattice planes to ensure that waves not fulfilling the Bragg equation will be extinguished. Even though computer programs used for calculation of particle sizes from reflection broadening may yield numbers up to several thousand nanometres, only values up to about 100 nm should be seriously discussed for laboratory diffractometer data. The lower limit of detection of this method is between 1 and 3 nm, depending on the structural properties, scattering behavior of the material analyzed, and the instrument/radiation source used.
Fig. 3 shows calculated powder patterns of platinum assuming different crystallite sizes. Pattern (a) represents platinum consisting of crystallites larger than 100 nm. Pattern (b) shows the broadened pattern of platinum with crystallite sizes of about 10 nm. From pattern (c) it can be seen that crystallite sizes smaller than 3–2 nm result in extensively broadened reflections, that they cannot be distinguished from the background. At this point one should consider that the integrated intensities of the Bragg reflections are always constant, independent of the crystallite sizes. While the reflections broaden with smaller particle size, absolute intensities thus have to decrease for a given integral intensity.
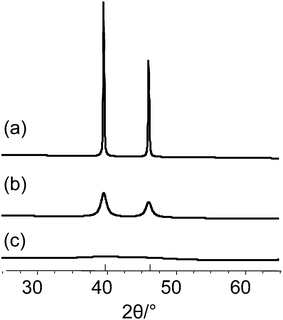 | ||
| Fig. 3 Calculated powder patterns of platinum, simulated for different crystallite sizes: (a) 100 nm, (b) 10 nm and (c) 1 nm. | ||
1.2 Crystal size determination
Unfortunately, quite often the term “particle size” is used inappropriately in combination with size determination from broadened X-ray reflections. The terms “grain”, “particle”, or “agglomerate” should not be mixed up with the term “crystallite”. The object shown in Fig. 4a consists of one single crystalline domain (i.e., a coherently scattering domain) with sizes of 10 nm × 10 nm along the two shown dimensions. Such a domain with a three-dimensional periodically ordered arrangement complies with a perfect “single crystallite”. Size determination from XRD reflections is sensitive to exactly such “coherently scattering domains”. In contrast to a single crystal, a “grain”, “agglomerate”, or “particle” might consists of several crystallites as illustrated in Fig. 4b. The shown agglomerate, consisting of several smaller crystalline domains, has a mean size of about 10 nm. X-Ray reflection broadening, however, is sensitive to the sizes of the smaller single crystalline domains. If the sizes of respective particles (grains, agglomerates) are determined by methods such as electron microscopy (EM) or dynamic light scattering (DLS), their total sizes will be assessed (about 10 nm) which are significantly larger than those of the individual crystalline domains as determined by XRD line broadening.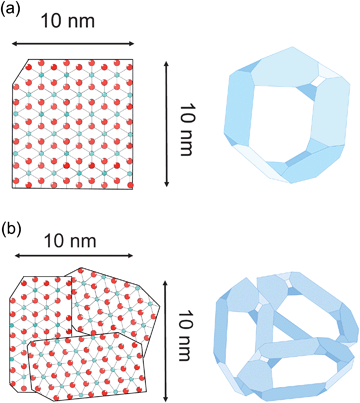 | ||
| Fig. 4 (a) Single crystallite and (b) three differently oriented crystallites form an agglomerate. | ||
Another reason why occasionally different sizes of particles are determined by electron microscopy and XRD is shown in Fig. 5. A crystal coated by a thick amorphous layer in total forms a particle being much larger than the crystalline part in the center. In such a case, the size of the crystalline domain, as determined by XRD, and that of the whole particle, as determined by electron microscopy or DLS, are different. However, if high resolution TEM is used, amorphous rim and crystalline core can be distinguished in many cases.
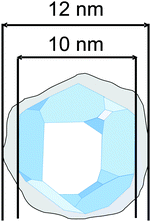 | ||
| Fig. 5 Illustration of a “particle” consisting of a crystalline core and an amorphous surface layer (grey color). The size of the crystallite is 10 nm and the overall size of the particle is about 12 nm. | ||
It should always be considered critically, what kind of information the different methods that are used for the determination of particle sizes actually provide and what type of size they assess. Powder diffraction data consider the size of coherently scattering domains. Aggregation of two or more domains forming larger agglomerates will not change the size of the individual single domains. Other methods might be not able to distinguish between agglomerates of smaller crystallites and large single crystalline domains. Light scattering and, in some cases, TEM are limited to this respect. In diffraction experiments, relatively large amounts of a given sample are analyzed, and the results therefore are generally very representative for the whole sample. In contrast to that, electron microscopy provides very local information. TEM is only applicable to rather thin samples. For this reason, usually only those parts of a given sample are investigated which are thin enough to allow an electron beam to pass through. Therefore, larger particles are easily overlooked, even though they might represent a major part of the sample. TEM images are thus often not representative for a whole sample.
The microstructure of crystalline solids, especially crystallite size and strain due to lattice distortions, governs important physical properties of materials. Already in 1918 Scherrer discussed that small-sized crystallites cause broadening of diffraction lines.1 The observation that the integral breadth of a reflection is inversely proportional to the apparent size was the basis for the so-called integral breadth methods. Based on earlier work,11,12 Stokes and Wilson identified lattice strain as another source of broadening.13 Deviation of the interplanar distances from the regular values causes line broadening, the degree of which differs for different (hkl)-classes of reflections. There are two classical approaches to obtain information about the microstructure from powder diffraction data. Both relate the determined parameters with defects and strain or crystallite size. The first approach is based on the expression of the measured pattern as a Fourier series.14 The observed diffraction profile h(x) is a convolution of the contribution f(x) from the sample, which contains the information about the microstructure, and an instrument function g(x). Stokes adapted the Fourier deconvolution method to obtain the corrected intensity distribution of a diffraction peak and therewith the pure physically broadened line profile from the measured pattern.14 For deformed metals and alloys, Averbach and Warren15–18 developed an algorithm, which separates the two main sources of broadening, i.e., size and strain. Williamson and Hall proposed a method for deconvolution of size and strain broadening by analyzing the peak width as a function of 2θ.19 The method can be applied to separated, well-resolved diffraction lines, and it is based on pattern deconvolution methods. Simplified integral-breadth methods (such as Scherrer or Williamson–Hall) assume either a Gaussian function for strain-broadening or a Lorentzian function for size-broadened profiles. The implementation of a Voigt function to the integral breadth methods has been shown to be an improvement.20,21 A limitation of the classical Warren–Averbach and Williamson–Hall methods is that strain anisotropy effects are not considered. Modified Williamson–Hall methods allow taking the dislocation strain field into account.22–24
For many decades, the size of crystallites or crystalline domains has been determined by application of the Scherrer equation (eqn (3)):
 | (3) |
In using the Scherrer algorithm, there are four major mistakes which can be made:
• using full-width-at-half-maximum, FWHM, instead of integral breadth β
• ignoring the contribution of the instrumental setup as a source of additional peak broadening
• evaluating peaks which consist of overlapping Bragg reflections
• ignoring the contribution of stress, strain, dislocations, twins or stacking faults to the broadening of reflections.
There are two different definitions for the width of a reflection that must be not confused, if crystallite size analysis should be precise (Fig. 6). The conventional FWHM describes the width of the diffraction peak in radians, at half height between the background and peak maximum. The integral breadth β represents the total area under the peak profile divided by the intensity at maximum (eqn (4)). It can be regarded as the width of a rectangle having the same area and the same height as the peak.
 | (4) |
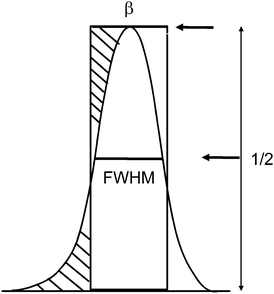 | ||
| Fig. 6 FWHM: width of the peak at ½ of its maximum intensity. Integral breadth β is defined by the width of a rectangle having the same area and the same height as the peak. | ||
As already mentioned, most profiles can be described by a Pseudo-Voigt function, a convolution of Gauss and Lorentz functions (Fig. 12, eqn (5)):
| pV(x) = ηL(x) + (1 − η)G(x) | (5) |
The convoluted profile can take any shape between the pure Gaussian profile (η = 0) and pure Lorentzian profile (η = 1) (Fig. 7).
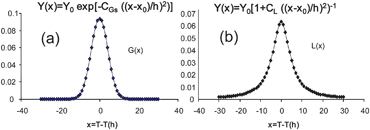 | ||
| Fig. 7 (a) Pure Gaussian profile and (b) pure Lorentzian profile. | ||
The relations between the integral breadth β and FWHM for Lorentz and for Gauss functions are (eqn (6) and (7)):
Lorentzian peak shape:
 | (6) |
Gaussian peak shape:
 | (7) |
In the case of peak broadening due to small crystallite sizes, the profiles have a dominant Lorentzian contribution. In such cases, FWHM and β will have significantly different values, and using FWHM in the Scherrer equation results in wrong particle sizes (Fig. 8). The integral breadth β is larger than FWHM, and as a consequence, crystallite sizes are overestimated using FWHM.
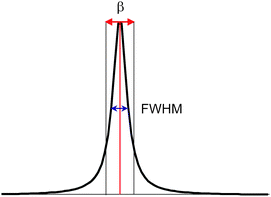 | ||
| Fig. 8 Peak with a pronounced Lorentzian peak shape illustrating the two different peak widths FWHM and integral breadth β. | ||
Quite often it is not considered that also the diffraction instrument contributes to the broadening of reflections. The measured profile H(x) is the result of the convolution of the sample-induced broadening F(x) and the instrument-induced broadening G(x) (eqn (8)):
| H(x) = F(x) × G(x) | (8) |
While we are interested only in the contribution of the sample to the broadening of the reflections, the measured reflection profile has to be corrected for the instrumental contribution. The latter is determined by measuring a reference material, such as LaB6 or silicon, consisting of crystallites with sizes large enough not to cause peak broadening. For a reliable analysis the use of suitable computer programs is recommended.
The next example illustrates how significantly the consideration of the instrumental contribution affects the calculated crystallite sizes. For deconvolution of size and strain contributions to the entire profile, a profile fit was performed. The profile fit allows a deconvolution of the peak shapes into Gaussian and Lorentzian contributions. For size evaluation, only the Lorentzian contributions are considered. During the fitting also integral breadths β and FWHM have been determined.
Without consideration of instrumental broadening, the average crystallite size of a nanosized Cr2O3 sample (Fig. 9) was determined to be 20 nm. After consideration of the instrumental contribution, a mean crystallite size of 15 nm was determined. This corresponds to an error of the results of about 25%, which underlines how important it is to consider the instrumental contribution properly.
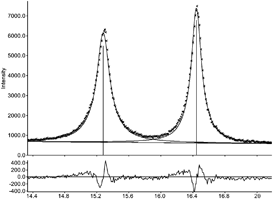 | ||
| Fig. 9 Section of the powder diffraction pattern of Cr2O3. The pattern shows the measured data (dotted line), the fitted data (solid line) and the difference curve (bottom). | ||
As discussed above, using FWHM instead of the integral breadth leads to much larger apparent crystallite sizes than actually are present. In the case of the Cr2O3 example, using FWHM results in a mean crystal size of 48 nm whereas using the integral breadth β results in a mean size of 15 nm.
The further discussion will show that for this specific example also the latter value is not correct, because a significant distribution of crystallite sizes has to be considered here. The effect of crystallite size distribution will be discussed in more detail in the next chapter.
1.3 Crystal size distribution
The Scherrer approach assumes a homogeneous size of the crystalline domains. This can lead to wrong results for crystallite sizes if a broad distribution from small to large crystallites occurs within one sample. The evaluation of the shape of the tails already gives a qualitative impression about the distribution of crystallite sizes. Small crystals contribute to the flanks of the reflections whereas larger crystals contribute more to the peak center. How significant peak profiles can vary, depending on whether the sample is monodisperse or polydisperse, is shown by the simulated diffraction peaks in Fig. 16. The powder pattern for a monodisperse sample consisting of 4 nm platinum crystals exhibits broadened peaks (Fig. 10a) while the diffraction peak of a sample consisting of 65 nm crystals is less broad (Fig. 10b). The analysis of such profiles would be straightforward. However, the picture looks different if the crystal sizes are polydisperse (Fig. 10c). If a sample consists of a mixture of very small and larger crystallites, the resulting peaks exhibit a very special shape. Ignoring the fact that the crystallite sizes are polydisperse would lead to a wrong mean crystallite size. Without applying appropriate analysis programs, it is very difficult to identify a size distribution if the sizes of the different fractions are not much different (Fig. 10d).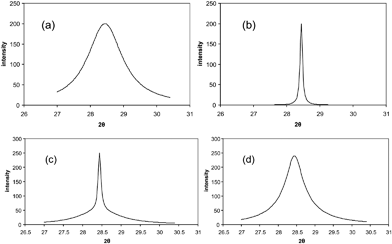 | ||
| Fig. 10 (a) Monodisperse sample with crystal size of 4 nm, (b) monodisperse sample with crystal size of 65 nm, (c) polydisperse sample with a mixture of crystals of sizes 4 nm and 65 nm, and (d) polydisperse sample representing a mixture of crystals of 4 nm and 11 nm sizes. | ||
Coming back to the Cr2O3 sample of which the XRD reflections are shown in Fig. 9, inspection of TEM images shows that in this sample a broad size distribution is present (Fig. 11). The sample consists of both large bulky crystals (A) and regions with an ordered, porous structure (B) (Fig. 11a). The latter region itself is formed of small crystals of Cr2O3 (C) which are arranged in such a way that large pores of about 10 nm are formed (Fig. 11b). The corresponding powder pattern of the sample shows a very pronounced Lorentzian peak shape (Fig. 9). For such type of samples, estimation of the domain sizes from the powder diffraction data by the simple Scherrer formula would lead to a mean crystallite size which would be absolutely meaningless. More elaborated evaluation algorithms have to be used, which consider a given size distribution.
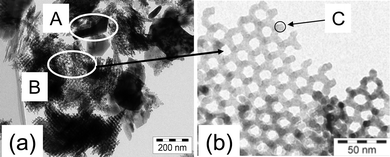 | ||
| Fig. 11 (a) TEM image showing an overview of the Cr2O3 sample with regions of bulk Cr2O3 (A) and of nanostructured Cr2O3 (B). (b) One individual crystalline domain is marked by the circle (C) (sample and TEM images provided by H. Tüysüz). | ||
Why size distribution should be carefully considered is shown for nanosized Co3O4 (Fig. 12). Both powder patterns correspond to nanocrystalline Co3O4 samples. As discussed above, the shape of the peaks already indicates that size distribution has to be considered. The use of the simple Scherrer algorithm is not sufficient as shown in the following. Using the integral breadth of the reflections for the calculation of the mean size results in 7 nm for sample A and 4 nm for sample B. The TEM image of sample A (Fig. 13) shows that the result for this sample is not correct since the Scherrer formula does not consider the very broad size distribution. For sample B the size distribution is rather homogeneous and the size obtained by XRD line broadening corresponds well with the TEM results (Fig. 13).
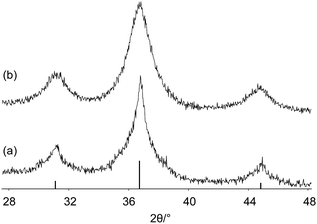 | ||
| Fig. 12 XRD patterns of Co3O4 (a) sample A and (b) sample B. | ||
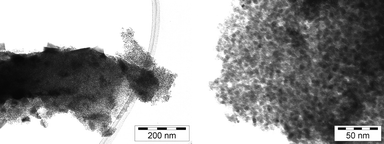 | ||
| Fig. 13 TEM images of samples A (left) and B (right). | ||
Modern algorithms for line-broadening analysis allow the analysis of both the mean apparent domain size and the size distribution. Fourier based methods consider all information contained in a peak profile. They consider instrumental broadening and broadening caused by strain effects and allow determination of the distribution of crystallite sizes.15–18 The line profiles of two catalysts with different size distributions are shown in Fig. 14.26 The reflection profile of a Pt catalyst supported on SiO2 is broad and flat (Fig. 14a) indicating a narrow size distribution, while the profile of Pd on carbon is more narrow and tall at the center (Fig. 14b) indicating a broad size distribution.
 | ||
| Fig. 14 (a) Pt/SiO2 catalysts with a narrow distribution of crystallite sizes and (b) Pd/carbon catalyst with a wide distribution of crystallite sizes. (Reproduced from ref. 25 with the permission of IUCr.) | ||
Fourier transform methods are based on the extraction of the sample-induced broadening F(x) from the Fourier transform of the measured profile H(x) and instrumental contribution G(x) (see eqn (8)). The Fourier coefficients C(n,L) [=A(n,L) + iB(n,L) with n: Fourier harmonic number and L: the order of reflection] of a profile can be expressed as product of real, order independent size coefficients ALS and complex, order-dependent distortion coefficients ALD. Considering only the cosine coefficients, a separation between size and strain effects is applied. Averbach and Warren15 assumed that the cosine coefficient AL of the line profile is the product of size, ALS, and strain, ALD, Fourier coefficients (eqn (9)):
| A(n) = ASLADL | (9) |
From the plot of the computed Fourier coefficients ALS for the (111) reflections of the metal catalystsversus the thickness L perpendicular to the diffracting planes hkl (Fig. 15) several size parameters can be obtained.
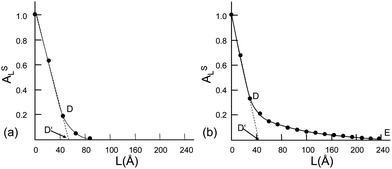 | ||
| Fig. 15 (a) Pt on SiO2 and (b) Pd on carbon. (Reproduced from ref. 25 with the permission of IUCr.) | ||
The intercept of the initial slope on the L axis gives the surface-weighted mean crystallite size (D′). The area DD'E represents the variance of the size distribution function. For the graph in Fig. 15a a narrow distribution results, and for the graph in Fig. 15b a broad one. The mean crystallite sizes for both catalyst compounds, determined by 3 different methods, are summarized in Table 1. The values D′ are obtained by Fourier methods, Dβ corresponds to the value obtained from the integral breadth, and DFWHM was based on FWHM.
| Catalyst | D′/nm | D β /nm | D FWHM/nm |
|---|---|---|---|
| Pt on SiO2 | 5.3 | 6.0 | 5.9 |
| Pd on carbon | 4.3 | 7.2 | 13.0 |
The double Voigt methods of analyzing peak broadening were first introduced by Langford and further developed by Balzar providing much the same information that one could obtain from the Fourier methods.20,27,28 The peaks are fitted using the Voigt function which allows us to determine Lorentz and Gauss contributions to each peak. This approach allows also correction for instrumental broadening. Structure independent methods for crystallite size determination from line profile analysis do have restrictions if reflections of different crystalline phases or several Bragg reflections overlap. This problem can be overcome if whole-powder pattern fitting (WPPF) methods are used. WPPF methods are based on arbitrary profile functions such as Voigt, pseudo-Voigt or Pearson VII functions. Nowadays, different algorithms are implemented in several Rietveld programs which allow the simultaneous refinement of crystal structure and microstructure properties. The Rietveld method relates the integrated intensities to a crystal structure model.29,30 Hereby, the information of each data point of a powder pattern is taken into account. From a known crystal structure model, the entire powder pattern can be calculated. This is not limited to a single phase system but is also applicable to multiphase systems. However, if the microstructure analysis is based on analytical profile functions, Rietveld refinement has limitations. For example if Voigt or pseudo-Voigt functions are used, the size distribution of dispersed nanocrystalline materials cannot be determined properly and size effects are overestimated.31 Compared to WPPF the whole powder pattern modeling (WPPM) approach allows the refinement of microstructure parameters by direct fitting of modeled and experimental data. The peak profile is modeled without using arbitrary empirical profile functions but is based on physical models. The advantages of WPPM over WPPF and conventional line profile analyses are: (a) all effects contributing to the line profile can be considered and (b) physical parameters, such as the domain size, size distribution, dislocation densities, distortions, such as faults and twins, are directly determined from the experimental data in terms of physical parameters without any intermediate stage of profile fitting.32,33
1.4 Anisotropic peak broadening
While small crystallite sizes cause a more or less uniform broadening of the entire diffraction profile, there may also occur broadening of only individual reflections. This effect is called anisotropic peak broadening for which various reasons, such as (1) anisotropy of the crystal shape, (2) anisotropic strain, and (3) stacking faults within the crystal structure, may account for.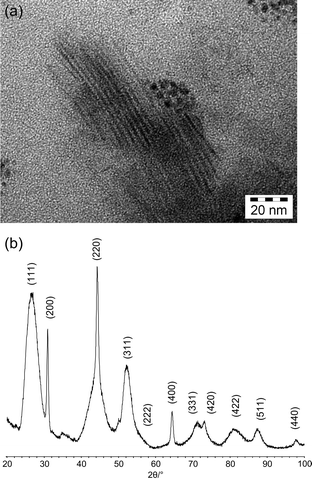 | ||
| Fig. 16 (a)TEM images of SrF2 nanoneedles (sample provided by C. H. Yan) and (b) powder pattern of SrF2 nanoneedles. | ||
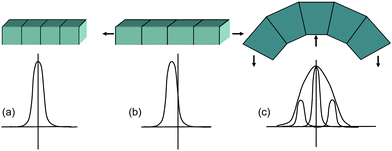 | ||
| Fig. 17 Diffraction profiles and positions if (a) no strain is applied, (b) uniform strain is applied, and (c) non-uniform strain is applied. | ||
If the broadening of reflections is caused by strain effects, the relation between “apparent” strain η and integral breadth as discussed by Stokes and Wilson can be applied.13 They report that for cool worked metals the “apparent strain” η is given by eqn (10):
| η = β(2θ)cot θ | (10) |
The relation of η with the “upper limit” strain ε is given by eqn (11):
 | (11) |
A deconvolution of size and strain components, having different angular dependences, is performed by the Williamson–Hall method.35,19 Contributions from the Scherrer domain size and from strain effects are both considered. If the Scherrer equation is modified in such a way that both, isotropic size and strain, are considered, the following relation is obtained (eqn (12)):
 | (12) |
If βcos θ is plotted against 2sin θ a straight line with slope 2ε and intercept kλ/L is obtained (k generally set to 0.9). The Williamson–Hall plot shown in Fig. 18 represents iron powders which were ball milled with different disk speeds (rpm).
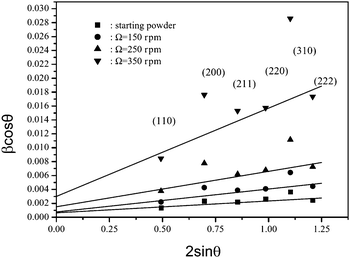 | ||
| Fig. 18 Williamson–Hall plot for samples prepared by ball milling by applying different disk speeds (150, 250, and 350 rpm).36 | ||
From the analysis of the slope, the strain contribution, ε or η, is determined, and from the intercept of the line with the y-axis, the mean domain size, L, is obtained. The evaluation of all four curves results in a decrease of the mean size of iron crystallites from 140 nm to about 30 nm with increased disk speed and an increase of the strain parameter η from 0.85 × 10⁻³ to 6.36 × 10−3.36
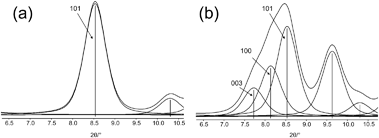 | ||
| Fig. 20 (a) Single Bragg reflection at 8.5°2θ, Miller index (101), and (b) three strongly overlapping Bragg reflections, (003), (100), and (101); as the result, a single peak is observed that comprises of three Bragg reflections. | ||
The Scherrer algorithm is sometimes applied without considering that this simple method is only applicable to single Bragg reflections. The method yields wrong values, if a measured peak is evaluated that represents the envelope of two or more overlapping Bragg reflections (Fig. 20). Fig. 21a shows a part of a powder pattern of a nanosized microporous zeolite. In fact, the peak at about 7.9°2θ consists of two overlapping Bragg reflections, i.e. the (101) and (011) reflections. Not knowing this fact easily could result in an assignment as a single reflection, as shown in Fig. 21b. Analogous considerations can be made for the reflection at about 8.8°2θ. Thus, calculated particle sizes would be smaller than those of the real particles actually being present in the sample.
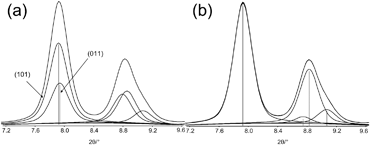 | ||
| Fig. 21 (a) Considering the correct number of overlapping Bragg reflections for analysis of the peak profile and (b) wrong profile analysis using only single Bragg reflections. | ||
The crystal size determination correctly considering both Bragg reflections as applied in Fig. 21a results in a correct mean crystallite size of 54 nm. If only one reflection is assumed, a wrong crystallite size of 43 nm is obtained.
For a reliable analysis it is important to consider the following points:
(a) For non-cubic systems, consideration of only one reflection can lead to very misleading results. If the crystals are shaped as plates or needles, usually the crystal size varies significantly in the three crystallographic directions. For example the analysis of predominant (h00) reflections represents the size in a-direction but does not provide any information about the size in b- and c-direction. On the other hand, a careful analysis of the reflections gives additional information about the morphology of the crystals.
(b) For low symmetry structures, the observed peaks often represent the envelope of several overlapping Bragg reflections. If the unit cell of the phase is unknown, it is not possible to assign the number of Bragg reflections contributing to one peak. In this case, only single reflections can be used for particle size determination. Assuming a single reflection instead of overlapping reflections results in wrong values.
Generally, TEM is a very local probe and therefore TEM images are not necessarily representative for the whole sample. Usually, only that part of a given sample is investigated that allows transmission of electrons which is in most cases the thinnest part of matter. For powder samples these are the smaller particles and larger particles and aggregates, that may be also present in the sample, are easily overlooked. The Cr2O3 example, shown in Section 1.3, can also be used to explain potential differences between crystal sizes from XRD and TEM data. From evaluation of the XRD data we know that the sizes of the Cr2O3 crystallites are not homogeneous but have a relatively broad distribution. Contradictory to this the TEM image, as shown in Fig. 11b, suggests that the size of the crystalline domains of the mesoporous Cr2O3 sample is about 8 nm. However, for that image the operator used a very thin piece of the sample representing exactly the nanoporous metal oxide structure expected. However, this image is not representative for the whole sample for which a survey image is shown in Fig. 11a. It shows that the sample contains nanoporous Cr2O3 consisting of ordered networks of Cr2O3 nanoparticles next to large, bulky Cr2O3 crystals. In general, XRD is more likely to detect all types of phases and crystallite sizes being present in a sample due to the relatively large amount of sample which is investigated, whereas TEM intrinsically shows only a rather tiny fraction of a sample. Using TEM, great care has to be taken to make sure that the images shown are representative for the whole sample. For this, survey scans from several fractions of the sample have to be made. The situation becomes especially difficult, if a sample consists of large and bulky particles through which transmission of the electron beam is not possible. Information from these parts of the sample is not easily accessible by TEM. Thinner parts of such a sample, that can be investigated by TEM, are not necessarily representative of the bulkier particles. More elaborated sample preparation methods, such as resin embedding and cutting, ion beam thinning, and the like, have to be applied to such samples.
 | (13) |
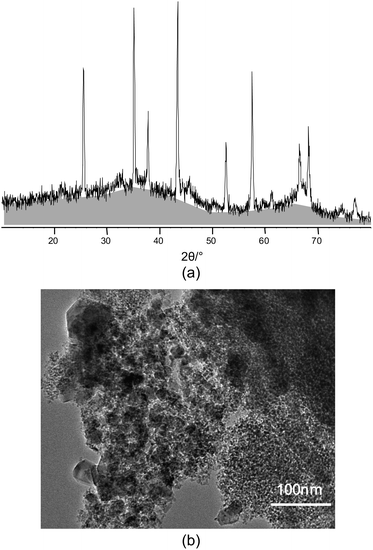 | ||
| Fig. 22 (a)X-Ray diffraction pattern of Al2O3. The increased background, marked as grey area, indicates the presence of an amorphous phase (sample provided by A. Martinez-Joaristi). (b) TEM image of the Al2O3 sample shows a very broad particle size distribution and the presence of very large crystals (TEM provided by A. Martinez-Joaristi). | ||
This simple equation is based on geometric relations between the surface area, volume, and mass of a body and strictly holds only for cubes (d = length of the edge) and spheres (d = diameter). Using that equation, the specific surface area for the crystalline Al2O3 phase is calculated to be about 22 m2 g−1. From N2 adsorption data, a specific surface area of 238 m2 g−1 is calculated. This surface area would correspond to a hypothetical crystal size of 6 nm. How can this mismatch be explained? A closer look on the diffraction pattern shows that the sample contains a large fraction of an amorphous component represented by the hump between 20 and 50°2θ. The amorphous component also contributes to the specific surface area of the sample as determined by gas adsorption. The high specific surface area is obviously caused by the amorphous compound rather than by the crystalline Al2O3 phase.
As a recommendation, it might be useful to distinguish clearly whether the surface area of the entire sample is of interest or rather the surface area of the crystalline component. In the first case, gas adsorption data can be used because they represent the integral surface area of the entire sample, in the latter case it is more reasonable to use data derived from XRD peak broadening or TEM.
1.5 Determination of diffraction peak positions
The unit cell parameters of crystalline materials are determined from the angular positions of the Bragg reflections. It is obvious that only a precise determination of the peak positions allows the determination of exact unit cell parameters. The determination of reflection positions is very sensitive towards misalignment of both the instrument and the sample position. Fig. 23 shows the effect of the sample height on the peak position for Bragg–Brentano geometry.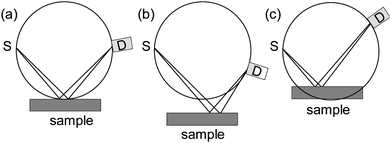 | ||
| Fig. 23 (a) Sample is positioned correctly, (b) sample position is too low, and (c) sample position is too high. | ||
All three components, i.e., X-ray source (S), sample surface, and detector (D), have to lie on the focusing circle of the diffractometer. If that is the case, the focusing conditions are perfectly fulfilled and a given Bragg peak will be detected at the correct 2θ position (Fig. 23a). If the sample is positioned too low, either due to incomplete filling of the sample holder or due to wrong positioning of the sample stage and/or sample holder, the same Bragg reflection will be detected at too low 2θ angle (Fig. 23b). If the sample is positioned too high (Fig. 23c), the Bragg reflection will be determined at too high 2θ angle. The use of incorrect reflection angles results in either too small or too large lattice parameters. The magnitude of the position error in radian can be expressed as eqn (14):38
 | (14) |
Table 2 summarizes the errors resulting from the deviation from the optimum sample position for a goniometer with radius R = 275 mm using the data as shown in Fig. 24. A position shift of the sample of only a few hundred micrometres results in significant peak shifts and, as a result, significant shifts of the lattice parameters.
| Too high | Ideal position | Too low | |
|---|---|---|---|
| 2θ position (°) for Cukα | 28.551 | 28.458 | 28.216 |
| Δ2θ/° | 0.093 | 0 | −0.242 |
| d Value/Å | 3.1238 | 3.1337 | 3.1602 |
| Sample shift/µm | 220 | 0 | −600 |
| Lattice parameter/Å | 5.4106 | 5.4277 | 5.4736 |
| ΔLattice parameter/Å | −0.017 | 0 | 0.0459 |
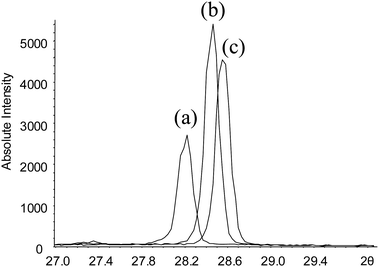 | ||
| Fig. 24 Si (111) X-ray reflection measured with (a) too low sample position, (b) correct position, and (c) at too high sample position. | ||
How can peak positions be determined precisely? First, the alignment of the diffractometer should be checked. For correction of specimen displacement, an internal standard should be used. There exist several reference materials, such as silicon or LaB6 powders that are commercially available. Precise determination of reflection positions is mandatory for the interpretation of changes of a given unit cell (swelling, shrinkage, incorporation of guest atoms or molecules in a crystal structure). For nanoparticles the exact determination of positions from the broadened peaks is difficult. Therefore, the lattice parameters calculated from these peak positions are less precise and require very careful evaluation.
2. X-Ray photoelectron spectroscopy (XPS)
X-Ray photoelectron spectroscopy (XPS) is a surface sensitive spectroscopic method for the chemical characterization of the first atomic layers of a solid surface. It provides information about the chemical elements on or close to the surface, i.e., their oxidation states and their chemical environments. XPS was developed for probing the surfaces of structured samples, such as thin films or layered materials. Nowadays, surface sensitive methods are also applied in the fields of heterogeneous catalysts and nanoscaled materials. The following examples might help to avoid frequent mistakes in interpretation of XPS data.2.1 Encapsulated particles: what is inside what is outside?
It has been shown previously that small Au nanocrystals (15 nm) can be encapsulated in a shell consisting of nanocrystalline ZrO2 (Fig. 25).39 The thickness of the wall of the ZrO2 shell was determined to be about 15 nm.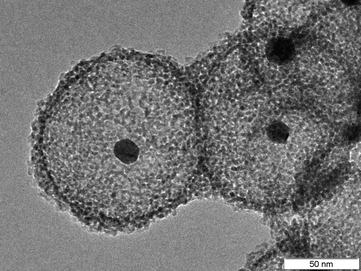 | ||
| Fig. 25 TEM image of Au nanoparticles encapsulated in ZrO2 hollow spheres (sample provided by M. Paul). | ||
The sample was analyzed by XPS with respect to the question whether it would be possible to detect the nanoparticles inside the hollow spheres by such a type of surface sensitive method. The as-made sample does not show any Au signals with significant intensities, whereas a second sample, for which the spheres have been crushed prior to analysis, clearly shows the presence of Au (Fig. 26). The figure shows the survey scans for both samples with the main photopeaks belonging to C, O, and Zr. The high resolution scans in the energy range characteristic for the main Au 4f signal collected with high counting rates exhibit a clear Au signal for the crushed sample in contrast to the very weak intensities for the as-made sample. This experiment shows that there is a high probability that nanoparticles encapsulated in a matrix or shell cannot be detected by surface sensitive XPS. In the case of the crushed spheres, the nanoparticles are no longer buried inside the closed spheres but exposed to the surface and thus detectable by XPS.
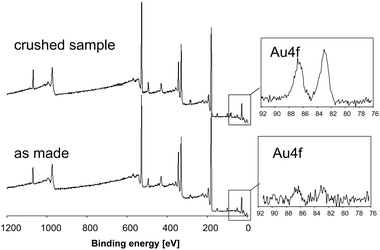 | ||
| Fig. 26 XPS scans of an as-made sample of Au in ZrO2 hollow spheres and of a crushed sample. The insets show the high resolution scans of the Au 4f energy range. | ||
The second example highlights Fe2O3 nanoparticles encapsulated in the pores of a synthetic carbon material (CMK-5) (courtesy of An-Hui Lu). TEM investigations confirm that the nanoparticles are almost completely incorporated in the pores of the carbon host (Fig. 27). The quite monodisperse nanoparticles are visible as dark spots inside the carbon matrix. The crystalline character and the composition of the nanoparticles are verified by XRD analyses (Fig. 28). Beside the reflections belonging to Fe2O3, reflections originating from the sample holder are present. The transmission of the X-ray beam in carbon materials is very high for which reason the X-ray beam might penetrate completely through the sample and finally hits the bottom of the sample holder. If the sample holder consists of crystalline metal such as aluminium or steel, diffraction peaks of the sample holder material are produced. If the reflections cause any problems during data evaluation, sample preparation on sample holders made from cut single crystals or polymeric material is recommended.
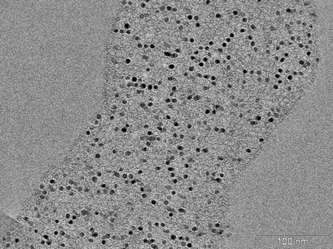 | ||
| Fig. 27 TEM image of nanoparticles of Fe2O3 encapsulated in the pores of synthetic CMK-5 carbon material (sample provided by J. Nitz and A. H. Lu). | ||
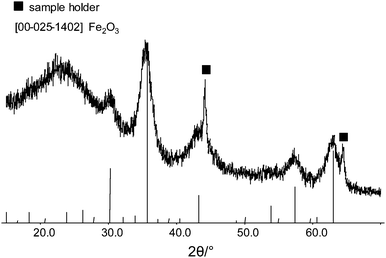 | ||
| Fig. 28 Powder diffraction data of the Fe2O3 nanoparticles in carbon. The marked reflections are due to the sample holder. | ||
Since the walls of the carbon host are only several nanometres thick, one might try detecting the embedded nanoparticles by XPS. However, this is not possible as shown in Fig. 29. The main Fe 2p signal at 711 eV is not visible, indicating a complete shielding of the photoelectrons by the carbon matrix. A possible explanation might be the high electron conductivity of the carbon host which does not allow the photoelectrons to escape from the sample. Another explanation might be that the carbon walls are in fact too thick (more than 2–3 nm), so that photoelectrons, generated in the Fe2O3 nanoparticle, cannot escape from the inner part of the sample to the surface.
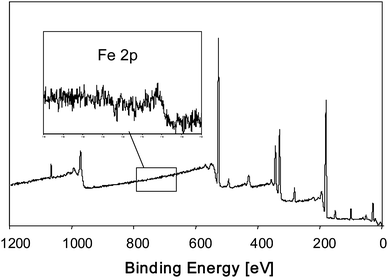 | ||
| Fig. 29 XPS spectrum of Fe2O3 nanoparticles encapsulated in carbonaceous CMK-5. The intersection shows the narrow scan for the main Fe2p3/2 energy region. | ||
As the examples illustrate, care must be taken if XPS is used for the analysis of encapsulated or matrix-embedded particles. The escape depth of electrons is not very deep and therefore the embedded nanoparticles become invisible for this method.
2.2 Sputtering of nanosized compounds with argon cations
Sputtering with argon ions is a very common method for cleaning surfaces of solid samples from contamination or from surface oxygen layers. While this treatment is very suitable for solid structured materials, such as coated wafers, it cannot really be recommended for nanosized materials. The two examples presented below show that sputtering does not only remove surface contamination but that it also might change the chemical nature of elements. Scan (a) in Fig. 30 displays the energy region of the Co 2p photopeak of bulk CoAl2O4. The two Co 2p signals at 780.6 eV and 796.5 eV represent the spin–orbit couple typical for Co in the oxidation state +2.40 The spin–orbit interaction (also called spin–orbit coupling) is an interaction between the spin and the angular momentum of an electron after photopolarization. For unpaired electrons, there are two possible energetic states depending on whether spin and orbital angular momentum are parallel or anti-parallel. This causes shifts in the energy levels of electrons which become detectable as splitting of spectral lines. After sputtering the sample for several minutes, an additional signal appears at 777.8 eV, belonging to metallic cobalt.40 Since the presence of metallic cobalt in the original spinel sample can be excluded, the metallic species is likely to be generated during sputtering. This effect is known as preferential sputtering.41 Ion bombardment can lead to a depletion of the element with the higher sputter yield corresponding mostly to the elements with low mass. Transition metal oxides are known to release oxygen during sputtering, which then is associated with the reduction of the metals.42,43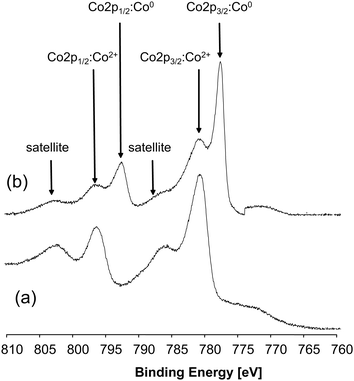 | ||
| Fig. 30 XPS spectra of CoAl2O4 sample (a) before and (b) after sputtering with Ar ions. | ||
The example shown in Fig. 31 demonstrates that cobalt is not the only element that gets reduced by ion bombardment. MoO2 is also sensitive to preferential sputtering. Spectrum (a) shows the Mo 3p photopeaks (Mo 3p3/2 and Mo 3p1/2) of commercial MoO2 before ion bombardment. The binding energy of 397 eV for the Mo 3p3/2 indicates Mo2+ as the oxidation state. After sputtering for 5 min (spectrum b) the main signal at about 397 eV became less intensive and a second signal at about 393.4 eV has appeared. After 10 min sputtering time, the signal at 397 eV has disappeared completely and only the signal at 393.4 eV, belonging to metallic Mo, is remaining.
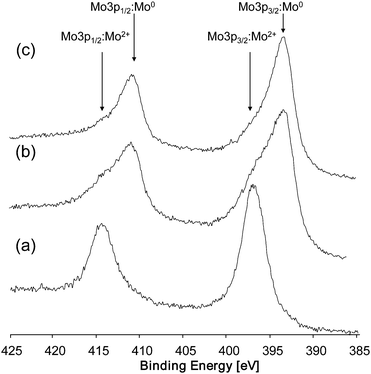 | ||
| Fig. 31 XPS spectra of MoO2 (a) before sputtering, (b) after 5 min sputtering, and (c) after 10 min sputtering. | ||
The examples demonstrate that surface cleaning by ion bombardment of a sample containing transition metal ions creates substantial problems for reasonable discussions about the oxidation states of specific elements. There is a high probability that the oxidation state of several transition metals is modified by the sputtering procedure itself. That makes any assessment of oxidation states of the pristine materials quite difficult. Another question one might raise is whether it makes sense at all to sputter nanosized particles with the purpose to remove surface oxide layers. Fig. 32 illustrates two entirely different sample types. Sample (a) shows a macroscopic Co metal substrate with a thin CoO surface layer, sample (b) a cobalt nanoparticle coated with the same surface layer. The sketch in Fig. 33 illustrates what happens during ion bombardment of these samples.
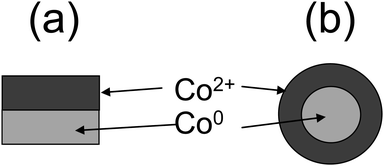 | ||
| Fig. 32 (a) Structured sample consisting of a metal substrate (Co0) and cobalt oxide (CoO) layer and (b) spherical nanoparticles with an inner part consisting of metallic cobalt coated by CoO. | ||
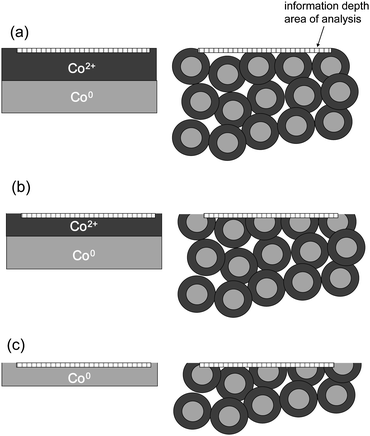 | ||
| Fig. 33 Sketch of structured macroscopic samples and nanosized samples and the illustration of exposed surfaces: (a) before sputtering, (b) after short sputtering, and (c) after extended sputtering. | ||
Without sputtering in both cases only the Co oxide surface coating will be detected (Fig. 33a). At the begin of ion sputtering, the spectrum does not change for the macroscopic sample whereas for the nanomaterial, depending on thickness of the surface layer and sputtering time, both Co2+ and Co0 are detected (Fig. 33b). After a certain time of sputtering, the surface layer of the macroscopic sample will be removed completely and the Co support is exposed (Fig. 33c). For the nanosized sample, the situation has not changed, still both, Co2+ and Co0, are detected simultaneously. For nanosized materials, even after extended sputtering, one always will detect a mixture of oxidation states. These differences have to be taken into account for the interpretation of XPS results from ion-sputtered samples.
Sputtering of nanosized materials is a difficult issue which should only be applied if it can be excluded that the chemical elements are reduced by the ion bombardment. It should also be considered that for coated systems always a mixture of the oxidation state of the inner and out species will be measured.
2.3 Different results for XRD and XPS analyses
Whenever results from different analytical methods are compared, it should be taken into account to what the different methods are sensitive. Interpretation of powder diffraction and XPS data from the same sample might lead to completely different conclusions about the composition of the sample. The semiconductor material TiSi2 is considered as a photocatalyst for water splitting.44 For characterization of the bulk material, the sample was investigated with X-ray powder diffraction. From the powder pattern, a mixture of crystalline phases with TiSi2 as a main compound along with Ti, TiSi, and Si by-phases has been identified (Fig. 34).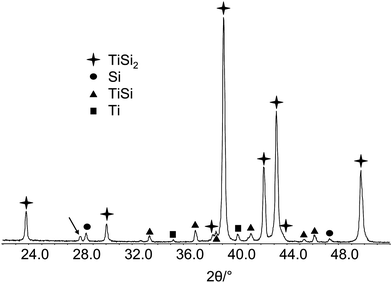 | ||
| Fig. 34 X-Ray powder diffraction pattern of bulk TiSi2. | ||
Additionally to the XRD analysis, X-ray photoelectron spectroscopy was performed (Fig. 35). The spectra for the two main elements Ti and Si show that on the surface both elements are present in the oxidation state +4. This is due to the oxidation of the surface layers of TiSi2. The contribution of the zerovalent elements to the surface composition is relatively low. In contrast to the XPS data, the powder diffraction measurements did not show any indication for oxidic phases in the sample. This is due to the fact that the oxide layer is rather thin and its total volume is thus too small for detection with conventional XRD. The contribution of TiSi2 to the diffracting volume is much higher than that of the oxidic surface phases. In addition, the oxidic phases may be non-crystalline. In that case, they would be not detectable directly by XRD even if present in larger amounts.
 | ||
| Fig. 35 High resolution scans (a) of the Ti 2p binding energy range and (b) of the Si 2p energy range. | ||
However, the combination of both bulk sensitive (XRD) and surface sensitive (XPS) methods is very powerful and allows establishing the model as shown in Fig. 36.
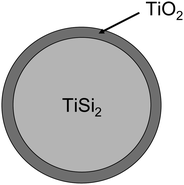 | ||
| Fig. 36 Proposed model for the structure of the TiSi2–TiO2 composite. | ||
Another very valuable combination for the characterization of nanosized compounds is the combination of XRD with solid state nuclear magnetic resonance spectroscopy (NMR). While XRD investigates structural long-range order, NMR spectroscopy analyses short-range order phenomena. This allows closer inspection of nanosized compounds which are either too small for XRD or for which the structures are not well-ordered.
3. Gas adsorption
Physical gas adsorption is one of the most important techniques to characterize nanosized porous materials in terms of specific surface area, pore size distribution, and pore volume.3.1 Specific surface area
The specific surface area of a (porous) material is determined from physical gas adsorption on the external and internal surface. The amount of adsorbed gas is dependent on the relative vapor pressure (p/p0). The relation between relative vapor pressure, p/p0, with p0 being the saturation pressure, and the amount of adsorbed gas at a certain constant temperature is called an adsorption isotherm. The classification of isotherms into six types, as shown in Fig. 37, was proposed by the IUPAC.45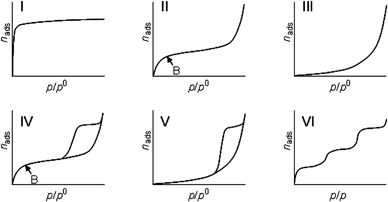 | ||
| Fig. 37 Different types of physisorption isotherms as observed for different adsorbents: type I: microporous, type II: non-porous or macroporous, type III: non-porous or macroporous with weak interaction, type VI: mesoporous, type V: mesoporous with weak interaction, and type VI: layer-by-layer adsorption. | ||
The different types of physisorption isotherms are indicative for different adsorbent materials (Fig. 37):
Type I isotherm: microporous adsorbents: isotherm is governed by adsorption in micropores at low relative pressure.
Type II isotherm: non-porous or macroporous adsorbents: formation of multilayers of adsobate on surfaces of adsorbent, knee at point B indicates completion of monolayer coverage.
Type III isotherm: non-porous or macroporous adsorbents: weak adsorbent–adsorbate interactions; monolayer coverage cannot be identified (non-wetting adsorbate).
Type IV isotherm: mesoporous adsorbents: initial monolayer–multilayer coverage on external and mesopore surface is followed by capillary condensation in mesopores; different types of hysteresis loops are observed depending on the shape of pores.
Type V isotherm: mesoporous adsorbents: weak adsorbent–adsorbate interactions; uncommon isotherm, e.g., observed for water adsorption on activated carbon.
Type VI isotherm: highly uniform surface: layer-by-layer adsorption on a highly uniform surface; uncommon isotherm.
The specific surface area of a given material can be assessed if the number of molecules in a monolayer of the adsorbate and the occupied space by one molecule are known. Usually, the volume related to point B is supposed to be that of the monolayer. Quite often, the exact determination of that point is rather difficult, e.g., if the knee is not well defined. Therefore, models have been developed to assess the monolayer capacity of a given adsorbent. While the Langmuir model of adsorption is based on the assumption that only a monolayer of gas is adsorbed on the surface of a solid, multilayer adsorption is considered by the method developed by Brunauer, Emmett, and Teller (BET method).46 The BET theory, based on a simplified model of monolayer–multilayer adsorption and representing an extension of the Langmuir model, is used as a kind of universal method for the determination of specific surface areas. However, the BET method is a relatively limited method for determining surface areas of nanosized materials because it is based on several assumptions:
1. Homogeneous flat surface consisting of equivalent adsorption sites.
2. Only the uppermost molecules of a multilayered adsorbate are in dynamic equilibrium with the vapor.
3. Heats of adsorption for all layers except the first are equal to the heat of condensation.
4. A molecule covered by another molecule cannot evaporate.
5. At saturation (p/p0 = 1) the number of layers becomes infinite.
6. No lateral interaction between adsorbed molecules.
7. Equilibrium is achieved when the rate of condensation is equal to the rate of evaporation.
Based on these assumptions, the BET can be expressed by eqn (15):
 | (15) |
The BET equation requires a linear relationship between p/nads(p0 − p) and p/p0 as shown in the BET plot (Fig. 38). Linearity is typically observed only in the range of the relative pressure (p/p0) between 0.05 and 0.3. At higher p/p0 values capillary condensation occurs and the BET equation is no longer valid.
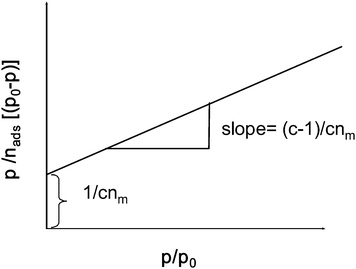 | ||
| Fig. 38 BET plot and relation between c and nm to slope and intercept of y-axis. | ||
The specific surface area, SBET, is calculated from the monolayer capacity nm by eqn (16):
 | (16) |
The BET algorithm can be used for the calculation of specific surface areas of nanoscopic materials but the surface of a particle with a size of only a few nanometres is not flat but strongly curved and the individual adsorption sites are not necessarily uniform but energies of adsorption may vary significantly from site to site. Also for nanoporous materials specific problems arise as indicated in the next chapters.
3.2 Determination of specific surface area of microporous materials
As kind of take-home message, it can be noted that the BET method is applicable for the determination of specific surface areas of non-porous solids as well as of mesoporous and macroporous materials. The application of the BET equation to microporous solids, however, fails since the BET model does not correctly describe adsorption in micropores. Adsorption in micropores is governed by strong adsorbent–adsorbate interaction due to overlapping adsorption potentials of opposing pore walls at very small distances to each other, resulting in complete filling of the micropore at very low relative pressures (at plateau of type I isotherm). Furthermore, multilayer adsorption, which is the basic assumption for the BET model, is not possible in the narrow micropores. Applying the BET algorithm on type I isotherms would consider all molecules adsorbed in the volume of the micropores to be located in a monolayer. Therefore, monolayer capacity and thus specific surface area in most cases result in unrealistically high values. Instead of using the BET method for the determination of the specific surface area of microporous materials, more elaborated methods based on the non-local density functional theory (DFT) should be rather used.48–50 Modeling of the interaction between a given adsorbate with an adsorptive at a certain temperature allows calculation of density profiles of adsorbate films on the surfaces of adsorbates. Thus, model isotherms can be calculated for hypothetic materials with a given pore size. Matching a measured isotherm with a set of such model isotherms allows assessment of pore size distributions, pore volumes, and pore wall surface areas.51,52 Micropore volumes are as well accessible by application of empirical methods such as the t-plot or αs-plot methods.533.3 Determination of pore size distribution of mesoporous materials
The adsorption behavior of mesoporous materials is determined by both, adsorbent–adsorbate interactions and interactions between the adsorbent molecules. This leads to pore condensation in addition to multilayer adsorption. For pore condensation, a gas condenses in a pore to a liquid-like phase at pressures below the saturation pressure p0 of the bulk liquid. Adsorption in mesoporous materials is represented by type IV and V adsorption isotherms. In the region of low p/p0 values, the type IV isotherm is similar to isotherms of non-porous materials (type II). Monolayer adsorption and initial steps of multilayer formation are similar on an external surface of a particle and on the walls of mesopores. At higher p/p0, a deviation of the type IV isotherm from the type II isotherm is visible which is caused by capillary condensation in the mesopores. Capillary condensation occurs in mesopores when multilayer adsorption in such pores proceeds to a point at which adsorbed layers from opposing walls meet each other and form a concave meniscus. Adsorption on concave adsorbate films is strongly enhanced and thus rapid filling of the mesopores is observed which is characterized by a distinct step in the isotherm. The relation between the change in vapor pressure and the curvature of a meniscus with radius r is described by the Kelvin eqn (17): | (17) |
In the case of complete wetting, a multilayer film has adsorbed on the pore walls. The thickness t of a multilayer film has to be considered for the calculation of the pore radius rp of cylindrical pores (Fig. 39) by eqn (18):
| rp = rK + t | (18) |
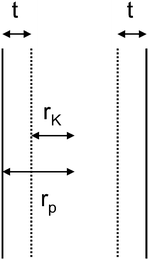 | ||
| Fig. 39 Formation of a multilayer film of the thickness t in cylindrical pores with the pore radius, rp, and the Kelvin radius, rK. | ||
The Kelvin equation describes the interaction of a meniscus of liquid-like adsorbate with an adsorptive in the gas phase at equilibrium and thus applies correctly only for the desorption process since the capillary filling upon adsorption is no equilibrium process. The Kelvin equation based on cylindrical pores is used for the evaluation of the pore size distribution of mesopores by the Barrett–Joyner–Halenda (BJH) method.54 The pores are filled by capillary condensation assuming a hemispherical liquid–vapor meniscus and a defined surface tension. The BJH algorithm is based on a stepwise emptying of the pores after the stepwise reduction of p/p0. Because the Kelvin equation is a purely thermodynamic construct and does not take explicit account of the structure at the molecular level, it becomes inaccurate for small mesopores (below about 50 Å4,5) and fails to describe adsorption in micropores (defined as having pore widths <20 Å).55
A very comprehensive and helpful review on “…misinterpretation and wrong assignment of adsorption data…” is given by Groen.56 The focus of the review is on the correct determination of pore size distributions. Pore size determination of materials with small mesopores and materials with both meso- and micropores can be influenced by a tensile strength effect or fluid-to-crystalline like phase transitions. The tensile strength effect causes a characteristic step-down in the hysteresis loop which is related to the instability of the meniscus of the liquid–gas interface rather than to properties of the pore structure of the material. Ignoring this effect, the evaluation of the desorption branch can result in an artificial narrow peak in a BJH pore size distribution at about 3.5–3.8 nm due to a step at p/p0 ≈ 0.42. Only the careful evaluation of both, adsorption and desorption, branches can prove whether this effect is real or not for materials with uniform cylindrical pores. If only the evaluation of the desorption branch results in a narrow pore size distribution (i.e., only the desorption branch shows a sharp step), then different factors have to be taken into account. Fig. 40 shows the nitrogen adsorption isotherms of three different mesoporous SBA-15 samples, the pores of which are coated with carbon. The isotherms exhibit a drop in the desorption branch close to p/p0 = 0.42 (dotted line).
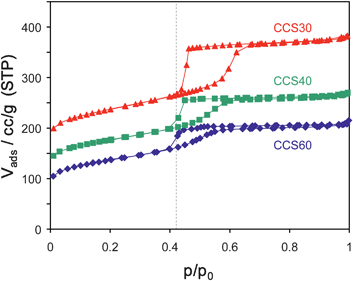 | ||
| Fig. 40 Nitrogen sorption isotherms (77 K) for different SBA-15 materials with mesopores that are coated with carbon (experimental data provided by An-Hui Lu, the isotherms of CCS40 and CCS30 have been shifted by 60 and 90 cc g−1). | ||
Problems arise if the desorption branch is used for the evaluation of pore sizes of these materials with the BJH method, as shown in Fig. 41. For all samples, pore diameters of about 35 Å are calculated from the desorption branch (Fig. 41a). If the adsorption branches are used instead, significantly different pore diameters are calculated for the different samples (Fig. 41b).
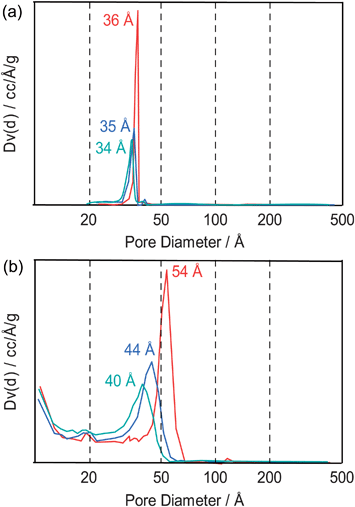 | ||
| Fig. 41 (a) Calculated pore sizes of three different SBA-15 materials if the desorption branch is used for the evaluation and (b) calculated pore sizes if the adsorption branch is being used. The color code corresponds to the color code in Fig. 40. | ||
What are the reasons for those differences? In Fig. 40 one can discern two different types of hysteresis loops, one that closes at relative pressures above 0.42 (CCS30) and two that close more or less exactly at that pressure (CCS40 and CCS60). For the sample CCS30 for which the hysteresis loop closes above the relative pressure of 0.42, the desorption step indeed reflects a pore width, namely that of narrow pore entrances that extend to wider inner pores (ink bottle effect). On the contrary, the adsorption branch of the hysteresis reflects adsorption on these wider inner pores and data evaluation of that branch results in a pore width for that part of the pore system.
For the other two samples, the hysteresis loops close at a relative pressure of 0.42. One should mention here, that the visible lines simply connect neighboring data points and do not necessarily reflect the true shape of the isotherms in regions with abrupt changes of slopes. In these cases it is difficult to discern between the tensile strength and ink bottle effect. The adsorption branches increase quite steadily whereas the desorption branches drop instantly at the mentioned pressure. For these samples one cannot conclude with certainty that a narrow pore neck exists from nitrogen adsorption isotherms. If more information is needed on such materials, sorption measurements with argon as adsorbent can be helpful. For argon the tensile strength effect is observed at lower relative pressures, especially if measurements are performed at 77 K instead of 87 K.57
Another effect that can be effective in changing the shape hysteresis loops is cavitation. It occurs during desorption from pores that are blocked at their entrances by very narrow windows.58–60 In such cases, an empty bubble is formed within the pore fluid while the pore necks are still filled with adsorbate. The critical pore diameter for adsorption in infinitely long cylindrical channels in silica materials below which cavitation is likely to be encountered is about 5 nm for nitrogen adsorption at 77 K and argon adsorption at 87 K, and about 4 nm argon adsorption at 77 K.61,62 These critical pore diameters have been estimated from model calculation on the basis of the non-local density functional theory (NLDFT).
This theory also allows computing of interactions of molecules in gas phase with solid surfaces. Thus, model isotherms for materials with given pore shapes and surface properties can be calculated. Complete sets of model isotherms can then be matched to measured isotherms.63–65 As the result, pore size distributions are obtained which are considered to be much preciser than those obtained from the BJH theory. The latter is known to underestimate pore sizes, especially for smaller mesopores.
Modern program packages for sorption data evaluation make use of that NLDFT approach. Calculating pore widths from the desorption branches of the isotherms as shown in Fig. 40 with the Autosorb 1.52 software package of Quantachrome, using the kernel for nitrogen adsorption on carbons at 77 K applying the equilibrium model, results in pore widths of about 51 Å for CCS30, 49 Å for CCS40, and 47 Å for CCS60. These numbers are significantly larger than those calculated by the BJH model and confirm that BJH underestimates pore sizes. However, also the NLDFT method has its limitations. Pore blocking effects, as discussed above, are not considered in the models for long cylindrical channels and thus, the same limitations as for BJH are encountered. The desorption branch reflects the neck size and the adsorption branch the real pore width. Unfortunately, NLDFT kernels for the evaluation of adsorption branches are less abundant than those for desorption branches which are not reflected in equilibrium models. Thus, proper evaluation of the above shown data by the NLDFT method is difficult since model isotherms that reflect the adsorption branch are not available for carbon materials.
This shows another difficulty of the NLDFT method. It is applicable only to a given material with given pore shapes. This causes significant problems when materials for which no model isotherms exist are under investigation (polymers, metals, biomaterials, etc.). The materials of which the isotherms are shown in Fig. 40 consist of mesoporous silica (SBA-15) the pores of which are coated with amorphous carbon. Here a NLDFT kernel for carbon might be applied with certain validity. However, that could be very different for functionalized silica or carbon materials as well as for composite materials. In such cases no NLDFT model is valid and the results are rather meaningless. In such cases, one often reverts to the classical BJH method. The drawbacks of that method are known and the method can be used reproducibly in all laboratories worldwide.
Thus, using the NLDFT method is highly recommended if appropriate model isotherms are available with respect to adsorbent, adsorbate, and pore geometry.66 If this is not the case, NLDFT is as wrong as any other method and one should then revert to classical methods as long as no better alternatives exist.
4. Summary
Nanoparticles and nanoscopically ordered materials are fascinating and therefore under investigation in numerous laboratories worldwide. Their characterization, often appearing straightforward at first glance, bears several pitfalls. Standard data evaluation that would be completely correct for bulk materials easily results in a false picture of a given material. However, if one is aware of such pitfalls, awkward mistakes can be avoided and the data will withstand critical examination. As a general conclusion one should say that using complementary characterization methods provides most accurate pictures. Therefore, using combinations of methods that allow a comprehensive assessment of the properties of a given material is recommended rather than focussing on one specific method.Acknowledgements
The author is grateful to Dr Wolfgang Schmidt (MPI) for many helpful discussions, to Prof. An-Hui Lu (School of Chemical Engineering, Dalian University of Technology) and Prof. Chun Hua Yan (State Key Lab. of Rare Earth Materials Chemistry & Applications, Peking University) for providing samples. Mr Bernd Spliethoff (MPI Mülheim) and Mr Axel Dreier (MPI Mülheim) are gratefully acknowledged for TEM measurements.References
- P. Scherrer, Nachr. Ges. Wiss. Goettingen, Math.-Phys. Kl., 1918, 2, 96 Search PubMed.
- R. L. Snyder, J. Fiala and B. J. Bunge, Defect and Microstructure Analysis by Diffraction, Oxford, Oxford Univ. Press, 1999 Search PubMed.
- E. J. Mittemeijer and P. Scardi, Diffraction Analysis of the Microstructure of Materials, Springer-Verlag, Berlin, 2004 Search PubMed.
- W. H. Bragg, Nature, 1913, 90, 219 CAS.
- W. H. Bragg, Nature, 1913, 90, 360.
- W. H. Bragg and W. L. Bragg, Proc. R. Soc. A, 1913, 88, 428 CrossRef CAS.
- W. H. Bragg, Proc. R. Soc. A, 1913, 89, 246 CrossRef CAS.
- W. L. Bragg, Proc. R. Soc. A, 1913, 89, 248 CrossRef CAS.
- W. H. Bragg and W. L. Bragg, Proc. R. Soc. A, 1913, 89, 277 CrossRef.
- R. Jenkins and R. L. Snyder, Introduction to X-Ray Powder Diffractometry, ed. J. D. Winefordner, John Wiley & Sons, 1996 Search PubMed.
- U. Dehlinger, Z. Kristallogr., 1927, 65, 615 CAS.
- W. Boas, Z. Kristallogr., Kristallgeom., Kristallphys., Kristallchem., 1937, 97, 354 Search PubMed.
- A. R. Stokes and A. J. C. Wilson, Proc. Phys. Soc., London, 1944, 56, 174 CrossRef CAS.
- A. R. Stokes, Proc. Phys. Soc., London, 1948, 61, 382 CrossRef CAS.
- B. L. Averbach and B. E. Warren, J. Appl. Phys., 1949, 20, 885.
- B. L. Averbach and B. E. Warren, J. Appl. Phys., 1949, 20, 1066 CrossRef CAS.
- B. E. Warren and B. L. Averbach, J. Appl. Phys., 1950, 21, 595 CAS.
- B. E. Warren and B. L. Averbach, J. Appl. Phys., 1952, 23, 497.
- G. K. Williamson and W. H. Hall, Acta Metall., 1953, 1, 22 CrossRef CAS.
- J. I. Langford, J. Appl. Crystallogr., 1978, 11, 10 CrossRef.
- D. Balzar, J. Appl. Crystallogr., 1992, 25, 559 CrossRef CAS.
- J. I. Langford, D. Louer and P. Scardi, J. Appl. Crystallogr., 2000, 33, 964 CrossRef CAS.
- T. Ungar and A. Borbely, Appl. Phys. Lett., 1996, 69, 3173 CrossRef CAS.
- T. Ungar, J. Gubicza, G. Ribarik and A. Borbely, J. Appl. Crystallogr., 2001, 34, 298 CrossRef CAS.
- A. R. Stokes and A. J. C. Wilson, Math. Proc. Cambridge Philos. Soc., 1942, 38, 313 Search PubMed.
- W. L. Smith, J. Appl. Crystallogr., 1972, 5, 127 CrossRef CAS.
- D. Balzar, J. Appl. Crystallogr., 1992, 25, 559 CrossRef CAS.
- D. Balzar and H. Ledbetter, J. Appl. Crystallogr., 1993, 26, 97 CrossRef.
- H. M. Rietveld, Acta Crystallogr., 1967, 22, 151 CrossRef CAS.
- H. M. Rietveld, J. Appl. Crystallogr., 1969, 2, 65 CrossRef CAS.
- P. Scardi and M. Leoni, J. Appl. Crystallogr., 2006, 39, 24 CrossRef CAS.
- P. Scardi and M. Leoni, Acta Crystallogr., Sect. A: Found. Crystallogr., 2002, 58, 190 CrossRef CAS.
- P. Scardi, Z. Kristallogr., 2008, 27, 101.
- Y. P. Du, X. Sun, Y. W. Zhang, Z. G. Yan, L. D. Sun and C. H. Yan, Cryst. Growth Des., 2009, 9, 2013 CrossRef CAS.
- W. H. Hall and G. K. Williamson, Proc. Phys. Soc., London, Sect. B, 1951, 64, 937 CrossRef.
- S. Vives, E. Gaffet and C. Meunier, Mater. Sci. Eng., A, 2004, 366, 229 CrossRef.
- J. Rocha and M. W. Anderson, Eur. J. Inorg. Chem., 2000, 801 CrossRef CAS.
- R. Allmann and R. Clausthaler, Tektonische Hefte 29: Röntgenpulverdiffraktometrie, Sven von Loga Verlag, 1994 Search PubMed.
- P. Arnal, M. Comotti and F. Schüth, Angew. Chem., Int. Ed., 2006, 45, 8224 CrossRef CAS.
- N. S. Mclntyre and M. G. Cook, Anal. Chem., 1975, 47(13), 2208 CrossRef CAS.
- T. Choudhury, S. O. Saied, J. L. Sullivan and A. M. Abbot, J. Phys. D: Appl. Phys., 1989, 22, 1185 CrossRef CAS.
- F. Iacona, R. Kelly and G. Marletta, J. Vac. Sci. Technol., A, 1999, 17, 2271.
- J. E. Greene, R. E. Kinger, T. L. Barr and L. B. Welsh, Chem. Phys. Lett., 1979, 62, 46 CrossRef CAS.
- P. Ritterskamp, A. Kuklya, M. A. Wüstkamp, K. Kerpen, C. Weidenthaler and M. Demuth, Angew. Chem., Int. Ed., 2007, 46, 7770 CrossRef CAS.
- K. S. Sing, D. H. Everett, R. A. Haul, L. Mouscou, R. A. Pierotti, J. Rouquerol and T. Simieniewska, Pure Appl. Chem., 1985, 57, 603 CrossRef CAS.
- S. Brunauer, P. H. Emmett and E. Teller, J. Am. Chem. Soc., 1938, 309, 60.
- K. S. W. Sing, D. H. Everett, R. A. W. Haul, L. Moscou, R. A. Pierotti, J. Rouquerol and T. Siemieniewska, Pure Appl. Chem., 1985, 57, 603 CrossRef CAS.
- N. A. Seaton, J. R. B. Waltion and N. Quirke, Carbon, 1989, 27, 853 CrossRef CAS.
- C. M. Lastoskie, K. Gubbins and N. Quirke, J. Phys. Chem., 1993, 97, 4786 CrossRef CAS.
- J. P. Olivier, W. B. Conkin and M. Szombathely, in Characterization of Porous Solids III, ed. J. Rouquerol, F. Rodrigues-Reinoso, K. S. W. Singh and K. K. Unger, Elsevier, Amsterdam, 1994, pp. 81–80 Search PubMed.
- P. I. Ravikovitch and A. V. Neimark, J. Phys. Chem. B., 2001, 105, 6817 CrossRef CAS.
- A. V. Neimark, P. I. Ravikovitch, M. Grün, F. Schüth and K. K. Unger, J. Colloid Interface Sci., 1998, 207, 159 CrossRef CAS.
- F. Rouquerol, J. Rouquerol and K. Sing, Adsorption by Powders and Porous Solids, Academic Press, 1999, p. 174 Search PubMed.
- E. P. Barrett, L. G. Joyner and P. P. Halenda, J. Am. Chem. Soc., 1951, 73, 373 CrossRef.
- K. L. Murray, N. A. Seaton and M. A. Day, Langmuir, 1999, 15, 6728 CrossRef CAS.
- J. C. Groen, Microporous Mesoporous Mater., 2003, 60, 1 CrossRef CAS.
- M. Thommes, R. Köhn and M. Fröba, J. Phys. Chem. B, 2000, 104, 7932 CrossRef CAS.
- M. Thommes, B. Smarsly, M. Groenewolt, P. I. Ravikovitch and A. V. Neimark, Langmuir, 2006, 22, 756 CrossRef CAS.
- B. Libby and P. A. Monson, Langmuir, 2004, 20, 4289 CrossRef CAS.
- O. Sel, A. Brandt, D. Wallacher, M. Thommes and B. Smarsly, Langmuir, 2007, 23, 4724 CrossRef CAS.
- P. I. Ravikovitch and A. V. Neimark, Langmuir, 2002, 18, 9830 CrossRef CAS.
- M. Thommes, B. Smarsly, M. Groenewolt, P. I. Ravikovitch and A. V. Neimark, Langmuir, 2006, 22, 756 CrossRef CAS.
- P. I. Ravikovitch, S. C. Ó Domhnaill, A. V. Neimark, F. Schüth and K. K. Unger, Langmuir, 1995, 11, 4765 CrossRef CAS.
- P. I. Ravikovitch and A. V. Neimark, Colloids Surf., A, 2001, 187–188, 11 CrossRef CAS.
- P. I. Ravikovitch and A. V. Neimark, J. Phys. Chem. B, 2001, 105, 6817 CrossRef CAS.
- M. Thommes, Stud. Surf. Sci. Catal., 2007, 168, 495 CrossRef CAS.
| This journal is © The Royal Society of Chemistry 2011 |

