Nanosensors: towards morphological control of gas sensing activity. SnO2, In2O3, ZnO and WO3 case studies†
Aleksander
Gurlo
*
Technische Universitaet Darmstadt, Fachbereich Material- und Geowissenschaften, Petersenstr. 23, D-64287, Darmstadt, Germany
First published on 21st October 2010
Abstract
Anisotropy is a basic property of single crystals. Dissimilar facets/surfaces have different geometric and electronic structure that results in dissimilar functional properties. Several case studies unambiguously demonstrated that the gas sensing activity of metal oxides is determined by the nature of surfaces exposed to ambient gas. Accordingly, a control over crystal morphology, i.e. over the angular relationships, size and shape of faces in a crystal, is required for the development of better sensors with increased selectivity and sensitivity in the chemical determination of gases. The first step toward this nanomorphological control of the gas sensing properties is the design and synthesis of well-defined nanocrystals which are uniform in size, shape and surface structure. These materials possess the planes of the symmetrical set {hkl} and must therefore behave identically in chemical reactions and adsorption processes. Because of these characteristics, the form-controlled nanocrystals are ideal candidates for fundamental studies of mechanisms of gas sensing which should involve (i) gas sensing measurements on specific surfaces, (ii) their atomistic/quantum chemical modelling and (ii) spectroscopic information obtained on same surfaces under operation conditions of sensors.
 Aleksander Gurlo | Aleksander Gurlo obtained his PhD in chemistry from the Belarusian State University (Minsk, Belarus) in 1998. In 2010 he finished his habilitation in materials science at the Technische Universitaet Darmstadt (Germany). Currently he is a Feodor-Lynen-Fellow at the School of Engineering and Applied Sciences at the Harvard University (Cambridge, USA). His current research interest is focused on the synthesis and characterisation of nanoscaled metal oxides. |
Nanosensor technology
A major goal in current research and development efforts in nanoscience and nanotechnology is to fabricate functional devices by integrating bottom-up chemical assembly schemes with conventional top-down microelectronic technologies.1 Chemical sensors in general and gas sensors in particular can be taken as an example of such nanotechnological developments. In sensors the chemical functionality (i.e. recognition or sensing capabilities) is interfaced with electrical transducer schemes forming a complex nano-/microelectronic device. The research in the field of gas sensors has grown rapidly in the last years; this has been indicated by continuously increasing number of publications devoted to different aspects of the research in this field. Gas sensors are also increasingly penetrating mass-market applications, which include automotive applications (cabin air quality control), health care (diagnostic of diseases via breath analysis), home alliances (cooking control) as well as more traditional fields such as toxic- and explosive- gas alarms.A continuing need in the development of better sensors which are expected to be cheaper, faster, more sensitive, selective and stable compared with the conventional, state-of-the-art, devices, drives new developments in the gas sensing field towards “nanosensors”.2,3 Such downsizing of sensing elements not only makes them cheaper and more economical but also improves the sensor performance opening therefore great technological perspectives.
Among different sensor types, conductometric gas sensors or chemiresistors is one of the most investigated group of sensors. They inform about the composition of their ambient atmosphere through the changes in the conductivity of sensing materials which usually are semiconducting metal oxides such as SnO2, ZnO, WO3, and In2O3. Accordingly, the recent progress in the development of chemiresistors can be taken as an instructive example of the fabrication of nanosensors.
A conductometric nanosensors or nano-chemiresistor is not required to be nanoscale in dimensions to take advantage of the unique properties of nanomaterials.4 Accordingly, a nano-chemiresistor can consist of (i) an individual quasi one dimensional nanolelement,5 i. e. nanowire, nanobelt (Figure 1 A) or (ii) many individual shape- and size-controlled nanoelements which are either 0D-nanoparticles or Q-1D crystals, assembled in a specific way (Figure 1 B).6,7 The obvious advantages of such many-nanoelement-sensors are their easier processability and large scale integration if compared to those of sensors based on individual Q-1D elements.
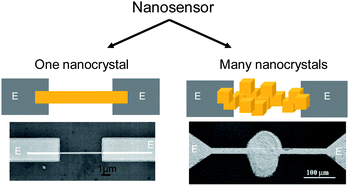 | ||
| Fig. 1 Two approaches in the development of nano-chemiresistors: (on the left) a receptor is an individual nanoelement and (on the right) a receptor consist of many individual shape- and size-controlled nanoelements, i.e.nanoparticles with identical form, assembled in a specific way. E: metal electrodes. (Left bottom) Copyright the American Institute of Physics, reproduced from ref. 8 with permission. (Right bottom) Copyright Elsevier, reproduced from ref. 9 with permission. | ||
This review is organized as follows. The next section briefly describes reception and transduction processes occuring in chemiresistors. After that the possible influence of size and morphology of crystals on their sensing performance is reviewed. Afterwards the effect of crystal morphology for four typical gas sensing materials, i.e.SnO2, In2O3, ZnO and WO3 is described and discussed in detail. And finally, conclusions and outlook are given. Finally, we outline several actions required to achieve morphological control of gas sensing activity in nanocrystals.
Reception and transduction in nano-chemiresistors
The overall response in chemiresistors is a complex phenomenon which is determined by at least three factors, i.e. (i) the surface reactions/adsorption processes, (ii) the resulting charge transfer processes with the underlying semiconducting material, and (iii) the mechanism of transport of charge carriers within the sensing layer and in contact with the underlying electrodes. Accordingly, deep insight into all three elementary steps is required for fundamental understanding of mechanisms of the gas sensing activity of metal oxides.10 What are the requirements for achieving this understanding?For the atomistic understanding of surface reactions of metal oxides the spectroscopic information should be correlated with (i) surface structure and reactivity from quantum-chemical calculations done for a given gas environment at finite temperature and pressure and with (ii) sensing activity obtained specifically on same surfaces. Obviously, such measurements must be performed on a material with the planes of the symmetrical set {hkl}; as the latter are equivalent by symmetry also requires that they be equivalent in every chemical and physical way. In other words they must therefore behave identically in chemical reactions and adsorption processes. Accordingly, for the fundamental studies of gas reception there is a need in materials that (i) have well-defined morphology with only type of surfaces exposed to ambient gas, (ii) preserve same morphology over different length scales, (iii) have large surface area and (iv) possess excellent gas sensing activity. Spectroscopic techniques may either be applied under in-situ real operation conditions of the sensors on well-defined nanocrystals or under ideal conditions far away from the real practical world (such as the ultra high vacuum conditions and/or at low temperatures) on clean well-defined surfaces (Figure 2 A). The drawback of the latter is that the extrapolation of the data from ideal to real conditions is not always straightforward.
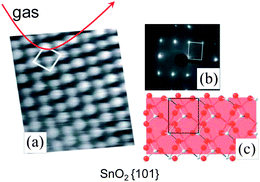 | ||
| Fig. 2 Surface science approach to study the reception mechanism in nano-chemiresistors performed on well-defined clean surfaces under “model” high-vacuum conditions. Copyright Elsevier, reproduced from ref. 11 with permission. | ||
Transduction mechanism - which translates the surface chemistry into the measurable electrical signal - strongly depends on the morphology of the sensitive layer as well as the contribution of interfaces between metal oxide particles and underlying metal electrodes and those between oxide particles in polycrystalline materials. The individual single-crystalline Q-1D receptors are the best choice for studying the role of the transduction/conduction mechanism in the sensor operation (Figure 3). However, the Q-1D receptors of the majority of gas sensing materials have dissimilar facets exposed to ambient gas, and they are not suitable for deep-insight into the mechanism of interaction of molecules with oxide surfaces.
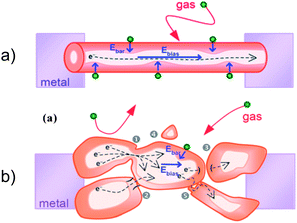 | ||
| Fig. 3 Transduction/conduction mechanism in nano-chemiresistors: (on the top) in the individual single-crystalline Q1D receptors and (on the bottom) in polycrystalline materials where the contribution from intergranular barriers should be considered. Copyright the Royal Chemical Society, reproduced from ref. 12 with permission. | ||
Interplay of size and shape of crystals
The chemical reactivity of nanomaterials is mainly determined by the so-called “smoothly scalable” size-dependent properties which are related to the fraction of atoms at the surface.13 As the particle size decreases, the surface-to-volume ratio increases proportionally to the inverse particle size. The increase in the total surface-to-volume ratio related to the size decrease generates more “reactivity” due to a dominant surface-like behaviour caused by an increased fraction of atoms at the surface13 Thus, all properties which depend on the surface-to-volume ratio change continuously and extrapolate rapidly at very slow particle sizes. As a consequence, nanoparticles with increased surface-to-volume ratio are expected to be more reactive and accordingly, more gas sensitive. Indeed, the increase in sensor response with decreasing particle size has been verified both experimentally and theoretically for many sensing materials, among them for In2O3 and SnO2 (Figure 4).14–18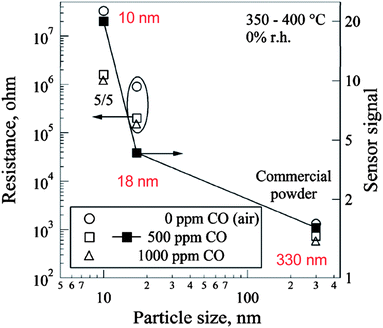 | ||
| Fig. 4 Increase in sensor signal with decreasing particle size observed for SnO2-based gas sensors. Resistance (left axis, open symbols) and sensor signal (right axis, filled squares). Copyright Elsevier, reproduced with permission from ref. 16. | ||
The question arises to what extent the enhanced gas sensing activity of nanoscaled metal oxides is a mere result of the total increase in the surface-to-volume ratio and is the result that appears due to size-specific effects. The latter could be due to the appearance of crystalline planes/surfaces which are not available in bulk materials. In nanosystems, the stability of surfaces could be reversed and high-energy surfaces – which are metastable in bulk form – become stable as the particle size decreases or surface chemistry changes (Figure 5).19 Quite surprisingly, these “nanomorphological” effects have not yet received particular attention in fundamental studies of gas sensing on metal oxides. A recent review 20 only highlighted a few issues of interest.
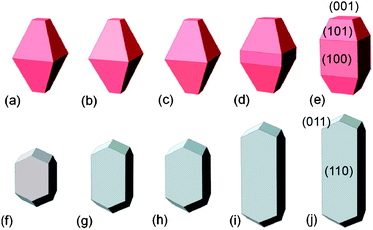 | ||
| Fig. 5 Crystal morphology predicted for anatase (top) with (a) hydrogenated surfaces (b) with hydrogen-rich surface adsorbates, (c) hydrated surfaces, (d) hydrogen-poor adsorbates, and (e) oxygenated surfaces, and rutile (bottom) with (f) hydrogenated surfaces, (g) with hydrogen-rich surface adsorbates, (h) hydrated surfaces, (i) hydrogen-poor adsorbates, and (j) oxygenated surfaces. Copyright the American Chemical Society, reproduced from ref. 26 with permission. | ||
As SnO2, In2O3, ZnO and WO3 and the most studied gas sensing materials (see, for example, ref. 21–23 and references therein) and among them SnO2 is the prototype material in the commercial gas sensors and a model material in fundamental studies,11,24,25 let us examine these materials in more detail. A special attention is paid on the availability of well defined shapes enclosed with set of symmetrical {hkl} planes as well as on the relationship between crystal morphology, surface structure and gas-sensing properties.
SnO2: evidence of crystal shape effect
Under ambient pressure conditions, tetragonal tin dioxide (SnO2, cassiterite) crystallizes in rutile-type structure (space groupP42mnm, Nr. 136, a = 4.734 Å, c = 3.185 Å, Z = 2). The forms of crystals of the tetragonal system are referred to three crystallographic axes that make right angles with each other. The two horizontal axes, a, are equal in length and interchangeable, but the vertical axis, c, is of different lengths. Accordingly, several crystal forms are of particular interest for nanomorphological control of gas sensing activity:- tetragonal prisms (Figure 6 A) for Q-1D crystals with side facets which are equivalent in symmetry and face (basal) facets which have to be masked (indicated with arrows; we will come back to this issue later) and
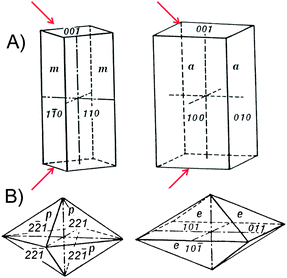 | ||
| Fig. 6 (A) Tetragonal prisms consisting of four rectangular vertical facets, from left to right: prism of first order {110} and that of second order {010}. (B) Tetragonal dipyramids with eight isosceles triangular facets, from left to right: dipyramid of first order {hh1} and that of second order {0kl}. Arrows indicate the face (basal) facets which have to be masked. | ||
- tetragonal dipyramids (Figure 6 B) for regular shaped particles being equivalent in size- and shape.
Has this morphology been already realized in synthesized SnO2 materials? The macroscopic single SnO2 crystals have complex shapes enclosed by {110}, {101} and {100} faces which give SnO2 crystals their characteristic habit (Figure 7 A). Typical SnO2 materials - applied for gas sensing studies - consist of particles either of ill-defined morphology or with a set of non-symmetrical {hkl} facets. The Q-1D systems, i.e. nanobelts and nanoribbons, consist of crystals having non-equivalent {10-1}/{010} or {101}/{100} side surfaces.27–29
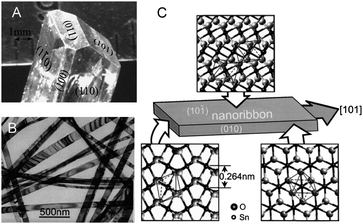 | ||
| Fig. 7 Morphology/habit of (A) a typical macroscopic SnO2 crystal (at the top) and (B, C) a typical SnO2 nanobelt. Copyright Elsevier, reproduced from ref. 11 (A) and ref. 30 (B, C) with permission. | ||
This seeming discrepancy between expected crystal forms and those experimentally realized is ultimately due to the energetic stabilization of individual surfaces in SnO2. The {110} surfaces have been considered to be the most stable independent on oxygen potential, temperature and size of the crystals. This is not correct since (i) the {110} surfaces almost do not appear in as-synthesised materials (see above), and (ii) the stability of surfaces in SnO2 depends strongly on the oxygen concentration and the size of the particles. Hence, according to calculations, the reduced {100} and {101} surfaces - obtained by removing twofold coordinated bridging oxygen rows from the stoichiometric surfaces - are thermodynamically favored for low oxygen chemical potential (Figure 8); the reduced {110} surface exhibits a high surface energy and thus is unlikely to exist in realistic conditions. 11,31
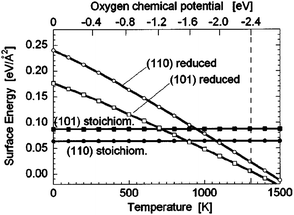 | ||
| Fig. 8 Stability of several SnO2 surfaces in dependence on temperature and oxygen chemical potential. Copyright the American Institute of Physics, reproduced from ref. 31 with permission. | ||
As in the majority of gas sensing studies was performed on materials consisting of non-equivalent surfaces, an unambiguous experimental proof of the influence of the crystal shape, i.e. geometrical and electronic structure of surfaces, on gas sensing properties of SnO2 materials was missing so far. The recent study by Han et al.32 has provided first experimental evidence of the morphology influence on sensing activity of SnO2 nanocrystals. Due to the significant methodological importance of this work, let us examine it in more detail (see also ref. 33). Han et al.32 succeeded in synthesizing shape-controlled SnO2 crystals with different ratios of {221} and {110} surfaces (Figure 9). As described above, the {221} morphology is a uniform tetragonal dipyramid (Figure 6 B).
![(A) A low-magnification TEM image of a {221} SnO2 particle viewed along the [-110] direction; inset: the corresponding SAED pattern. (B) Schematic model of an ideal {221} SnO2 octahedron, projected along the [-110] direction. (C) HRTEM image taken from the top apex of the octahedron. (D) The (221) surface can be thought of as a combination of (111) terraces and (110) steps. Copyright Wiley-VCH, reproduced from ref. 32 with permission.](/image/article/2011/NR/c0nr00560f/c0nr00560f-f9.gif) | ||
| Fig. 9 (A) A low-magnification TEM image of a {221} SnO2 particle viewed along the [-110] direction; inset: the corresponding SAED pattern. (B) Schematic model of an ideal {221} SnO2 octahedron, projected along the [-110] direction. (C) HRTEM image taken from the top apex of the octahedron. (D) The (221) surface can be thought of as a combination of (111) terraces and (110) steps. Copyright Wiley-VCH, reproduced from ref. 32 with permission. | ||
The main observation is that the shape of SnO2 crystals, i. e. different ratio of {221} and {110} facets exposed to ambient gas, strongly influences the sensor response of SnO2 crystals to ethanol (Figure 10). This conclusion is of significant methodological importance for future research and development in the field of gas sensing.
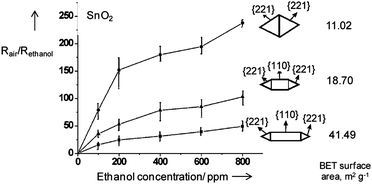 | ||
| Fig. 10 Response to ethanol of SnO2 particles in dependence of crystal morphology, i.e. nature of surface exposed to ambient gas. Copyright Wiley-VCH, reproduced from ref. 32 with permission. | ||
The difference in sensing activity in differently shaped SnO2 crystals is not caused by the difference in their surface area, i.e. difference in their particle size but is merely due to the nature of surfaces exposed to ambient gas. A possible explanation for higher sensing activity of {221} crystals can be the enhanced energy of these surfaces accompanied by their high reactivity (Table 1).
As the interaction with oxygen is a key element which determines sensor response in air,25 the unsatisfied charges associated with oxygen ions at the surface could be responsible for the high reactivity observed in the detection of reducing gases such as ethanol or CO. On the other hand, ethanol belongs to the large classes of molecules, which adsorption on oxide surfaces follows acid-base behaviour. As a relatively large part of the SnO2 {221} surfaces consists of unsaturated cations (Figure 11), i.e. five and four-fold coordinated Sn ions, which could serve as the surface sites for gases to be detected, this also could be a reason for enhanced sensing activity of {221} surfaces. However, more experimental studies are needed to verify these suggestions.
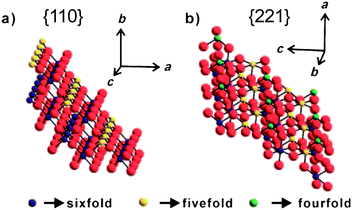 | ||
| Fig. 11 Schematic models of a) the {110} and b) the {221} SnO2 surfaces with indication of the coordination of Sn ions. Copyright Wiley-VCH, reproduced from ref. 32 with permission. | ||
Unfortunately, a gap between theory and experiment do not allow for deep insight into shape influence on the operation of SnO2 based gas sensors. Clean well-defined SnO2 surfaces have been grown by variety of techniques; the final orientation/termination of the films was controlled by growth conditions or substrates used for the epitaxial growth allowing for different surface orientations. The majority of experiments have been performed on {110} surfaces; the studies of {101} surfaces have been limited to benzene and water adsorption. The existing DFT calculations of the oxygen, water, hydrocarbons, benzene and NO2 interaction are limited to {110}, {100} and {101} surfaces28,35–38,39 (see e.g. overview in11), those for {111} and {221} do not exist.
Control of size and shape in well-defined In2O3 nanocrystals
In2O3 possesses excellent and well-studied low-temperature gas sensing properties and can be synthesized in different well-controlled morphologies and crystal sizes. Let us consider more closely the structure of two most important In2O3 polymorphs. A cubic bixbyite-type c-In2O3 (C-type structure of rare-earth oxides, space groupIa![[3 with combining macron]](https://www.rsc.org/images/entities/char_0033_0304.gif) , No. 206, a = 10.116 Å, Z = 16) is thermodynamically stable under ambient pressure conditions, and, accordingly represents the most known and the most studied In2O3 polymorph. The corundum-type rh-In2O3 (rh-In2O3, space groupR
, No. 206, a = 10.116 Å, Z = 16) is thermodynamically stable under ambient pressure conditions, and, accordingly represents the most known and the most studied In2O3 polymorph. The corundum-type rh-In2O3 (rh-In2O3, space groupR![[3 with combining macron]](https://www.rsc.org/images/entities/char_0033_0304.gif) c, No. 167, a = 5.491 Å, c= 14.526 Å, Z = 6) is metastable under ambient pressure conditions; it can be stabilized (i) in quasi one-dimensional nanostructures, (iii) in the sol-gel synthesised In2O3 and in (iii) Sn4+/Fe3+/N3−−doped In2O3 (see overview in40,41). In both polymorphs the indium-oxygen polyhedra are of the same type, octahedral, and have similar sizes; oxygen in all structures is in nearly tetrahedral coordination.42
c, No. 167, a = 5.491 Å, c= 14.526 Å, Z = 6) is metastable under ambient pressure conditions; it can be stabilized (i) in quasi one-dimensional nanostructures, (iii) in the sol-gel synthesised In2O3 and in (iii) Sn4+/Fe3+/N3−−doped In2O3 (see overview in40,41). In both polymorphs the indium-oxygen polyhedra are of the same type, octahedral, and have similar sizes; oxygen in all structures is in nearly tetrahedral coordination.42
The crystal forms of the isometric (cubic) system are referred to three axes of equal length that make right angles with each other. The simplest crystals forms are: cube or hexahedron {100}, octahedron {111}, dodecahedron {011} (Figure 12 A). The forms of the trigonal system (rhombohedral crystals) are referred to four crystallographic axes. Three of these, designed a1, a2, and a3, lie in the horizontal plane and are of equal length with angles of 120° between the positive ends; the fourth axis, c, is vertical that make right angles with former. The form of interest is a rhombohedron {h0-hl}/{0h-hl} (Bravais-Miller notation) or {h0l}/{0hl} (Miller notation) which can be thought of as a cube deformed in the direction of its body diagonal (Figure 12 B). The deformation may appear either as an elongation along the diagonal producing an acute solid angle, or compression along the diagonal producing an obtuse solid angle.
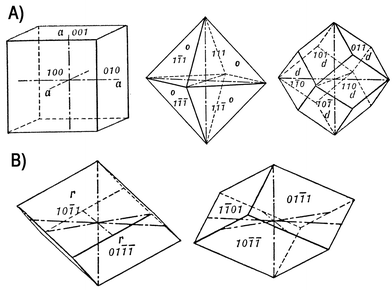 | ||
| Fig. 12 (A) Isometric system, from left to right: cube or hexahedron {100}, octahedron {111}, dodecahedron {011}. (B) Trigonal system: a rhombohedron {10-1l} and {01-1l}. | ||
The c-In2O3 and rh-In2O3 polymorphs have several important advantages, as they allow for:
- studies of surface effects: c-In2O3 {100} cubes and {111} octahedra and morphologies with different ratios of {100} and {111} facets allow for atomistic understanding of the role of surface structure in gas sensing activity (Figure 13)
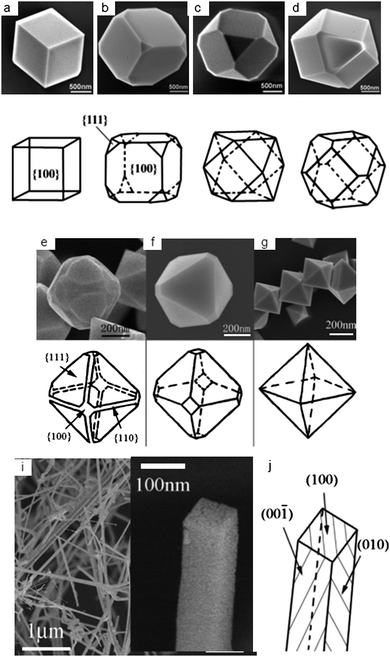 | ||
| Fig. 13 (a-g) SEM images of the c-In2O3 crystals with corresponding schematic habits showing (i) a transition from {100} to {111} morphology (a-g) and (ii) {100} nanobelts. Copyright the American Chemical Society, reproduced from ref. 44 with permission. | ||
- studies of size effects: c-In2O3 {100} cubes and {111} octahedra of rh-In2O3 {012} rhombohedra could be stabilised over several length scales allowing for the fundamental studies of size effects on gas sensing properties (Figure 14)
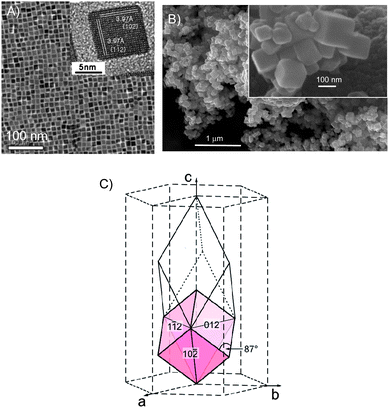 | ||
| Fig. 14 Control over {012} morphology of corundum-type rh-In2O3 over several lengths scales (A and B). (C) The orientation of the {012} nanorhombohedra with respect to the unit cell. The slim rhombohedron represents the primitive setting of the R-centered cell. Copyright the American Chemical Society, reproduced from ref. 45 (A) and ref. 46 (B, C) with permission. | ||
Recently, the evolution of the conduction band edge with the electron concentration and temperature in different gas atmospheres was demonstrated for shape-controlled {012} rh-In2O3 nanorhombohedra.43 With decreasing size of rhombohedral rh-In2O3 particles the transition from partly to completely depleted particle was observed, depending on the ratio between particle size and Debye screening length (LD). For partly depleted particles, when surface reactions do not influence the conduction in the entire layer, the conduction process takes place in the bulk region. Formally, two resistances occur in parallel, one influenced by surface reactions and the other not; the conduction is parallel to the surface, and this explains the limited sensitivity. For fully depleted particles – either for small or in the absence of reducing gases, there is no difference any more between bulk and surface; that expected to result in higher sensitivity and better performance.
Care should be taken, while discussing the gas-sensing activity of well-defined clean In2O3 surfaces epitaxially grown on YSZ (100, 111)47 and c-plane sapphire (α-Al2O3).48 A drawback of such films is the growth of side facets with dissimilar structures as it was demonstrated for c-In2O3 (Figure 15).
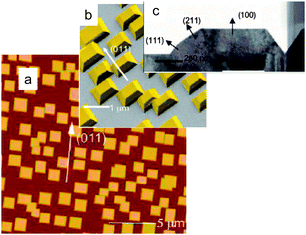 | ||
| Fig. 15 (a) AFM (20 µm × 20 µm) image of the of In2O3 islands on Y-stabilized ZrO2. (b) Secondary electron SEM image of In2O3 islands enhanced in false color. (c) Cross sectional HRTEM image of an individual island. Copyright the American Chemical Society, reproduced from ref. 49 with permission. | ||
As in the SnO2 case, a gap between theory and experiment do not allow for deep insight into In2O3 based gas sensors. To the best of our knowledge, only two quantum chemical calculations have been performed so far to explain the effects induced by gaseous environment on c-In2O3.50,51 Two other DFT calculations focuses on the surface structure of {100} and {111} Sn-doped c-In2O3 surfaces (Figure 16).52,53 The DFT calculations of the surface structure and reactivity of rh-In2O3 do not exist.
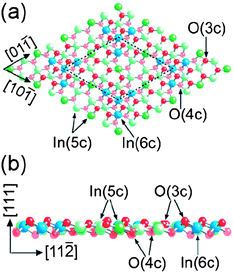 | ||
| Fig. 16 Ball-stick model of In2O3 (111) surface (1 × 1) terminated. Arrows mark In and O atoms with their corresponding coordination: (a) top view where the unit cell is marked with a broken line and (b) side view. Copyright the Institute of Physics, reproduced from the ref. 52 with permission. | ||
An important conclusion from the DFT calculations of In2O3 surface structure is a possible explanation of an enhanced sensing activity of c-In2O3 (and rh-In2O3) towards ozone if compared to that of SnO2. As shown recently, SnO2 does not favour the stabilisation of any adsorbed oxygen species under realistic operation conditions (Figure 17).25
 | ||
| Fig. 17 Schematic representation of oxygen interaction with SnO2 which indicates that SnO2 does not favour the stabilisation of any adsorbed oxygen species under realistic operation conditions of sensors (for details, see ref. 25) | ||
In opposite, at {100} surfaces of c-In2O3 the surface oxygen atoms are reconstructed in such a way that their associates could be described as surface peroxide species (O22−). At oxygen-deficient surfaces, the unsaturated In ions (In5c) could serve as the surface sites for oxygen and ozone. As decomposition of ozone molecule is expected to be mediated through a formation of an oxygen pair (i.e.peroxide-like species), this could explain an enhanced sensing activity of c-In2O3 (and rh-In2O3) towards ozone. The indium-terminated {100} surfaces require virtually no activation energy for oxygen to be chemisorbed to form surface dimers.51
ZnO: uniformly shaped columns and pyramids
Under ambient pressure conditions, hexagonal zinc oxide (ZnO) crystallizes in wurtzite-type structure (space groupP63mc, Nr. 186, a = 3.2490 Å, c = 5.2052 Å, Z = 2). The crystal forms of the hexagonal system are referred to four crystallographic axes. Three of these, designed a1, a2, and a3, lie in the horizontal plane and are of equal length with angles of 120° between the positive ends; the fourth axis, c, is vertical that make right angles with former. Several crystal forms are of particular interest for nanomorphological control of gas sensing activity:- hexagonal prisms (Figure 18 A) for Q-1D crystals with side facets which are equivalent in symmetry and face facets which have to be masked (indicated with arrows) and
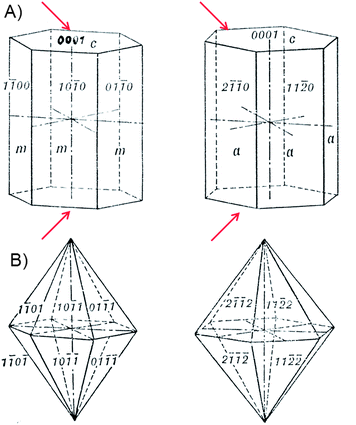 | ||
| Fig. 18 (A) Hexagonal prisms consisting of six vertical faces, each of which intersects two of the horizontal crystallographic axes equally and is parallel to the third; from left to right: prism of first order {10-10} and that of second order {11-20}. (B) Hexagonal dipyramids with 12 isosceles triangular facets, from left to right: dipyramid of first order {h0-hl} and that of second order {hh-2hl}. | ||
- hexagonal dipyramids (Figure 18 B) for regular shaped particles being equivalent in size- and shape.
Quite surprisingly, the as-synthesized ZnO (nano)crystals possess morphology which deviates very slightly from the ideal one (Figure 19). The ZnO crystals could be synthesized as (i) hexagonal columns having equivalent either {10-10} or {11-20} side and {0001} base surfaces and as (ii) pyramids enclosed by {10-10} as side and {0001} as base surfaces.
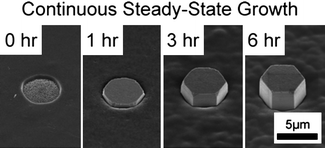 | ||
| Fig. 19 SEM images of ZnO hexagonal prisms {00-10} grown continuously in a hydrothermal reactor. Copyright the American Chemical Society, reproduced from ref. 54 with permission. | ||
The availability of well-controlled ZnO nanocrystals as well as a number of theoretical DFT calculations provides a suitable opportunity to correlate the gas-sensing activity with atomistic modelling. Thus, the recent study provided an experimental evidence of the morphology influence, i.e. nature of surface exposed to gas atmosphere, on sensing activity of ZnO crystals (Figure 20). 55 As found, the {0001} surfaces possess high sensing activity to ethanol if compared to that of {10-10} and {10-11} surfaces.
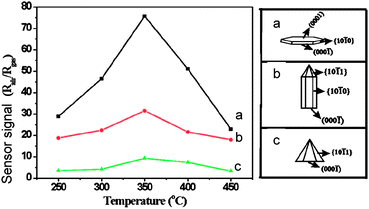 | ||
| Fig. 20 Response to ethanol of ZnO particles in dependence of crystal morphology shown in the right panel (a-c). Copyright the American Chemical Society, reproduced from ref. 55with permission. | ||
A number of theoretical DFT calculations have been performed to model the structure as well as reactivity of {00-10} 56–60 and {0001} 61ZnO surfaces. The nonpolar {00-10} surfaces consist of a large number of dangling bonds and Zn–O surface dimmers which make them highly reactive for NO2 and oxygen adsorption (Figure 21). The reactivity of polar {0001} surfaces – which are either Zn-terminated or O-terminated, depends on their termination. Similar to SnO2 and In2O3 cases, the lack of theoretical works on ethanol interaction with ZnO surfaces under realistic conditions does not allow for correlating the sensing activity with surface structure of ZnO.
![Atomic stacking model of wurtzite ZnO projected along [1–210] direction, showing ((0001), {10-10}, and {10-11} planes. Copyright the American Chemical Society, reproduced from ref. 55 with permission.](/image/article/2011/NR/c0nr00560f/c0nr00560f-f21.gif) | ||
| Fig. 21 Atomic stacking model of wurtzite ZnO projected along [1–210] direction, showing ((0001), {10-10}, and {10-11} planes. Copyright the American Chemical Society, reproduced from ref. 55 with permission. | ||
Cubic-WO3nanowire networks
Despite numerous studies of the gas sensing properties of WO3-based materials, a common understanding of the influence of structure and moprhology of the WO3 crystals on their gas sensing properties is still missing. This is mainly due to three reasons.Firstly, WO3 is a difficult material for fundamental studies because of its polymorphism and the variety of possible phase transitions (Figure 22). All WO3 polymorphs can be described as having cubic ReO3-type structure with different degree of structural distortion which is due to either (i) rotation (tilting) of rigid [WO6] octahedra or (ii) displacement of the W ion from the center of octahedron.62 This extremely small structural difference leads to the difficulties in ascertaining the specific phase composition, especially for nanocrystalline materials.
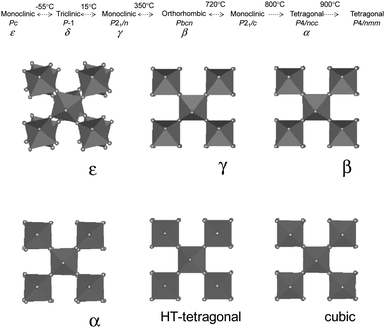 | ||
| Fig. 22 (Top) Possible phase transitions in WO3. 69,70,71 A cubic- (space group (Pm-3m) and hexagonal WO3 are metastable polymorphs. A transition to the ReO3 (Pm-3m) might be expected to occur at higher temperatures.71 (Bottom) Polyhedral tilts in WO3 showing extremely small distortions between different polymorphs. Copyright the American Physical Society, reproduced from ref. 62 with permission. | ||
Secondly, the phase transitions in WO3 occur at operating temperatures of sensors and in turn depend on particle size.63,64 Consequently, a discontinuity in surface reactivity, conductivity and functional properties can appear as a function of the temperature and ambient atmosphere. Moreover, the ability of WO3 to form Magneli phases or oxygen deficient structures WnO3n-2 at sensor operating temperatures brings additional complications.65 Furthermore, phase transitions in WO3 can be induced by charge doping and accumulation of additional charge (electrons) on W atoms (so-called doping induced phase transitions).62
Thirdly, specifically for Q-1D WO3 nanostructures, a decomposition of single crystalline nanowires to polycrystalline structures occurs during the heating 66,67 due to Rayleigh instability 68; this lead to the destruction of the Q-1D structures.
Accordingly, even same specimens are different - in terms of morphology and phase composition – at different operating temperatures.
Despite all these difficulties, there is one specific case of interest which appears for the cubic ReO3-type WO3 polymorph which can be synthesized as a three-dimensional nanowire network. 72 The ordered in-plane oxygen vacancies in the {100} planes facilitate the growth of the nanowires along six equivalent <100> directions; this leads to an intersectant 3D network structure (Figure 23).
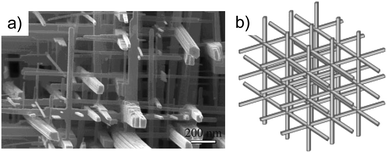 | ||
| Fig. 23 (A) High-magnification SEM images and (B) a schematic of the tungsten oxide nanowire networks formed by {100} crystals. Copyright Wiley-VCH, reproduced from ref. 72 with permission. | ||
The relationship between the crystal symmetry, oxygen vacancy formation energy and gas sensing properties is not yet understood. Obviously, a different reactivity is expected for different WO3 polymorphs with dissimilar surface and electronic structures. The band gap in WO3 polymorphs increases with increasing distortion of the octahedral structure,73 however, the formation energies of oxygen vacancies remain quite similar for different polymorphs.74,75 Depending on the concentration of oxygen vacancies, additional electrons produced in this way, can be localised (small polarons), delocalised on few (large polarons) or infinite (conductive electrons) number of tungsten ions.75 Consequently, the relationship between the gas sensing properties and oxygen deficiency has to be expected. As the sensing properties of the WO3 are mainly determined by the (sub-) surface oxygen vacancies76 or (sub)-surface W5+ cations (Figure 24),77 the oxygen deficient, morphology-controlled, cubic WO3-d networks possess excellent gas-sensing activity.78
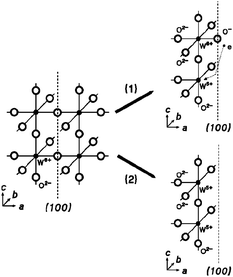 | ||
| Fig. 24 Structural model of the defect creation in WO3. On the left: c-WO3 structure with {100} facets; on the right: two possible surface structures with W5+ ions which is required for neutrality conditions. Copyright the American Institute of Physics, reproduced from ref. 79 with permission. | ||
However, there have been a lot of unclarified issues such as: Is there any relationship between catalytic properties (which mainly due to the W![[double bond, length as m-dash]](https://www.rsc.org/images/entities/char_e001.gif) O bonds) and gas sensing (oxygen deficiency)? How important is for WO3 its ability to incorporate oxygen deficiency and to stabilise W4+/W6+, W5+/W6+ and W5+/W5+ pairs? How does this ability influence its gas sensing properties? Is there any relationship between formation of polarons (small and large) and gas sensing activity? As the DFT calculations (focusing on oxygen adsorption) have been performed only for a monoclinic polymorph,80 a detailed theoretical study on realistic, oxygen-deficient, WO3 structures is required.
O bonds) and gas sensing (oxygen deficiency)? How important is for WO3 its ability to incorporate oxygen deficiency and to stabilise W4+/W6+, W5+/W6+ and W5+/W5+ pairs? How does this ability influence its gas sensing properties? Is there any relationship between formation of polarons (small and large) and gas sensing activity? As the DFT calculations (focusing on oxygen adsorption) have been performed only for a monoclinic polymorph,80 a detailed theoretical study on realistic, oxygen-deficient, WO3 structures is required.
Conclusions and outlook
Anisotropy is a basic property of single crystals. Dissimilar facets/surfaces have different geometric and electronic structure that results in dissimilar functional properties. Also the gas sensing activity of metal oxides is determined by the nature of surfaces exposed to ambient gas as demonstrated recently for SnO2, In2O3, ZnO and WO3. Crystals of well defined shapes enclosed with set of symmetrical {hkl} planes allow for understanding of relationship between crystal morphology, surface structure and gas-sensing properties. As the planes of the symmetrical set {hkl} are equivalent by symmetry also requires that they must therefore behave identically in chemical reactions and adsorption processes. Accordingly, materials that (i) have well-defined morphology with only type of surfaces exposed to ambient gas, (ii) preserve same morphology over different length scales, (iii) have large surface area and (iv) possess excellent gas sensing activity are required for deep insight into gas sensor operation.Morphological control of gas-sensing properties
The first step toward the morphological control of gas-sensing activity of nanomaterials is the design and synthesis of well-defined nanocrystals which are uniform in size, shape and surface structure. Because of these characteristics, they are not only ideal models for fundamental studies of mechanisms of gas sensing, but possess also infinite potentialities as the most ideal particulate materials for nanosensors:- the nanosensing receptors containing hundreds or even thousands of well-defined nanocrystals possess much larger surface-to-volume ratio if compared to single crystals of one-dimensional materials (Figure 25)
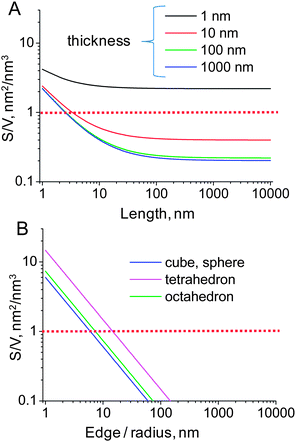 | ||
| Fig. 25 Surface-to-volume ratio for one-dimensional nanobelts with fixed width of 10 nm (A) and that for several regular shaped particles (B). | ||
- they allow for application and integration of available operando spectroscopic tools in its combination with electrical characterization enabling in this way for real-time time-resolved assessment of a sensing event by addressing simultaneously the mechanism, performance and activity of sensors. As a results, the physicochemical processes that occur on an active sensing element can to be monitored in real time and under realistic conditions, meaning realistic temperature, pressure and composition of gaseous ambient
- a combination of DFT and ab initio calculations with thermodynamic models can be used to simulate the adsorption of molecules to surfaces under working conditions, thus allowing a direct comparison with experimental spectroscopic data obtained in situ.
Aligned Q-1D nanocrystals: an ideal sensor geometry?
The individual single-crystalline Q-1D crystals having well-defined geometry and large surface-to-volume ratio provide a unique opportunity for studying the role of the transduction mechanism in the sensor operation. The question arises under which conditions they can also be used for reception studies? As described above, for such investigations a set of equivalent {hkl} planes is required. Accordingly, the Q-1D nanocrystals can be used for simultaneous receptor/transducer studies after fulfilling the following requirements:- they must possess side facets which are equivalent in symmetry and chemical composition
- they must be aligned in the way that their base facets are ground to contact electrodes (masked).
Let us consider individual SnO2, In2O3 and ZnO Q-1D crystals, i.e. nanobelts and nanoribbons. Individual single crystalline SnO2 nanowires/nanobelts being faceted by dissimilar surfaces do not allow for the assessing the activity of different surfaces in overall sensor response. A different situation appears for elongated Q-1D nanocrystals of ZnO (wurtzite-type) and c-In2O3 (bixbyite-type). For both, the as-grown nanobelts have symmetrical side facets, i.e. {00–10} for ZnO and {100} for c-In2O3. The only issue is to mask base facets which are {0001} for ZnO and {110} for c-In2O3. The latter is achieved in vertical arrays placing both electrodes on ground/base oxides facets (or to grow such aligned structures on one of the electrodes) (Figure 26). In this way both the information about reception and transduction mechanisms will be obtained simultaneously.
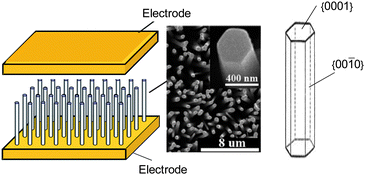 | ||
| Fig. 26 As hexagonal ZnO nanowires could be obtained with elongated hexagon morphology with {00-10} side facets and they could be easily aligned, they could serve as almost ideal structures for such fundamental studies. (In the middle) copyright the American Chemical Society, reproduced from ref. 81 with permission. | ||
Operando spectroscopy on well-defined crystals
Well-defined materials will not only allow for separation of so-called “smoothly scalable” size-dependent properties from qualitatively new effects appeared as particle size decreases, but also will provide deep insight into gas sensor operation and finally lead to the control over gas sensing activity. The fundamental studies of gas sensing mechanisms will involve (i) gas sensing measurements on specific surfaces, (ii) their atomistic/quantum chemical modelling and (ii) spectroscopic characterisation of same surfaces under operation conditions of sensors. The latter can be named operando characterization of morphologically-controlled nano-chemiresistors (Figure 27).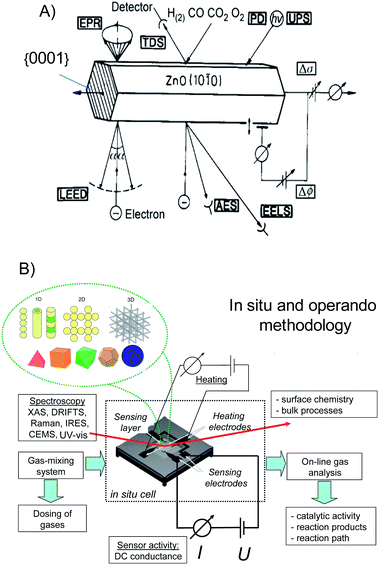 | ||
| Fig. 27 (A) Surface science on prototype structures. Copyright Elsevier, reproduced from the ref. 82 with permission. (B) Operando methodology for studying the mechanism of gas-sensing of morphologically-controlled nano-chemoresistors. 10 | ||
This methodology can be regarded as a development of a first systematic strategy in sensor research which was directed to the studies of the surfaces of single crystals under well-defined conditions.82 Doing this, the surface reactions were addressed by spectroscopic tools of surface science under ultra-high-vacuum (UHV) conditions on well-defined ZnO single crystals while the sensor performance was elucidated under realistic measuring conditions on sensors (Figure 27 A).
The operando characterization of morphologically-controlled nano-chemiresistors couples electrical and spectroscopic techniques aiming to correlate the sensor activity with the spectroscopic data obtained under the same conditions on the same sample. All these factors determine the boundary conditions under which an “operando” experiment is performed (Figure 27 B): (i) on a sensing element, (ii) in real time, under operating conditions: these can vary from ambient conditions (RT and atmospheric pressure) to high temperatures and pressures; (iii) with simultaneous read-out of sensor activity: the gas concentration to be measured is transduced by the sensor into an electrical output; and (iv) with simultaneous monitoring of gas composition.
The deep insight into gas sensor operation obtained on morphologically-controlled nanocrystals will result in better understanding of surface and bulk reactions responsible for gas sensing effects and will finally lead to the development of better sensors with increased selectivity and sensitivity in the chemical determination of gases.
Acknowledgements
The financial support by the Alexander von Humboldt Foundation is gratefully acknowledged.Notes and references
- S. W. Chung, D. S. Ginger, M. W. Morales, Z. F. Zhang, V. Chandrasekhar, M. A. Ratner and C. A. Mirkin, Small, 2004, 1, 64–69 Search PubMed.
- D. L. Carrillo, Chemical Engineering Progress, 2003, 99 Search PubMed.
- J. T. Devreese, MRS Bulletin, 2007, 32, 718–724 CAS.
- V. Dobrokhotov, D. N. McIlroy, M. G. Norton, A. Abuzir, W. J. Yeh, I. Stevenson, R. Pouy, J. Bochenek, M. Cartwright, L. Wang, J. Dawson, M. Beaux and C. Berven, J. Appl. Phys., 2006, 99, 104302 CrossRef.
- A. Kolmakov and M. Moskovits, Annu. Rev. Mater. Res., 2004, 34, 151–180 CrossRef CAS.
- V. V. Sysoev, T. Schneider, J. Goschnick, I. Kiselev, W. Habicht, H. Hahn, E. Strelcov and A. Kolmakov, Sens. Actuators, B, 2009, 139, 699–703 CrossRef.
- E. Comini and G. Sberveglieri, Mater. Today, 2010, 13, 28–36 CrossRef CAS.
- Y. W. Heo, L. C. Tien, D. P. Norton, B. S. Kang, F. Ren, B. P. Gila and S. J. Pearton, Appl. Phys. Lett., 2004, 85, 2002–2004 CrossRef CAS.
- J. Tamaki, J. Niimi, S. Ogura and S. Konishi, Sens. Actuators, B, 2006, 117, 353–358 CrossRef.
- A. Gurlo and R. Riedel, Angew. Chem., Int. Ed., 2007, 46, 3826–3848 CrossRef CAS.
- M. Batzill and U. Diebold, Prog. Surf. Sci., 2005, 79, 47–154 CrossRef CAS.
- F. Hernandez-Ramirez, J. D. Prades, R. Jimenez-Diaz, T. Fischer, A. Romano-Rodriguez, S. Mathur and J. R. Morante, Phys. Chem. Chem. Phys., 2009, 11, 7105–7110 RSC.
- E. Roduner, Chem. Soc. Rev., 2006, 35, 583–592 RSC.
- C. Xu, J. Tamaki, N. Miura and N. Yamazoe, Sens. Actuators, B, 1991, 3, 147–155 CrossRef.
- A. Rothschild and Y. Komem, J. Appl. Phys., 2004, 95, 6374–6380 CrossRef CAS.
- L. Madler, T. Sahm, A. Gurlo, J. D. Grunwaldt, N. Barsan, U. Weimar and S. E. Pratsinis, J. Nanopart. Res., 2006, 8, 783–796 CrossRef.
- A. Gurlo, N. Barsan, M. Ivanovskaya, U. Weimar and W. Gopel, Sens. Actuators, B, 1998, 47, 92–99 CrossRef.
- M. E. Franke, T. J. Koplin and U. Simon, Small, 2006, 2, 36–50 CrossRef CAS.
- A. Seyed-Razavi, I. K. Snook and A. S. Barnard, J. Mater. Chem., 2010, 20, 416–421 RSC.
- G. Korotcenkov, Mater. Sci. Eng., R, 2008, 61, 1–39 CrossRef.
- G. Eranna, B. C. Joshi, D. P. Runthala and R. P. Gupta, Crit. Rev. Solid State Mat. Sci., 2004, 29, 111–188 Search PubMed.
- T. Sahm, A. Gurlo, N. Barsan, U. Weimar and L. Madler, Thin Solid Films, 2005, 490, 43–47 CrossRef CAS.
- T. Sahm, A. Gurlo, N. Barsan and U. Weimar, Part. Sci. Technol., 2006, 24, 441–452 Search PubMed.
- N. Barsan and U. Weimar, J. Phys.: Condens. Matter, 2003, 15, R813–R839 CrossRef CAS.
- A. Gurlo, ChemPhysChem, 2006, 7, 2041–2052 CrossRef CAS.
- A. S. Barnard and L. A. Curtiss, Nano Lett., 2005, 5, 1261–1266 CrossRef CAS.
- E. Comini, G. Faglia, G. Sberveglieri, Z. W. Pan and Z. L. Wang, Appl. Phys. Lett., 2002, 81, 1869–1871 CrossRef CAS.
- A. Maiti, J. A. Rodriguez, M. Law, P. Kung, J. R. McKinney and P. D. Yang, Nano Lett., 2003, 3, 1025–1028 CrossRef.
- Z. R. Dai, Z. W. Pan and Z. L. Wang, Adv. Funct. Mater., 2003, 13, 9–24 CrossRef CAS.
- Z. R. Dai, Z. W. Pan and Z. L. Wang, Solid State Commun., 2001, 118, 351–354 CrossRef CAS.
- W. Bergermayer and I. Tanaka, Appl. Phys. Lett., 2004, 84, 909–911 CrossRef CAS.
- X. G. Han, M. S. Jin, S. F. Xie, Q. Kuang, Z. Y. Jiang, Y. Q. Jiang, Z. X. Xie and L. S. Zheng, Angew. Chem., Int. Ed., 2009, 48, 9180–9183 CrossRef CAS.
- A. Gurlo, Small, 2010, 6, 2077–2079 CrossRef CAS.
- H. Z. Zhang and J. F. Banfield, J. Mater. Chem., 1998, 8, 2073–2076 RSC.
- M. Batzill, W. Bergermayer, I. Tanaka and U. Diebold, Surf. Sci., 2006, 600, L29–L32 CAS.
- M. Batzill, K. Katsiev, J. M. Burst, U. Diebold, A. M. Chaka and B. Delley, Phys. Rev. B: Condens. Matter Mater. Phys., 2005, 72, 165414 CrossRef.
- M. Batzill, K. Katsiev and U. Diebold, Appl. Phys. Lett., 2004, 85, 5766–5768 CrossRef CAS.
- M. Batzill, A. M. Chaka and U. Diebold, Europhys. Lett., 2004, 65, 61–67 CrossRef CAS.
- M. Batzill and U. Diebold, Phys. Chem. Chem. Phys., 2007, 9, 2307–2318 RSC.
- A. Gurlo, M. Ivanovskaya, N. Barsan and U. Weimar, Inorg. Chem. Commun., 2003, 6, 569–572 CrossRef CAS.
- A. Gurlo, P. Kroll and R. Riedel, Chemistry-a European Journal, 2008, 14, 3306–3310 CrossRef CAS.
- A. Gurlo, D. Dzivenko, P. Kroll and R. Riedel, Phys. Status Solidi RRL, 2008, 2, 269–271 Search PubMed.
- A. Oprea, A. Gurlo, N. Barsan and U. Weimar, Sens. Actuators, B, 2009, 139, 322–328 CrossRef.
- M. R. Shi, F. Xu, K. Yu, Z. Q. Zhu and J. H. Fang, J. Phys. Chem. C, 2007, 111, 16267–16271 CrossRef CAS.
- C. H. Lee, M. Kim, T. Kim, A. Kim, J. Paek, J. W. Lee, S. Y. Choi, K. Kim, J. B. Park and K. Lee, J. Am. Chem. Soc., 2006, 128, 9326–9327 CrossRef CAS.
- A. Gurlo, S. Lauterbach, G. Miehe, H.-J. Kleebe and R. Riedel, J. Phys. Chem. C, 2008, 112, 9209–9213 CrossRef CAS.
- O. Bierwagen, M. E. White, M. Y. Tsai and J. S. Speck, Appl. Phys. Lett., 2009, 95, 262105 CrossRef.
- C. Y. Wang, Y. Dai, J. Pezoldt, B. Lu, T. Kups, V. Cimalla and O. Ambacher, Cryst. Growth Des., 2008, 8, 1257–1260 CrossRef CAS.
- A. Bourlange, D. J. Payne, R. M. J. Jacobs, R. G. Egdell, J. S. Foord, A. Schertel, P. J. Dobson and J. L. Hutchison, Chem. Mater., 2008, 20, 4551–4553 CrossRef CAS.
- V. Golovanov, M. A. Maki-Jaskari, T. T. Rantala, G. Korotcenkov, V. Brinzari, A. Cornet and J. Morante, Sens. Actuators, B, 2005, 106, 563–571 CrossRef.
- C. G. Zhou, J. Y. Li, S. Chen, J. P. Wu, K. R. Heier and H. S. Cheng, J. Phys. Chem. C, 2008, 112, 14015–14020 CrossRef CAS.
- E. H. Morales, Y. B. He, M. Vinnichenko, B. Delley and U. Diebold, New J. Phys., 2008, 10 Search PubMed.
- E. H. Morales and U. Diebold, Appl Phys Lett, 2009, 95 Search PubMed.
- J. J. Richardson and F. F. Lange, Cryst. Growth Des., 2009, 9, 2576–2581 CrossRef CAS.
- X. G. Han, H. Z. He, Q. Kuang, X. Zhou, X. H. Zhang, T. Xu, Z. X. Xie and L. S. Zheng, J. Phys. Chem. C, 2009, 113, 584–589 CrossRef CAS.
- M. J. S. Spencer and I. Yarovsky, J. Phys. Chem. C, 2010, 114, 10881–10893 CrossRef CAS.
- J. D. Prades, A. Cirera and J. R. Morante, Sens. Actuators, B, 2009, 142, 179–184 CrossRef.
- M. Breedon, M. J. S. Spencer and I. Yarovsky, Surf. Sci., 2009, 603, 3389–3399 CrossRef CAS.
- M. Breedon, M. J. S. Spencer and I. Yarovsky, J. Phys.: Condens. Matter, 2009, 21, 144208 CrossRef.
- A. Wander and N. M. Harrison, J. Phys. Chem. B, 2001, 105, 6191–6193 CrossRef CAS.
- K. Fink, Phys. Chem. Chem. Phys., 2006, 8, 1482–1489 RSC.
- A. D. Walkingshaw, N. A. Spaldin and E. Artacho, Phys. Rev. B: Condens. Matter Mater. Phys., 2004, 70 Search PubMed.
- V. Khatko, F. Guirado, J. Hubalek, E. Llobet and X. Correig, Phys. Status Solidi A, 2005, 202, 1973–1979 CrossRef CAS.
- M. Boulova and G. Lucazeau, Journal of Solid State Chemistry, 2002, 167, 425–434 CAS.
- I. Jimenez, J. Arbiol, G. Dezanneau, A. Cornet and J. R. Morante, Sens. Actuators, B, 2003, 93, 475–485 CrossRef.
- G. A. Wang, Y. A. Ji, X. R. Huang, X. Q. Yang, P. I. Gouma and M. Dudley, J. Phys. Chem. B, 2006, 110, 23777–23782 CrossRef CAS.
- J. Polleux, A. Gurlo, N. Barsan, U. Weimar, M. Antonietti and M. Niederberger, Angew. Chem., Int. Ed., 2006, 45, 261–265 CrossRef CAS.
- M. E. Toimil-Molares, A. G. Balogh, T. W. Cornelius, R. Neumann and C. Trautmann, Appl. Phys. Lett., 2004, 85, 5337–5339 CrossRef CAS.
- P. M. Woodward, A. W. Sleight and T. Vogt, J. Solid State Chem., 1997, 131, 9–17 CrossRef CAS.
- K. R. Locherer, I. P. Swainson and E. K. H. Salje, J. Phys.: Condens. Matter, 1999, 11, 6737–6756 CrossRef CAS.
- C. J. Howard, V. Luca and K. S. Knight, J. Phys.: Condens. Matter, 2002, 14, 377–387 CrossRef CAS.
- J. Zhou, Y. Ding, S. Z. Deng, L. Gong, N. S. Xu and Z. L. Wang, Adv. Mater., 2005, 17, 2107–2110 CrossRef CAS.
- G. A. de Wijs, P. K. de Boer, R. A. de Groot and G. Kresse, Phys. Rev. B: Condens. Matter Mater. Phys., 1999, 59, 2684–2693 CrossRef CAS.
- P. Lindan, E. Duplock, C. Zhang, M. Thomas, R. Chatten and A. Chadwick, Dalton Trans., 2004, 3076–3084 RSC.
- R. Chatten, A. V. Chadwick, A. Rougier and P. J. D. Lindan, J. Phys. Chem. B, 2005, 109, 3146–3156 CrossRef CAS.
- D. E. Williams, Sens. Actuators, B, 1999, 57, 1–16 CrossRef.
- M. Boulova, A. Gaskov and G. Lucazeau, Sens. Actuators, B, 2001, 81, 99–106 CrossRef.
- A. Ponzoni, E. Comini, G. Sberveglieri, J. Zhou, S. Z. Deng, N. S. Xu, Y. Ding and Z. L. Wang, Appl. Phys. Lett., 2006, 88, 203101 CrossRef.
- A. Kuzmin, J. Purans, E. Cazzanelli, C. Vinegoni and G. Mariotto, J. Appl. Phys., 1998, 84, 5515–5524 CrossRef CAS.
- M. Levy and T. Pagnier, Sens. Actuators, B, 2007, 126, 204–208 CrossRef.
- M. J. Zhou, H. J. Zhu, X. N. Wang, Y. M. Xu, Y. Tao, S. Hark, X. D. Xiao and Q. Li, Chem. Mater., 2010, 22, 64–69 CrossRef CAS.
- W. Goepel, Prog. Surf. Sci., 1985, 20, 9–103 CrossRef CAS.
Footnote |
| † Current address: Harvard School of Applied and Engineering Sciences (SEAS), Harvard University, 29 Oxford Street, Cambridge, MA 02138, USA; Phone: 001-617-496-4295; e-mail: E-mail: agurlo@seas.harvard.edu |
| This journal is © The Royal Society of Chemistry 2011 |
