Uptake and withdrawal of droplets from carbon nanotubes
D.
Schebarchov
a and
S. C.
Hendy
ab
aIndustrial Research Ltd, Lower Hutt, 5010, New Zealand
bMacDiarmid Institute for Advanced Materials and Nanotechnology, School of Chemical and Physical Sciences, Victoria University of Wellington, Wellington, 6140, New Zealand
First published on 27th September 2010
Abstract
We give an account of recent studies of droplet uptake and withdrawal from carbon nanotubes using simple theoretical arguments and molecular dynamics simulations. Firstly, the thermodynamics of droplet uptake and release is considered and tested via simulation. We show that the Laplace pressure acting on a droplet assists capillary uptake, allowing sufficiently small non-wetting droplets to be absorbed. We then demonstrate how the uptake and release of droplets of non-wetting fluids can be exploited for the use of carbon nanotubes as nanopipettes. Finally, we extend the Lucas-Washburn model to deal with the dynamics of droplet capillary uptake, and again test this by comparison with molecular dynamics simulations.
 D. Schebarchov | Dmitri Schebarchov received a conjoint BSc/BCA in 2006 and a PhD in Physics in 2010 from Victoria University of Wellington in New Zealand. He is currently a post-doctoral fellow in the Applied Mathematics Team at Industrial Research Ltd in Lower Hutt, New Zealand. His research interests include modelling and simulation of carbon nanotube growth, nanoparticle melting and the flow of confined fluids. |
 S. C. Hendy | Dr Shaun Hendy is the Deputy Director of the MacDiarmid Institute for Advanced Materials and Nanotechnology (based at the School of Chemical and Physical Sciences at Victoria University of Wellington, New Zealand) and a Distinguished Scientist at Industrial Research Ltd. His PhD in Physics from the University of Alberta, Canada in 1998 was followed by a NZ Science and Technology post-doctoral fellowship at Industrial Research Ltd in Lower Hutt, New Zealand. He joined the permanent staff at Industrial Research Ltd in 2000 but has had a joint role with Victoria University of Wellington since 2003. |
I. Introduction
Some of the many proposed applications for carbon nanotubes (CNTs)1 involve the uptake or withdrawal of material from the interior of the tube.2 For example, carbon nanotubes have been suggested for use as drug delivery agents for medical applications.3–5 Such applications would require uptake of drug molecules and their subsequent release once the tube was delivered to the target. Uptake and release may also occur inadvertently. For instance, there are many reports of spontaneous encapsulation of metal catalyst particles during nanotube growthviachemical vapour deposition, an effect usually attributed to capillary forces6,7 Such contaminants have the potential for toxicity if it was subsequently to be released8 and would be undesirable were the tubes to be used in vivo. In order to control such processes, a quantitative understanding of the uptake and release of materials from carbon nanotubes will be required.At the same time there is also considerable interest in understanding the flow of liquids through carbon nanotubes.9 Of particular interest is the diameter of nanotube at which macroscopic fluid mechanical concepts break down or need to be modified. For instance, polymer membranes permeated by sub-2 nm diameter carbon nanotubes, which have the potential to greatly enhance the performance of the reverse osmosis desalination process,10 have been found to allow anomalously high flow rates of water, possibly due a high degree of fluid slip at the nanotube wall.11 Molecular dynamics simulations are not able to fully explain these enhanced flow rates, although such simulations suggest that they may be due to a combination of large slip and the reduced viscosity of the confined water.12
Experimentally, it is still difficult to study flow in individual carbon nanotubes. Nonetheless, molecular dynamics simulations have provided some tests of the applicability of the classical Lucas-Washburn law13,14 for describing capillary rise in nanotubes:
 | (1) |
However the uptake of droplets has received less attention. Here the capillary uptake of non-wetting fluids (θc > 90°) can occur, provided the droplet is small enough relative to the capillary diameter.16 Such effects could lead to the unwanted uptake and release of contaminants by nanotubes. Yet it also allows for the possibility of droplet uptake and release, and is likely to be important for the operation of carbon nanotubes as nanopipettes.17 While wetting droplets will be easily absorbed by a capillary, only droplets that are non-wetting can be both absorbed and withdrawn using capillary forces. For carbon nanotube capillaries, this includes liquids such as water (which has a contact angle on graphene of 127°18) and many metals.36,37 In addition, tubes could presumably be functionalised in order to control their wettability with respect to a particular liquid. Therefore it is of both theoretical and experimental interest to understand the effect of a finite reservoir on the dynamics associated with the absorption process.
In this article, we give an account of some of our recent studies of capillary interactions between metal droplets and carbon nanotubes.20,21 These studies employ simple theoretical arguments based on surface energy considerations, including a generalisation of the Lucas-Washburn theory to deal with the case of droplets that is tested at the nanometre scale using molecular dynamics simulations. It is important to note that some of the results described here are quite general. They are applicable to microscale capillaries22,23 as well as other nanocapillaries and other simple liquids including water.23 Furthermore, the thermodynamic arguments based on surface energies can be extended to the uptake and withdrawal of solid particles, something which has recently been demonstrated experimentally24
We begin by considering the thermodynamics of droplet uptake and release in Section II.
We will first construct a thermodynamic model based on a surface energy balance (Section IIA), and then test the understanding gained through the use of molecular dynamics simulations (Section IIB). We will also demonstrate how the uptake and release of non-wetting fluids can be exploited for the use of carbon nanotubes as nanopipettes (Section IIC). The dynamics of droplet uptake will be treated in Section III, where we shall first extend the Lucas-Washburn model to deal with the capillary uptake of droplets, and then compare it with molecular dynamics simulations. The implications of our findings will be briefly discussed in Section IV and summarised in Section V.
II. The thermodynamics of droplet absorption
Macroscopically, the sign and magnitude of the pressure difference ΔP across the liquid meniscus in a capillary tube depend on the contact angle θc: | (2) |
However, if the reservoir that feeds the capillary is replaced by a small spherical droplet of liquid (of radius rd), the net capillary pressure on the liquid column will depend not only on the pressure difference across the meniscus, but also on the Laplace pressure 2γ/rd acting on the surface of the protruding droplet. Balancing the Laplace pressure with the meniscus pressure gives a simple condition for absorption of non-wetting liquid droplets:
 | (3) |
Thus sufficiently small droplets of non-wetting liquids can be absorbed by capillaries. To the best of our knowledge this was first pointed out by Marmur.16
A. A model for droplet absorption
In ref. 20 we derived a continuum model for absorption of substrate-supported droplets. Here were present an approximation to this previous model, where substrate effects are excluded for brevity, which concisely illustrates the key points. Note that we expect such a model to remain valid provided that the droplet remains spherical and that quantities like surface energies remain well-defined and independent of both droplet size and tube diameter. In practise this means that the droplet must be significantly smaller than the capillary length (approximately 2 mm for a metal such as mercury), where ρ is the liquid density and g is the acceleration due to gravity. Further, once the tube becomes small enough that metal atoms enter in single file for instance, concepts such as surface energies cease to become meaningful. Thus it is not expected that this model will apply in the smallest carbon nanotubes.
Hence we consider a spherical droplet of radius rd adjacent to a cylindrical tube of inner radius rt < rd, as shown in Fig. 1, both in some inert atmosphere or in vacuum. Under what conditions will the droplet be drawn inside the tube? At the nanometre scale, where gravitational effects are negligible, the system will seek to minimise its surface free energy (Γ). By expressing the energy of the droplet-vapour, tube-vapour and tube-droplet interfaces as the product of their respective areas and the corresponding surface energy densities: γd, γt and γtd, the total surface free energy of the model system in Fig. 1 can be written as a function of protrusion radius r:
| Γ(r) = 4πr2γd + 2πrth(r)γtd + 2πrt[h(rt) − h(r)]γt |
![[triple bond, length as m-dash]](https://www.rsc.org/images/entities/char_e002.gif) [Γ(r) − Γ(rd)]/[4πr2tγd]. Using Young's relation (γdcosθc = γt - γtd) Δ can be written as
[Γ(r) − Γ(rd)]/[4πr2tγd]. Using Young's relation (γdcosθc = γt - γtd) Δ can be written as | (4) |
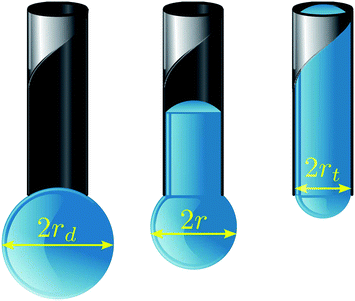 | ||
| Fig. 1 Our model geometry for droplet absorption by a capillary of inner radius rt. The droplet consists of a meniscus and protrusion, both modelled as spherical caps of radius r, connected by a cylindrical column of height h. Note that r is bounded by rt < r < rd, and it is related to h through the constant volume constraint. | ||
A selection of Δ(r) curves is illustrated in Fig. 2, where each curve is plotted for a specified θc and ratio rd/rt. The energy functions are concave down, implying that all the states in the range rt < r < rd are unstable and, in equilibrium, the droplet will either be fully encapsulated (r = rt) or remain completely withdrawn (r = rd). We see that, as in the case of an infinite reservoir, increasing θc raises the energy associated with complete encapsulation. However, it is also clear that droplet size changes the thermodynamics of our system. More importantly, Fig. 2 shows that the state of complete encapsulation can be favoured even if θc > 90°, thus allowing for the absorption of sufficiently small non-wetting droplets.
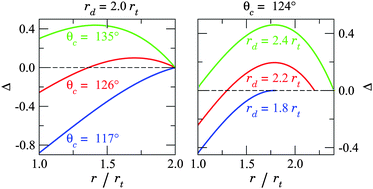 | ||
| Fig. 2 Dimensionless surface energy (△) as a function of protrusion radius (r), evaluated for various droplet sizes (rd) and wetting angles (θc). The lowest energy state is either that of complete encapsulation (r = rt) or full withdrawal (r = rd), whilst all the intermediate states (rt < r < rd) are unstable. Absorption is energetically favoured to withdrawal when Δ(r)|r = rt < 0, which can be satisfied even if θc > 90°. An energy barrier appears for rd > −rt/cosθc, which can hinder capillary uptake even if complete encapsulation is preferred. | ||
Note that Δ(r) is a cubic polynomial in r with two stationary points. The local minimum at r = 0 is not physical in our model but the local maximum at r = r† ![[triple bond, length as m-dash]](https://www.rsc.org/images/entities/char_e002.gif) −rt/cosθc, on the other hand, represents an energy barrier to absorption. This barrier vanishes if rd < r†, yielding the same size-dependent condition for spontaneous absorption as in (3). For r† < rd < ∞, however, the state of complete encapsulation is either stable or metastable, and it becomes unstable only in the limit of θc→180°. Hence, if one relies on an external force to push a droplet of finite volume into a capillary, the droplet will likely remain trapped in the completely absorbed state, because its withdrawal will always be opposed by an energy barrier.
−rt/cosθc, on the other hand, represents an energy barrier to absorption. This barrier vanishes if rd < r†, yielding the same size-dependent condition for spontaneous absorption as in (3). For r† < rd < ∞, however, the state of complete encapsulation is either stable or metastable, and it becomes unstable only in the limit of θc→180°. Hence, if one relies on an external force to push a droplet of finite volume into a capillary, the droplet will likely remain trapped in the completely absorbed state, because its withdrawal will always be opposed by an energy barrier.
The state of complete encapsulation becomes energetically less favourable than full withdrawal at the point when Δ(rt) = 0. This condition can be solved analytically for rd (or cosθc), leading to another critical droplet radius r*d > r†. Droplets with rd in the range r† < rd < r*d will prefer complete encapsulation, but will have to overcome an energy barrier to reach this state. We refer to this regime as activated capillary absoprtion, as opposed to spontaneous capillary absorption that occurs with rd < r†. These distinct regimes are illustrated in Fig. 3, demonstrating the effects of droplet size and the wetting angle on capillary action.
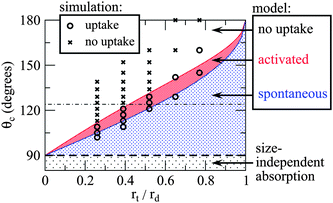 | ||
| Fig. 3 A phase diagram of different “capillarity” regimes predicted by the model considered here. As with macroscopic reservoirs, fluids with θc < 90° undergo spontaneous absorption regardless of droplet size. For fluids with θc > 90°, the condition for capillary uptake is size-dependent. The distinction between activated and spontaneous capillary absorption regimes lies in whether or not there is an energy barrier to uptake. The size dependence predicted by our continuum mode is in good agreement with molecular dynamics simulations. The horizontal line at θc = 124° marks the contact angle formed by Ag droplets on graphite.26 | ||
It is interesting to consider the activation energy EA at the threshold where complete absorption ceases to be thermodynamically stable. Its size dependence, namely EA(rd), can be determined by first substituting r = r† into Δ(r) and then using the condition Δ(rt) = 0 to eliminate cosθc. This exercise leads to:
 | (5) |
B. Simulations of droplet absorption
We now use molecular dynamics to demonstrate capillary uptake of non-wetting droplets at the nanoscale and to test our model from the previous section. Here we will investigate the absorption of transition metal droplets. Absorbed metal droplets are frequently observed after carbon nanotube growth, so it is of interest to investigate the conditions under which metal droplets can be absorbed by nanotubes. However, it is important to realise that the model developed in the previous section is general enough that it should apply to other liquids and other types of capillary tube.Our simulated systems comprise a molten Ag particle of rd ≈ 3.9 nm (10473 atoms) adjacent to an open end of a single-walled carbon nanotube of radius rt < rd. The cohesion within the droplet is modelled using an embedded atom method potential,25 whereas the carbon atoms in the nanotubes are fixed. We will consider five zigzag nanotubes of different radii: 1.0, 1.5, 2.0, 2.5 and 3.0 nm. Note that the chirality of the tube is not expected to play a significant role in absorption for the sizes of tube considered here, as contact angles have not been found to vary significantly with chirality.18 For convenience, the pairwise Ag–C binding (i.e. the droplet's adhesion to the nanotube) is approximated with the Lennard-Jones potential:  , smoothly truncated at 10 Å and with σ = 2.9 Å. The remaining degree of freedom, namely ε, can be varied to adjust the interfacial surface Ag–C energy, which we parameterise using the droplet contact angle θc of the molten metal on graphite. Fig. 4 shows that cosθc responds linearly to ε, which is expected because cosθc∝γtd according to Young's equation, and γtd is the surface energy density required to separate the droplet from the substrate:
  . The apparent linearity in Fig. 4 indicates that surface energies do not change appreciably with curvature at the droplet sizes considered here, hence we approximate the meniscus contact angle with that of a droplet on planar graphene, which is easier to estimate.
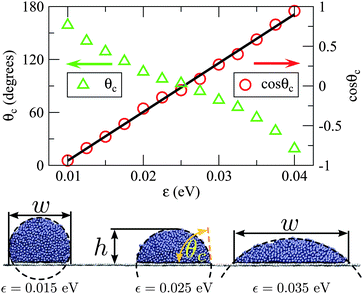 | ||
| Fig. 4 A demonstration of how ε affects the geometry of molten Ag droplets on graphene. The contact angle (θc) was determined from h and w using the geometry of spherical caps. We find that cosθc varies roughly linearly with ε between 0.01 eV and 0.04 eV. From the linear fit we infer that ε ≤ 0.009 eV and ε ≥ 0.042 eV lead to extreme non-wetting (θc = 180°) and complete wetting (θc = 0°) respectively. | ||
Ag droplets are known to physisorb to mono-crystalline graphite with θc = 124°,26 which corresponds to choosing ε ≈ 0.015 eV in our simulations. However, it is more convenient to test our model by gradually increasing ε by small increments, thus decreasing θc until the initial droplet is absorbed. During this procedure we simulate the system for 1.2 ns at each value of ε, with the time step set to 2 fs, while monitoring the meniscus height h. We fix the temperature of the droplet at 1400 K by rescaling the atomic velocities, which does not lead to vapour formation. Note that this relatively high temperature was chosen both to ensure the metal droplets were molten, and to speed up the timescale of the absorption process so that it is accessible to simulation. The theory in the previous section does not depend on temperature, except in that parameters such as surface energies will be temperature dependent.
The outcome of this simulation scheme is shown in Fig. 5, where we consider the droplet to have been absorbed once h/(2rt) > 1.5 is satisfied. It is clear that increasing tube radius systematically raises the critical value of ε for absorption. The specified ε values can be converted to θc using the linear fit in Fig. 4, allowing us to directly compare our simulations with the continuum model (see Fig. 3). From this comparison we find that the size-dependent condition for activated capillary uptake, as predicted by the continuum model, is in good agreement with the simulated data. Note that the agreement between the theory and the simulations in Fig. 5 becomes worse at large contact angles. In fact, for small values of ε (corresponding to large contact angles) the energy of interaction between the droplet and the tube starts to become comparable to kT. As the model neglects thermal effects, we would expect it to perform worse at large contact angles.
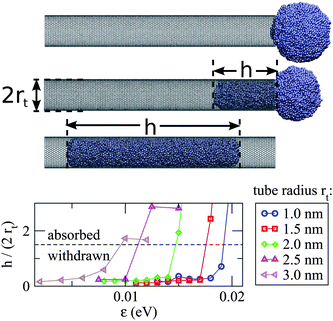 | ||
| Fig. 5 (Top) Snapshots illustrate the simulation of a Ag droplet (rd = 3.9 nm) near the open end of a single-walled carbon nanotube (rt = 2.0 nm). Note that in the last frame that the droplet has moved beyond the tube neck due to inertia. (Bottom) Five zigzag nanotubes of different radius are considered, and in each case the value of ε is gradually increased until the droplet is absorbed. The maximum value of h/(2rt) obtained from each simulation is plotted versus the specified ε. We only consider ε < 0.025 eV, corresponding to the non wetting regime (θc > 90°), hence capillary uptake here is driven solely by the Laplace pressure acting on the droplet. | ||
C. Droplet withdrawal
Now consider the situation when a capillary that has been prefilled with a non-wetting droplet of radius r1 < −rt/cosθc (where cosθc < 0) is brought into contact with a larger droplet of radius r2 > − rt/cosθc. The net pressure difference ΔP acting on the column of fluid in the capillary will now drive withdrawal of the column from the capillary since | (4) |
Such a situation is illustrated in Fig. 6, which shows the simulated withdrawal of a non-wetting (θc ≈ 120°) Ag droplet from a CNT capillary by bringing it into contact with a larger (nonwetting) droplet of the same metal. In this particular simulation, we initially pre-filled a zigzag carbon nanotube (rt = 1 nm) with a molten Ag791 droplet (r1 = 1.5 nm) with ε in the Lennard-Jones potential for Ag–C interactions fixed at 0.016 eV to give a contact angle of 120°. Once it was fully absorbed, a larger Ag3898 droplet (r2 = 2.5 nm) was introduced near the same open end of the filled nanotube. The simulation was then resumed, leading to coalescence of the two droplets and complete withdrawal of the column from the capillary channel. Note that the initial absorption is driven solely by the Laplace pressure acting on the smaller droplet, as ΔP = 0.17(2γ)/rt > 0. The Laplace pressure is reduced once the larger droplet is introduced, resulting in ΔP = −0.1(2γ)/rt < 0 and complete withdrawal.
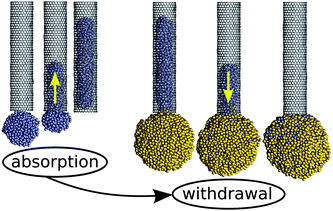 | ||
| Fig. 6 Simulated capillary absorption of a small Ag droplet (blue-coloured atoms), followed by its withdrawal when brought into contact with a larger droplet (gold-coloured atoms). During both, the absorption and the withdrawal, the same value of ε = 0.016 eV (θc ≈ 120°) was used. This demonstrates how droplet size can be exploited to control capillary action. | ||
This illustrates how capillary forces can be exploited to perform pipetting of a non-wetting liquid. Droplets can be absorbed by a capillary, provided they are sufficiently small, and then these droplets can be withdrawn by immersing the capillary in a sufficiently large droplet or reservoir.
III. The dynamics of droplet absorption
We now shift our focus to the dynamics of droplet absorption and present a generalized Lucas-Washburn equation that describes the uptake of droplets by capillaries. By comparing this equation with MD simulations, we will examine whether a Lucas-Washburn approach is adequate for modelling capillary absorption of liquid nanodroplets. Simulations of the absorption of a rd ≃ 3 nm palladium droplet by a rt ≃ 1.5 nm carbon nanotube were carried out along similar lines to that described in the previous sections. (More details can be found in ref. 21.) A variety of contact angles was considered (70° < θc < 120°) by means of varying the Lennard-Jones energy parameter ε (see Fig. 4), where absorption is expected based on the considerations above. Fig. 7 shows the average longitudinal velocity and atomic density profiles of the fluid for a variety of contact angles. Note that the velocity profile is reasonably well approximated by a parabolic profile, as would be expected for Poiseuille flow, although the fluid velocity is non-zero at the carbon nanotube walls.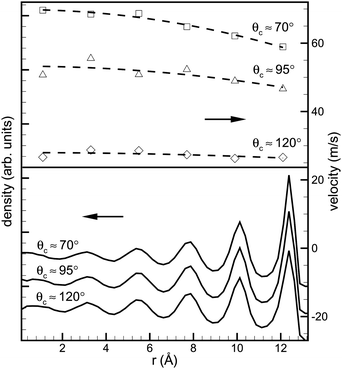 | ||
| Fig. 7 Averaged velocity (top) and density (bottom) profiles of the encapsulated liquid metal column during the uptake. The density profiles (in arbitrary units) indicate ordering of the fluid near the walls of the CNT. This corresponds to the well-defined concentric radial layers of palladium atoms, and the separation between these layers is around 2.2Å. The velocity profile was calculated by averaging the atomic velocities in each radial layer and the fits are of the form Ax2 + B, which allows extraction of the slip length b (reproduced from ref. 21). | ||
Also note the strong layering of the fluid that occurs in the tube. This leads to an increase in density of the liquid in the tube, particularly as θc gets larger. For θc ≈ 110° the average density of the droplet is ρd ≈ 59 nm−3, whereas the encapsulated column has a density of ρc ≈ 65 nm−3.
The dynamics of the penetration of a small drop into a capillary were first considered by Marmur.16 Marmur's approach generalises that of Lucas13 and Washburn14 by including the effects of droplet surface tension, as shown in Fig. 8. As with Lucas and Washburn, Marmur considered a fully developed, steady Poiseuille flow, which reduces the Navier–Stokes equations to a simple one-dimensional form. With this assumption Marmur was able to generalise the ordinary differential equation found by Lucas and Washburn to incorporate the Laplace pressure of the protruding droplet, but was unable to solve this equation analytically.
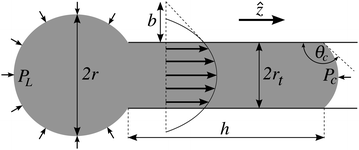 | ||
Fig. 8 Geometrical representation of the capillary tube and the penetrating droplet in cylindrical coordinates (![[r with combining circumflex]](https://www.rsc.org/images/entities/i_char_0072_0302.gif) , ,![[small straight theta, Greek, circumflex]](https://www.rsc.org/images/entities/i_char_e12d.gif) ,ẑ). There are four parameter (r, rt, h and θc) describing the geometry, but only three of them are independent if the fluid is incompressible. The velocity field of the encapsulated fluid is assumed to have a parabolic profile with slip length b. PL and PC represent the Laplace pressure and the pressure difference across the meniscus respectively (reproduced from ref. 21). ,ẑ). There are four parameter (r, rt, h and θc) describing the geometry, but only three of them are independent if the fluid is incompressible. The velocity field of the encapsulated fluid is assumed to have a parabolic profile with slip length b. PL and PC represent the Laplace pressure and the pressure difference across the meniscus respectively (reproduced from ref. 21). | ||
Instead, Marmur constructed an approximate solution, intended to be valid at early times in the absorption process. However, it is not clear that such an approach is meaningful, since the Lucas-Washburn model assumes steady-state flow which will take time to develop. In fact, we show here that if one neglects gravitational effects, Marmur's differential equation does admit an analytic solution.
However, as slip at the nanotube walls is clearly evident in Fig. 7, it is necessary to modify Marmur's equation to incorporate the effects of non-zero fluid slip at the tube walls.27 Slip can be incorporated using the Navier slip boundary condition28,29 for the velocity field at the CNT wall: −b∂![[r with combining circumflex]](https://www.rsc.org/images/entities/char_0072_0302.gif) υ|rt = υ|rt, where b is the so-called slip length. Slip lengths as large as tens of nanometres have been measured for simple liquids flowing over hydrophobic surfaces30 and there are indications that liquids flowing through carbon nanotubes may experience even larger degrees of slip.11
υ|rt = υ|rt, where b is the so-called slip length. Slip lengths as large as tens of nanometres have been measured for simple liquids flowing over hydrophobic surfaces30 and there are indications that liquids flowing through carbon nanotubes may experience even larger degrees of slip.11
Following Marmur, but incorporating the effects of slip, yields the following differential equation for the steady-state rise of a column of liquid in a capillary supported by a droplet:21
 | (5) |
This reduces to the differential equation of Lucas and Washburn as r→∞ and b→0. Note that eqn (5) can lead to capillary uptake even if θc > 90°, as long as rt/r > −cosθc, which is consistent with the thermodynamic model for spontaneous uptake given in the previous section.16,21 It is also worth noting that (5) will also describe droplet withdrawal, as discussed in Section II.C, when the right hand side is negative.
For an incompressible fluid, the volume of the droplet (initially of radius r0) will be preserved during encapsulation, hence if one neglects the difference between the curvature of the meniscus and the droplet:
| 3hr2t ≃ 4(r30 − r3). | (6) |
Then by eliminating h from (5) using (6), it is possible to obtain an analytic solution to (5). This is given in implicit form for θc≠90°:
 | (7) |
 | (8) |
 | (11) |
 | (9) |
Note that (8) is ill defined for θc = 90°: in this special case, a different form of the analytic solution can be found.21
Our solution is compared to Marmur's approximation in Fig. 9 for a variety of contact angles 70° < θc < 110° and with the dynamics observed in our MD simulations. In this figure we have fitted the simulation data using (7) by considering ts and t0 to be free parameters. We have assumed that the advancing wetting angle remains constant during the penetration, and that it can be approximated with that of a static θc formed on a flat graphene sheet (see Fig. 4). As our solution is based on a steady state approximation, we would expect it to be valid only at the intermediate and late stages of capillary uptake and not at early times where inertia is important. Indeed, this appears to be the case, with the solutions fitting the MD data much better at later times. The poorest fit is for θc = 110°, where the solution consistently overestimates the column height. This appears to be due to an increase in the density of the liquid column relative to that of the droplet. Note that eqn (7) is a consistently better fit to the simulation data than Marmur's approximation (particularly r(t)), and it successfully reproduces the super-linear meniscus rise rate seen in the simulations at the later stages of penetration.
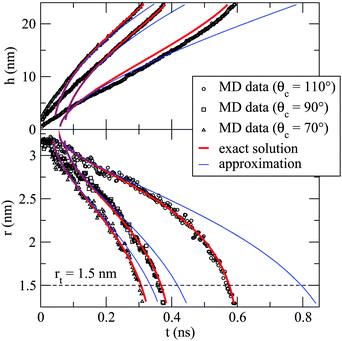 | ||
| Fig. 9 Plots of h(t) (top panel) and r(t) (bottom panel) comparing our solution to Marmur's approximation16 and to our MD simulations for three contact angles. The timescale ts has been fitted to the r(t) data but not the h(t). Our solution (7) is in much better agreement with MD simulations, particularly in the final stages of uptake. (Adapted from ref. 21). | ||
Thus, we conclude that the steady-state equation can qualitatively describe the intermediate and late stage behaviour of the simulated liquid column during droplet absorption. That quantitative agreement is also possible is evident in Table 1 where we have computed ts from eqn (9) using independent estimates of b (given in Table 1), μ (≈28 ± 7 eVÅ−3fs) and γ (≈0.108 ± 0.006 eVÅ−2), and compared to the fitted values for ts.21 The calculated values and the fitted values of ts are of similar magnitude, and increase proportionally as ε increases, yielding good quantitative agreement for 70° < θc < 95°. Note that the largest discrepancy in Table 1 is the value of ts for the case θc = 110°. Although the model assumes an incompressible fluid, a much better fit is obtained by ad hoc scaling of the predicted column height to match the observed density change21
IV. Discussion
The idea of using carbon nanotubes as capillaries is not new: early computer simulations predicted that carbon nanotubes could be used as “molecular straws” to absorb dipolar molecules.2 Since then, many methods have been developed to fill carbon nanotubes,31 and the scope of proposed applications includes electronics, catalysis, separation and storage technology.19,32–35 However, early studies by Dujardin et al.36,37 led to the conclusion that, since many metals do not wet graphite (θc > 90°), the prospect of exploiting capillary forces to absorb such metals was unlikely.However, particles of transition metal catalysts are often observed to have been encapsulated during the growth of carbon nanotubes after growth by chemical vapour deposition.6,38–40 It seems likely that the effects described in this article play a role in encapsulation of metal catalysts during growth. Furthermore, Zhang et al.41 have inferred the filling of carbon nanotubes by non-wetting Cu nanodroplets post hoc, while direct observations by electron microscopy of the capillary withdrawal of non-wetting silver nanoparticles from carbon nanotubes has recently been reported.24
The withdrawal of the metal catalyst particle is also thought to be an important step in the growth of carbon nanotubes.42Eqn (3) places an upper bound on the radius of a tube from which a catalyst particle of radius r will withdraw: rt < −r cosθc. In turn this suggests that for a given catalyst particle it should not be possible to grow tubes which exceed this critical radius. For cobalt, which has a measured contact angle of 140° on graphite,43 this critical radius is approximately 75% of the radius of the catalyst particle. It seems likely then that the balance of surface forces involved in catalyst particle withdrawal may be important for furthering our understanding of carbon nanotube growth.
While we have considered the absorption of liquid droplets here by nanoscale capillaries, similar behavior should be expected and has been observed for solid nanoparticles.24 Indeed, the arguments in section II.A rely only on surface energies. Thus, all things being equal, solid nanoparticles should be absorbed by carbon nanotubes if they are sufficiently small, even if the metal does ordinarily not wet graphite. However, it is worth noting that the dynamics of absorption will be different (e.g. surface diffusion or plastic flow) to the hydrodynamic flow considered here.
It is also worth pointing out that there is nothing inherently nanoscale in the phenomenon described here. Many of the assumptions applied here will remain valid until scales at which gravitational forces become important (i.e. at scales below the capillary length). Indeed, the absorption of water droplets below a critical size by a hydrophobic capillary has been demonstrated at the sub-millimeter scale.22,23 While Laplace-pressure driven microfluidics is not novel (e.g. see ref. 44), we believe the use of hydrophobic channels to facilitate droplet withdrawal has not yet been exploited. Such effects may turn out to be very useful in microfluidics.
We note that the quantitative agreement between the Lucas-Washburn model and our simulations is of similar quality to that found by Dimitrov 15 in their simulations of nanoscale capillary absorption from a reservoir. The results here are an arguably stronger test of the Lucas-Washburn model and so provide further evidence that the hydrodynamic approach can give a reasonable quantitative description of capillary flows at this scale. Below diameters of 2–3 nm it remains an open question as to what scale hydrodynamic models cease to provide good descriptions of capillary flows. Recent simulations12 suggest that if one allows for changes in both the viscosity and the slip length of water in carbon nanotubes as the diameter approaches 1 nm, one can account for much of the enhanced transport observed in experiments.11 In the smallest tubes one must expect that continuum concepts such as viscosity, slip length and surface tension will become meaningless. Nonetheless, it is certainly a pleasant surprise that, as shown here and elsewhere, such concepts can be employed quantitatively at scales as small as 2–3 nm.
V. Conclusion
In summary, we have reviewed here the demonstration of the absorption of non-wetting metal droplets by carbon nanotubes using empirical molecular dynamics simulations and a simple model based on the balance of surface energies. We have found a new solution to Marmur's equation for capillary absorption of small droplets.16 The quantitative agreement between the solution and the MD simulations supports the use of the Lucas-Washburn approach for modelling nanoscale capillary flows, providing one accounts for the finite size of the droplet and slip. These results suggest that it should be possible to fill CNTs with non-wetting liquids and solids, as long as the liquid droplets are sufficiently small. The demonstration of capillary withdrawal of non-wetting droplets from nanotubes also has implications for nanopipetting, as it illustrates how material can easily be imbibed and then withdrawn from a nanotube without the need for the application of external forces. In addition, the generalization of the Lucas-Washburn equation to the case of finite droplets achieved here should be useful for modelling the wicking of droplets into porous media, or any other capillary flow where the drop size is comparable to the pore radius.Acknowledgements
This work was supported by the Royal Society of New Zealand Marsden Fund contract number IRL0602, the New Zealand Foundation for Research, Science and Technology contract number C08X0707 and the MacDiarmid Institute for Advanced Materials and Nanotechnology. The simulations reported here were carried out at the University of Canterbury Supercomputer Facility.References
- S. Iijima, Nature, 1991, 354, 56 CrossRef CAS.
- M. R. Pederson and J. Q. Broughton, Phys. Rev. Lett., 1992, 69, 2689 CrossRef CAS.
- S. Costa, E. Borowiak-Palen, A. Bachmatiuk, M. H. Rummeli, T. Gemming and R. J. Kalenczuk, Phys. Status Solidi B, 2007, 244, 4315 CrossRef CAS.
- I. Monch, A. Leonhardt, A. Meye, S. Hampel, R. Kozhuharova-Koseva, D. Elefant, M. P. Wirth and B. Buchner, J. Phys. Conf. Ser., 2007, 61, 820 CrossRef.
- A. Bianco, K. Kostarelos and M. Prato, Curr. Opin. Chem. Biol., 2005, 9, 674 CrossRef CAS , ISSN 1367–5931.
- L. H. Chan, K. H. Hong, S. H. Lai, X. W. Liu and H. C. Shih, Thin Solid Films, 2003, 423, 27 CrossRef CAS.
- T. Fujita, Y. Hayashi, T. Tokunaga, T. Butler, N. L. Rupesinghe, K. B. K. Teo and G. A. J. Amaratunga, Appl. Phys. Lett., 2007, 90, 133116 CrossRef.
- A. Shvedova, E. R. Kisin, D. Porter, P. Schulte, V. E. Kagan, B. Fadeel and V. Castranova, Pharmacol. Ther., 2009, 121, 192 CrossRef CAS.
- M. Whitby and N. Quirke, Nat. Nanotechnol., 2007, 2, 87 CrossRef CAS.
- M. A. Shannon, Nat. Nanotechnol., 2010, 5, 248 CrossRef CAS.
- J. K. Holt, H. G. Park, Y. Wang, M. Stadermann, A. B. Artyukhin, C. P. Grigoropoulos, A. Noy and O. Bakajin, Science, 2006, 312, 1034 CrossRef CAS.
- J. A. Thomas and A. J. H. McGaughey, Phys. Rev. Lett., 2009, 102, 184502 CrossRef.
- R. Lucas, Kolloid-Z., 1918, 23, 15 CrossRef CAS.
- E. W. Washburn, Phys. Rev., 1921, 17273 Search PubMed.
- D. I. Dimitrov, A. Milchev and K. Binder, Phys. Rev. Lett., 2007, 99, 054501 CrossRef CAS.
- A. Marmur, J. Colloid Interface Sci., 1988, 122, 209 CrossRef.
- P. W. Sutter and E. A. Sutter, Nat. Mater., 2007, 6, 363 CrossRef CAS.
- S. Wang, Y. Zhang, N. Abidi and L. Cabrales, Langmuir, 2009, 25, 11078 CrossRef CAS.
- P. M. Ajayan and S. Iijima, Nature, 1993, 361, 333 CrossRef CAS.
- D. Schebarchov and S. C. Hendy, Nano Lett., 2008, 8, 2253 CrossRef CAS.
- D. Schebarchov and S. C. Hendy, Phys. Rev. E: Stat., Nonlinear, Soft Matter Phys., 2008, 78, 046309 CrossRef CAS.
- S. Palzer, K. Sommer and C. Hiebl, Chem. Eng. Technol., 2003, 26, 962 CrossRef CAS.
- G. R. Willmott, C. Neto and S. C. Hendy, Faraday Discuss., 2010, 146, 233 RSC.
- K. Edgar, R. D. Tilley, S. C. Hendy and D. Schebarchov, Nano Letters, 2010 Search PubMed.
- S. M. Foiles, M. I. Baskes and M. S. Daw, Phys. Rev. B: Condens. Matter, 1986, 33, 7983 CrossRef CAS.
- J. Lee, T. Tanaka, K. Seo, N. Hirai, J.-G. Lee and H. Mori, Rare Met., 2006, 25, 469 Search PubMed.
- C. Neto, D. R. Evans, E. Bonaccurso, H. J. Butt and V. S. J. Craig, Rev. Mod. Phys., 2005, 60, 2859.
- C. L. M. H. Navier, Mem. Acad. Sci. Inst. Fr., 1823, 6, 389 Search PubMed.
- C. L. M. H. Navier, Mem. Acad. Sci. Inst. Fr., 1823, 6, 432 Search PubMed.
- C. Cottin-Bizonne, A. Steinberger, B. Cross, O. Raccurt and E. Charlaix, Langmuir, 2008, 24, 1165 CrossRef CAS.
- F. Banhart, N. Grobert, M. Terrones, J. C. Charlier and P. M. Ajayan, Int. J. Mod. Phys. B, 2001, 15, 4037 CrossRef CAS.
- S. C. Tsang, P. J. F. Harris and M. L. H. Green, Nature, 1993, 362, 520 CrossRef CAS.
- S. C. Tsang, Y. K. Chen, P. J. F. Harris and M. L. H. Green, Nature, 1994, 372, 159 CrossRef CAS.
- G. Che, B. Lakshmi, C. Martin and E. Fisher, Langmuir, 1999, 15, 750 CrossRef CAS.
- R. F. Gibson, E. O. Ayorinde and Y. F. Wen, Compos. Sci. Technol., 2007, 67, 1 CrossRef.
- E. Dujardin, T. W. Ebbesen, H. Hiura and K. Tanigaki, Science, 1994, 265, 1850 CrossRef CAS.
- E. Dujardin, T. W. Ebbesen, A. Krishnan and M. M. J. Treacy, Adv. Mater., 1998, 10, 1472 CrossRef CAS.
- G. Y. Zhang and E. G. Wang, Appl. Phys. Lett., 2003, 82, 1926 CrossRef CAS.
- Y. Hayashi, T. Tokunaga, S. Toh, W. J. Moon and K. Kaneko, Diamond Relat. Mater., 2005, 14, 790 CrossRef CAS.
- P. M. Ajayan, C. Colliex, J. M. Lambert, P. Bernier, L. Barbedette, M. Tence and O. Stephan, Phys. Rev. Lett., 1994, 72, 1722 CrossRef CAS.
- Q. Zhang, W. Z. Qian, H. Yu, F. Wei and Q. Wen, Appl. Phys. A: Mater. Sci. Process., 2006, 86, 265 CrossRef.
- S. Hofmann, R. Sharma, C. Ducati, G. Du, C. Mattevi, C. Cepek, M. Cantoro, S. Pisana, A. Parvez and F. Cervantes-Sodi, et al, Nano Lett., 2007, 7, 602 CrossRef CAS.
- Y. Nikitin, E. V. Belyaeva and S. V. Tret'yakov, Sov. Powder Metall. Met. Ceram., 1979, 18, 57 Search PubMed , ISSN 0038–5735.
- G. M. Walker and D. J. Beebe, Lab Chip, 2002, 2, 131 RSC.
| This journal is © The Royal Society of Chemistry 2011 |
