Matrix-based multiparameter optimisation of glucokinase activators: the discovery of AZD1092†‡
Michael J.
Waring
*,
Craig
Johnstone
,
Darren
McKerrecher
,
Kurt G.
Pike
and
Graeme
Robb
Cardiovascular and Gastrointestinal Innovative Medicines Unit, AstraZeneca R&D, Mereside, Alderley Park, Macclesfield, Cheshire, SK10 4TG, UK. E-mail: mike.j.waring@astrazeneca.com; Tel: +44 (0) 1625 230942
First published on 28th June 2011
Abstract
Small molecule activators of the glucokinase enzyme have the potential to deliver a level of glycaemic control that is superior to current oral agents and hence have great promise as new therapies for Type 2 Diabetes. As such, attempts to discover glucokinase activators suitable for clinical development have been the focus of many major pharmaceutical research programmes. Here we show how property-based matrix optimisation has been used to improve the multi-parameter technical profile of the AstraZeneca series of glucokinase activators culminating in the discovery of the development candidate AZD1092.
Introduction
Type 2 Diabetes (T2D) is a complex disease which affects 150 million people worldwide, with its prevalence expected to double by the year 2025.1 Current therapies do not achieve adequate glycaemic control2 and consequently there is an unmet need for therapeutic agents which deliver superior efficacy.Glucokinase (GK, also known as hexokinase IV or D) is expressed predominantly in the liver, pancreas, brain and gut where its function is to catalyze the conversion of glucose to glucose-6-phosphate. In both the liver, where the action of GK promotes glycogen synthesis, and the pancreas, where the action of GK results in glucose-sensitive insulin release,3GK is the rate limiting enzyme in glucose utilisation.4Activation of GK is therefore expected to improve glycaemic control by modulating hepatic glucose balance and decreasing the threshold for insulin secretion.5–7
Several groups have described small molecule glucokinase activators (GKAs) which act by binding to an allosteric site.8 We have described previously the identification and subsequent optimization of our own series of pyridine-5-carboxylic acid containing GKAs.9–11 In the preceding paper we described the modifications of this series that led to replacement of the pyridine-5-carboxylic acid motif, necessitated by the need to overcome testicular toxicology. This led us to neutral compounds such as GKA70 and GKA71 (Table 1).
| GKA70 | GKA71 | |
|---|---|---|
|
|
|
|
| GK EC50/μM | 0.06 | 0.11 |
| LogD | 3.2 | 2.9 |
| Solubility/μM | 20 | 129 |
| Caco-2 A to B Papp/nm s−1 | 540 | 290 |
| hERG IC50/μM | 6.9 | 7.5 |
| Rat Cl/mL min−1 kg−1 | 11 | 5.6 |
| Rat Vss/L kg−1 | 0.3 | 0.2 |
| Rat F (%) | 28 | 71 |
| Dog Cl/mL min−1 kg−1 | 7.2 | 0.5 |
| Dog Vss/L kg−1 | 0.8 | 0.3 |
| Dog F (%) | 11 | 56 |
| Rat OGTT AUC reduction | 29% at 10 mg kg−1 | 27% at 3 mg kg−1 |
Results and discussion
Considering the technical profiles of GKA70 and GKA71, perhaps the biggest concern was their hERG activity which, being below 10 μM in both cases, was potentially unacceptable for a chronic indication such as T2D.12 We therefore embarked on a medicinal chemistry campaign aimed at reducing hERG potency whilst maintaining or improving the other qualities of the compounds, in particular their potency and oral exposure. During this work we realised the value of matched molecular pair analysis13 as a means of assessing substructural changes in a rigorous manner during optimisation, particularly in optimising ligand lipophilicity efficiency (pEC50-logD).14 This revealed that, for example, switching from a methylthiadiazole to a methylpyrazole in the R1 position brought about little change in GK potency with a large reduction in logD (and hence a marked improvement in ligand lipophilicity efficiency) and a significant reduction in hERG potency. Similarly, modifying the R2 methylether to the corresponding alcohol also reduces logD with little impact on GK potency, but in this case with little effect on hERG potency. Switching the methylsulfone to an azetidine amide results in an increase in both potency and logD, with little impact on hERG (Table 2). Whilst overall individual parameters such as hERG potency are dependent on logD within this series, these analyses reveal more subtle substructural components to each which are essential to exploit in the search for the best overall compound within the series.15| Substructure transformationa,b | ΔpEC50 | ΔlogD | ΔpEC50-logD | ΔhERG pIC50 | ||
|---|---|---|---|---|---|---|
| a Raw data are shown in supporting information. b These key structural changes are outlined here to illustrate the principle, clearly as part of this campaign, many other changes, conservative and more diverse, were explored and analysed in this way with differing degrees of success. | ||||||

|
R1 |

|
−0.1 (n = 27) | −0.6 (n = 27) | 0.5 (n = 21) | −0.5 (n = 7) |
| R2 |

|
0.1 (n = 33) | −0.6 (n = 32) | 0.7 (n = 21) | −0.1 (n = 22) | |
| R4 |

|
0.3 (n = 20) | 0.2 (n = 23) | 0.1 (n = 16) | −0.3 (n = 19) | |
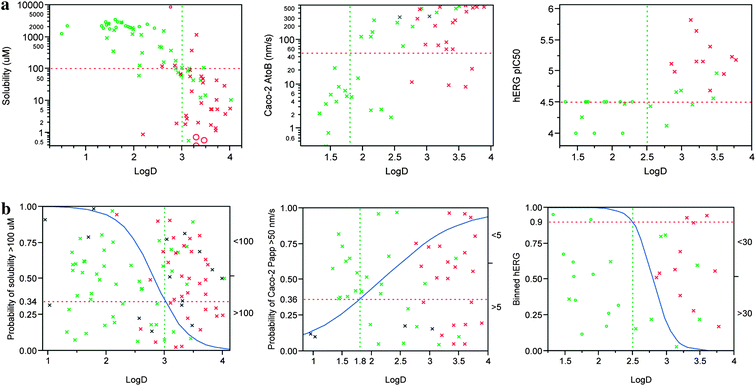
In a broad sense, this series shows an overall dependence on lipophilicity for many secondary properties. Solubility appears to be negatively correlated with logD and permeability (as measured by Caco-2 A to B flux) correlates positively (Fig. 1). In addition, despite the subtleties in structural changes outlined above, hERG potency also correlates positively with logD within this series. Notably, it is apparent within this plot that despite the relatively diminished difference on hERG activity per lipophilicity unit observed between thiadiazoles and pyrazoles in a matched pair sense, for a given lipophilicity the sulfur containing R1 heterocyclic (thiazole and thiadiazole) sub-series tends to be more hERG active than the pyrazoles.
 | ||
| Fig. 1 (a) x-y plots of solubility, Caco-2 A to B flux and hERG pIC50 against logD. Sulfur containing R1 heterocycles (thiazoles and thiadiazoles) are shown in red, pyrazoles are in green. Other R1 hetercycles are shown in grey. Points marked with circles are outside of the dynamic range of the y-data. The horizontal red dotted line marks the desired threshold value and the vertical green dotted line the likely logD limit required to achieve that threshold. (b) Logistic plots showing how probabilities of achieving solubility >100 μM and Caco-2 A to B flux >50 nm s−1 and hERG pIC50 < 4.5 change with logD. Sulfur containing R1 heterocycles (thiazoles and thiadiazoles) are shown in red, pyrazoles are in green. Other R1 hetercycles are shown in grey. Points marked with circles are outside of the dynamic range of the data. Points show the logD for each compound (x-coordinate) and are jittered in the y-direction to illustrate the populations of the two categories. The blue curve indicates the probability, the horizontal red line marks the probability of achieving the desired value of each parameter defined above at the selected logD limit. | ||
From these data, it is apparent that the chances of identifying a compound possessing the levels of solubility and permeability we deemed desirable for a drug candidate (defined here as 100 μM solubility and 50 nm s−1 for Caco-2 flux) can be significantly improved by targeting a logD range that is between 1.8 and 3. Achieving a hERG pIC50 below 4.5 would likely require a logD below 2.5 for an R1 pyrazole containing compound and is likely to be difficult to achieve at all for an R1 thiazole/thiadiazole without impinging on regions of logD for which permeability would be compromised. Hence, it becomes necessary that new compound synthesis is targeted at a narrow range of logD between 1.8 and 2.5. From a design perspective, this is very challenging since many structural changes, for instance some of those outlined (Table 2) bring about a change in logD comparable in magnitude to the size of this window. This range is also comparable to the error of even the best computational algorithms for lipophilicity calculation.15
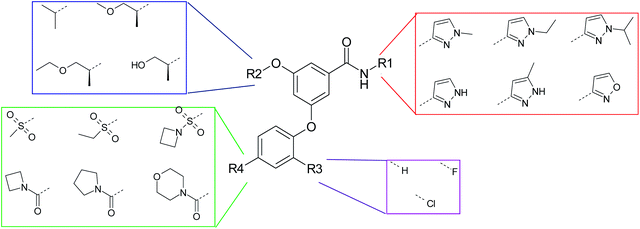
In order to address this, an entire matrix of virtual compounds consisting of four dimensions of substructural change that were either known, or postulated by analogy, to fulfil the requirements of glucokinase potency was enumerated computationally (Fig. 2). Crucially, the lipophilicity changes in these substructural inputs were minimised so as to allow the greatest number of possible combinations that target the optimum logD range. For each compound, lipophilicity was calculated using AstraZeneca's in house AZlogD algorithm.16 This method uses in house compounds, including those measured within the series in question, as the training set for the model and, as such, provided the most accurate means of predicting logD for these compounds, having a prediction error of 0.39 (see supporting information). Compounds with calculated logD values focused on the 1.8 to 2.5 range were then selected for synthesis.
 | ||
| Fig. 2 Representative substructures chosen for the enumerated matrix. | ||
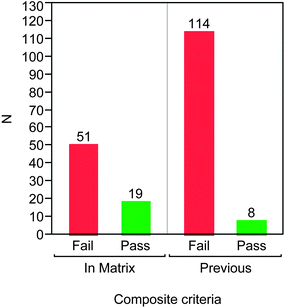
Having completed this selection, 70 compounds were made and profiled. As a measure of the success of this approach, each compound was assessed against three secondary screening parameters, notably solubility (>100 μM), hERG pIC50 (<4.5 μM) and rat oral AUC (nAUC > 0.5 μM h kg−1). Of the 70 compounds, 19 of them were found to surpass desirable values in these tests, representing a success rate of 27%. By comparison, of 112 representative previous compounds assessed in these assays from the same series, only 8 had been found to fulfil the same criteria (7%) (Fig. 3).
 | ||
| Fig. 3 Numbers of compounds passing solubility (>100 μM), hERG pIC50 (<4.5) and rat oral AUC (nAUC >0.5 μM h kg−1) tests for compounds within the matrix design compared to a representative set of previous compounds from the series. | ||
We believe that these findings vindicate the approach taken but they also left us contemplating why, in a chemical series having reached a reasonable level of maturity in terms of understanding of structure–activity and structure-property relationships, attrition rates were still so high. A partial explanation lies in the calculation of logD. Despite best efforts to achieve accurate calculation, some of the synthesis targets had measured logD values outside of the desirable range and these tended to show greater attrition. Nevertheless, significant attrition was still observed for those in the optimum range, highlighting the complex effects of multiple, small structural changes against multiple parameters. This means that, without screening, it is very difficult to predict the best overall compound within a narrow region of chemical space and for identification of an optimised clinical candidate, such an exercise as outlined above is likely to be necessary at the end of an optimisation campaign to ensure the best compound has been identified.
Through extensive profiling of the compounds identified by the above exercise, most notably in rat and dog pharmacokinetic studies, high fat-fed female Zucker rat oral glucose tolerance tests and solid state characterisation, GKA80 was identified as the most promising overall candidate for development within this set (Table 3). Other compounds were considered to be slightly inferior in one or more aspects for example compounds 1 and 2 showed increased clearance in the rat relative to GKA80 such that these compounds were considered less likely to achieve a suitable pharmacokinetic profile in humans.
| GKA80/AZD1092 | 1 | 2 | |
|---|---|---|---|
|
|
|
|
|
| GK EC50/μM | 0.03 | 0.04 | 0.05 |
| LogD | 1.8 | 1.7 | 1.8 |
| Solubility/μM | 350 | >1000 | 730 |
| Caco-2 A to B Papp/nm s−1 | 18 | 17 | 23 |
| hERG IC50/μM | 70 | >100 | >95 |
| Rat Cl/mL min−1 kg−1 | 14 | 31 | 34 |
| Rat Vss/L kg−1 | 1.8 | 1.9 | 1.1 |
| Rat F (%) | 30 | 78 | 27 |
| Dog Cl/mL min−1 kg−1 | 14 | Not tested | Not tested |
| Dog Vss/L kg−1 | 1.3 | Not tested | Not tested |
| Dog F (%) | 51 | Not tested | Not tested |
| Rat OGTT activity | 24% at 3 mg kg−1 | Not tested | Not tested |
GKA80 was selected for further development and was given the internal identifier AZD1092. AZD1092 exhibited dose dependent reduction of glucose excursion in oral glucose tolerance tests in high fat fed female Zucker rats17 and glucose lowering efficacy in free feeding glucose profiles in male Zucker rats (Fig. 4). The compound showed no major concerns in preclinical toxicology testing and hence was selected as a development candidate. Further results of our ongoing investigations in this area will be communicated in due course.
 | ||
| Fig. 4 Glucose lowering efficacy of GKA80/AZD1092. (a) Oral glucose tolerance test in high fat fed female Zucker rats – vehicle control is shown in grey, 1 mg kg-1 in red, 3 mg kg-1 in green, 10 mg kg-1 in blue. (b) Free feeding glucose profiles in male Zucker rats – vehicle control is shown in grey, 10 mg kg-1 in blue. | ||
Conclusions
In summary, we have shown that consideration of lipophilicity and potency provides a means to optimise compounds in this series to provide compounds suitable for consideration as clinical candidates. The use of matrix based enumeration in conjunction with molecular design provides a way of maximising the chances of success within a tight window of optimum lipophilicity and minimises attrition in secondary screening.Acknowledgements
This research was sponsored by AstraZeneca. All authors were AstraZeneca employees at the time of the conduct of the research. The authors thank the wider project team for synthesis and testing of the compounds.Notes and references
- M. Tadayyon and S. A. Smith, Expert Opin. Invest. Drugs, 2003, 12, 307 CrossRef CAS.
- R. C. Turner, C. A. Cull, V. Frighi and R. Holmann, JAMA, J. Am. Med. Assoc., 1999, 281, 2005 CrossRef CAS.
- F. M. Matschinsky, Diabetes, 2002, 51, S394 CrossRef CAS.
- F. M. Matschinsky, M. A. Magnuson, in Frontiers in Diabetes, ed. F. M. Matschinsky, M. A. Magnuson, Karger, Basel, 2004.vol. 16, pp. 1–17 Search PubMed.
- A. Gloyn, S. Odili, D. Zelent, C. Buettger, H. A. Castleden, A. M. Steele, A. Stride, C. Shiota, M. A. Magnuson, R. Lorini, G. d'Annunzio, C. A. Stanley, J. Kwagh, E. van Schaftingen, M. Veigha da Cunha, F. Barbetti, P. Dunten, Y. Han, J. Grimsby, R. Taub, S. Ellard, A. T. Hattersley and F. M. Matschinsky, J. Biol. Chem., 2005, 280, 14105 CrossRef CAS.
- B. Leighton, A. Atkinson and M. P. Coghlan, Biochem. Soc. Trans., 2005, 33, 371 CrossRef CAS.
- D. Zelent, H. Najafi, S. Odili, C. Buettger, H. Weik-Collins, C. Li, N. Doliba, J. Grimsby and F. M. Matschinsky, Biochem. Soc. Trans., 2005, 33, 306 CrossRef CAS.
- For comprehensive reviews of GKAs see: M. C. T. Fyfe and M. P. Procter, Drugs of the Future, 2009, 34, 641 Search PubMed; F. M. Matschinsky, Nat. Rev. Drug Discovery, 2009, 8, 399 CrossRef CAS; M. Coghlan and B. Leighton, Expert Opin. Invest. Drugs, 2008, 17, 145 CrossRef.
- D. McKerrecher, J. V. Allen, S. Bowker, S. Boyd, P. W. R. Caulkett, G. S. Currie, C. D. Davies, M. L. Fenwick, H. Gaskin, E. Grange, R. B. Hargreaves, B. R. Hayter, R. James, K. M. Johnson, C. Johnstone, C. D. Jones, S. Lackie, J. W. Rayner and R. P. Walker, Bioorg. Med. Chem. Lett., 2005, 15, 2103 CrossRef CAS.
- D. McKerrecher, J. V. Allen, P. W. R. Caulkett, P. C. S. Donald, M. L. Fenwick, E. Grange, K. M. Johnson, C. Johnstone, C. D. Jones, J. W. Rayner and R. P. Walker, Bioorg. Med. Chem. Lett., 2006, 16, 2705 CrossRef CAS.
- K. G. Pike, J. V. Allen, P. W. R. Caulkett, D. S. Clarke, C. S. Donald, M. L. Fenwick, K. M. Johnson, C. Johnstone, D. McKerrecher, J. W. Rayner, R. P. Walker and I. Wilson, Bioorg. Med. Chem. Lett., 2011, 21, 3467 CrossRef CAS.
- W. S. Redfern, L. Carlsson, A. S. Davis, W. G. Lynch, I. MacKenzie, S. Palethorpe, P. K. S. Siegl, I. Strang, A. T. Sullivan, R. Wallis, A. J. Camm and T. G. Hammond., Cardiovasc. Res., 2003, 58, 32 CrossRef CAS.
- A. G. Leach, H. D. Jones, D. A. Cosgrove, P. W. Kenny, L. Ruston, P. MacFaul, J. M. Wood, N. Colclough and B. Law, J. Med. Chem., 2006, 49, 6672 CrossRef CAS.
- A. L. Hopkins, C. R. Groom and A. Alex, Drug Discovery Today, 2004, 9, 430 CrossRef.
- M. J. Waring, Expert Opin. Drug Discovery, 2010, 5, 235 CrossRef CAS.
- P. Bruneau and N. R. McElroy, J. Chem. Inf. Model., 2006, 46, 1379 CrossRef CAS.
- G. Coope, A. M. Atkinson, C. Allott, D. McKerrecher, C. Johnstone, K. G. Pike, K. G. P. C Holme, H. Vertigan, D. Gill, M. P. Coghlan and B., Br. J. Pharmacol., 2006, 149, 328 CrossRef CAS.
Footnotes |
| † Electronic supplementary information (ESI) available: References to experimental protocols, matched pair plots and raw data for those summarised in Table 2, a list of SMILES strings for the 70 compounds made within the matrix, distributions of their associated data and synthetic details for the synthesis of GKA80/AZD1092. See DOI: 10.1039/c1md00092f |
| ‡ Statistical analyses were carried out using SAS JMP (http://www.jmp.com). |
| This journal is © The Royal Society of Chemistry 2011 |


