Identification of CYP1A2 ligands by structure-based and ligand-based virtual screening†
Poongavanam
Vasanthanathan
a,
Jeroen
Lastdrager
b,
Chris
Oostenbrink
bc,
Jan N. M.
Commandeur
b,
Nico P. E.
Vermeulen
b,
Flemming S.
Jørgensen
a and
Lars
Olsen
*a
aFaculty of Pharmaceutical Sciences, Department of Medicinal Chemistry, University of Copenhagen, Universitetsparken 2, 2100, Copenhagen, Denmark. E-mail: lo@farma.ku.dk; Fax: +35-33-60-40
bLeiden–Amsterdam Center for Drug Research, Section of Molecular Toxicology, Department of Chemistry and Pharmacochemistry, Vrije Universiteit, De Boelelaan 1083, 1081 HV, Amsterdam, The Netherlands
cInstitute of Molecular Modeling and Simulation, University of Natural Resources and Life Sciences, Muthgasse 18, A-1190, Vienna, Austria
First published on 19th July 2011
Abstract
The metabolic enzyme cytochrome P450 1A2 (CYP1A2) attracts much attention, not only because of its metabolism of drug compounds, but also due to its ability to convert procarcinogens to carcinogens. From a virtual screening, 41 compounds were selected and tested experimentally for inhibition of CYP1A2. Among these compounds, 16 inhibited the CYP1A2 activity by more than 50% at a concentration of 0.3 μM. The three most potent inhibitors have IC50 values of 20 nM. These inhibitors contain new scaffolds and may serve as starting points for further lead optimization. Thus, the applied virtual screening methods are useful for considering CYP1A2 inhibition, either to identify inhibitors of CYP1A2, e.g. for cancer therapy, or to identify undesirable inhibitory effects of the enzyme.
Introduction
The cytochrome P450s (CYP) form an ubiquitous family of enzymes that play an important role in the Phase I metabolism where biotransformation of drugs and xenobiotic compounds takes place. CYPs generally make these compounds more soluble and thus, more easily excreted, but may also convert a prodrug into its active form, which is of importance in drug delivery.1–4 About 70–80% of the Phase I metabolism of currently marketed drugs is mediated by CYP enzymes.5,6 The most important CYP isoforms involved in this metabolism are CYP1A2, CYP2C9, CYP2C19, CYP2D6, and CYP3A4.3,6,7CYP1A2 constitutes about 13% of the total CYP content in the liver and is involved in metabolic clearance of several drug compounds and carcinogens, and activation of certain drug compounds.8–10 However, its activity has also been linked to different types of cancer, such as breast and colon cancer.11,12Although the number of drug candidate failures due to poor pharmacokinetic properties and toxicity have been reduced over the past years,13 there is still a need for improvement. One key to this could be a better understanding and prediction of CYP metabolism. This may be facilitated by the recent advances in the development of in silico methods to predict CYP metabolism,14–17e.g. predicting sites of metabolism15,18–22 or binding to the enzyme.23–28 The reasons for these advances are most likely the increasing amount of experimental CYP metabolism data, e.g. binding affinities from high-throughput screening assays in the PubChem project,29 and crystal structures,30–39 which are crucial for developing and validating the quality of the in silico models.
Ligand- and structure-based in silico approaches are extensively utilized to identify new ligands with affinity for a wide range of protein targets. CYPs, on the other hand, are often considered to be anti-targets rather than targets, and therefore, the in silico methods may be used to identify and remove compounds with affinity for the CYP enzyme. However, in the particular case of the CYP1A2 enzyme, it may also be considered a traditional target because of its potential involvement in cancer.11,12
We have previously used ligand-based and structure-based approaches to classify whether or not a compound is a CYP1A2 inhibitor. In a previous ligand-based study, a variety of machine learning methods were developed, the best one having an accuracy of 76% on an external test set containing about 7000 compounds.27 Using a structure-based docking approach, it was shown that about 61% of the inhibitors and 68% of the non-inhibitors could be classified correctly.40
Since the ligand-based and structure-based approaches are fundamentally different, we have in the present study used both virtual screening approaches to identify CYP1A2 ligands from a large compound library. The best ranked compounds from both searches have been selected for subsequent in vitro testing. Finally, the quality of the two types of in silico models is compared on the basis of the experimental results.
Results and discussion
Two previously developed and validated ligand- and structure-based models27,40 were used to screen a subset of the ZINC database for CYP1A2 inhibitors. In total, 19![[thin space (1/6-em)]](https://www.rsc.org/images/entities/char_2009.gif) 997 ZINC entries of 16
997 ZINC entries of 16![[thin space (1/6-em)]](https://www.rsc.org/images/entities/char_2009.gif) 338 compounds were screened. The difference in the number of entries and unique compounds is due to the fact that some compounds have several possible protonation states and chiral atoms. For compounds with more than one entry, the one with the best score, either random forest probability from the ligand-based screening or ChemScore from the structure-based screening, was kept.
338 compounds were screened. The difference in the number of entries and unique compounds is due to the fact that some compounds have several possible protonation states and chiral atoms. For compounds with more than one entry, the one with the best score, either random forest probability from the ligand-based screening or ChemScore from the structure-based screening, was kept.
Ligand-based virtual screening using the random forest method
First, the ligand-based model developed with the random forest method with a combination of Volsurf and MOE descriptors was used for the virtual screening of the database. 66% of the compounds in the database were predicted as inhibitors (with a probability of 50–100%) and 34% as non-inhibitors (with a probability of 0–50%). Of the 66% active compounds, 666 compounds (4% of the compounds) were predicted to be inhibitors of CYP1A2 with a probability of 100%. In an earlier study, it was shown that predictions of compounds with a probability of 100% are more certain, with respect to predicting inhibition.27 Out of the 666 predicted inhibitors, a set of 50 compounds was randomly selected for experimental testing. However, only 19 of them were available from the vendor (compounds A–S, see Fig. S1†).Structure-based virtual screening using ChemScore
Next, the 19![[thin space (1/6-em)]](https://www.rsc.org/images/entities/char_2009.gif) 997 entries in the database were docked into the CYP1A2 active site using the ChemScore scoring function41,42 with the same settings as in our previous work.40 For a few compounds, the docking failed, resulting in a total of 16
997 entries in the database were docked into the CYP1A2 active site using the ChemScore scoring function41,42 with the same settings as in our previous work.40 For a few compounds, the docking failed, resulting in a total of 16![[thin space (1/6-em)]](https://www.rsc.org/images/entities/char_2009.gif) 330 compounds that were successfully docked. The obtained score values were in the range of −38.54 to 48.42. As shown earlier, compounds with a score being larger than 22.2 are more likely to be inhibitors.40 This corresponds to 60% of the database being predicted as being likely inhibitors of CYP1A2. However, it was also shown that most of the inhibitors being incorrectly classified as non-inhibitors are found in the score range of about 10–22.2.40 Thus, a few compounds in that range were also selected, in addition to those with scores larger than 22.2. In total, a set of 50 compounds was selected for experimental testing, of which 22 were available from the vendor (compounds T–AO, see Fig. S1†).
330 compounds that were successfully docked. The obtained score values were in the range of −38.54 to 48.42. As shown earlier, compounds with a score being larger than 22.2 are more likely to be inhibitors.40 This corresponds to 60% of the database being predicted as being likely inhibitors of CYP1A2. However, it was also shown that most of the inhibitors being incorrectly classified as non-inhibitors are found in the score range of about 10–22.2.40 Thus, a few compounds in that range were also selected, in addition to those with scores larger than 22.2. In total, a set of 50 compounds was selected for experimental testing, of which 22 were available from the vendor (compounds T–AO, see Fig. S1†).
Experimental test of CYP1A2 inhibition
In total, 41 compounds selected from the two virtual screenings were tested for CYP1A2 inhibition. The initial in vitro screening was conducted using single point concentrations of 30, 3, and 0.3 μM of the inhibitors (see Table S1†). At 0.3 μM, 16 compounds still inhibited CYP1A2 by more than 50% and 6 compounds by more than 90% (see Fig. 1 or Table S1†).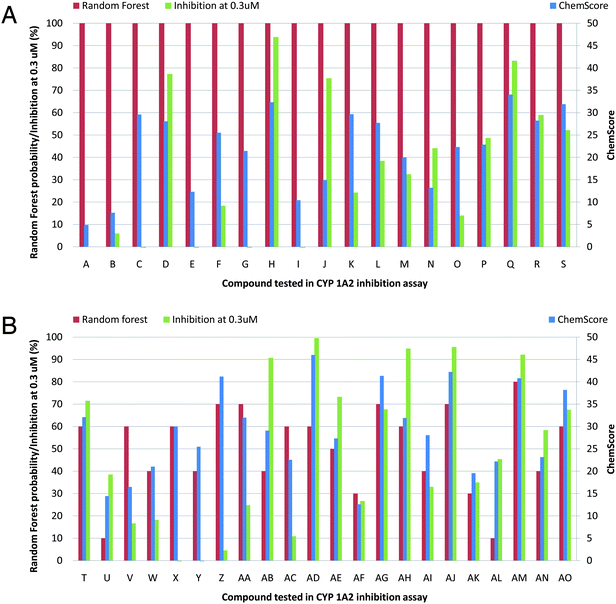 | ||
| Fig. 1 Random forest probabilities, ChemScore values, and percent inhibition of CYP1A2 for the 41 tested compounds (A–AO) at a concentration of 0.3 μM. | ||
The IC50 values of the compounds that inhibited the CYP1A2 activity most at a concentration of 0.3 μM were determined (see Table 1 and Fig. 2). These had IC50 values in the range of 20–200 nM. The three best compounds, AD, AJ, and AM, had IC50 values around 20 nM. This is the same as the well-known CYP1A2 inhibitor, α-naphthoflavone (αNF). With a ChemScore value of 46.9, αNF was found among the top 10 scoring compounds in the docking experiment, and was included in the experiments as the reference value.
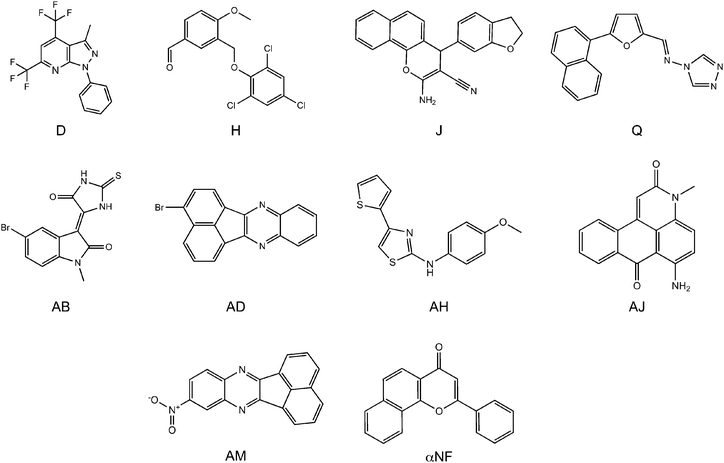 | ||
| Fig. 2 The most potent inhibitors at a concentration of 0.3 μM. Compounds D, H, J, and Q were selected from the ligand-based screening, and compounds AB, AD, AH, AJ, and AM were selected from the structure-based screening. | ||
Binding mode of inhibitors
A substructure search in the PubChem database of CYP1A2 inhibitors revealed that the identified inhibitors represent new CYP1A2 scaffolds (see Table S2† for further details). Only in a few cases, some distantly related CYP1A2 inhibitors were identified. For example fluoxetine, a well-known CYP1A2 substrate, also contains the benzyloxybenzene fragment, but has very different substituents. Otherwise, the identified high affinity compounds are relatively flat, rigid and lipophilic which reflects the nature of the binding pocket of the enzyme. Fig. 3 shows the binding mode of αNF in CYP1A2.34 As seen from the van der Waals surface (determined with the C3 probe in GRID), αNF makes several favorable contacts in the active site of the enzyme. Moreover, the polyaromatic moiety interacts with a hydrophobic region defined by the phenylalanine cluster defined by Phe226, Phe256, and Phe260, and a water molecule bridges the enzyme and the carbonyl oxygen of αNF.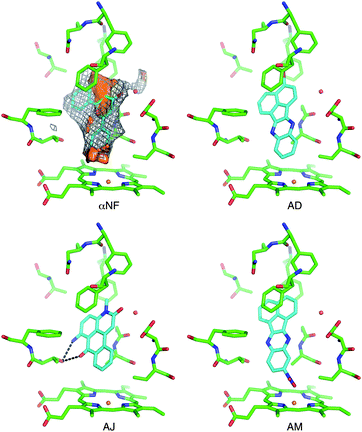 | ||
| Fig. 3 The active site of CYP1A2 with α-naphthoflavone (αNF) in the active site as observed in the X-ray structure, characterized with molecular interaction fields. Shown are isosurfaces of the DRY probe (brown surface at −1 kcal mol−1), C3 probe (grey mesh at −2 kcal mol−1), and oxygen acceptor probe (red surface energy level at −5 kcal mol−1). Docking poses of compounds AD, AJ, and AM are also shown. Ligands are shown with cyan C atoms. The water molecule was not included in the dockings. | ||
The docked conformations of the best inhibitors, i.e. compounds AD, AJ, and AM, all have similar interactions with the phenylalanine cluster (Fig. 3). Moreover, compound AJ also has a carbonyl oxygen in the same position as αNF, although the water molecule was not included in the docking.40 Some of the other inhibitors have chemical groups that seem to interact directly with the heme group, e.g. the nitro group in compound AM and the 1,2,4-triazole ring in compound Q. The latter type of interaction between an aromatic nitrogen and the heme group is well known and has been observed previously for inhibitors of other human CYPs, e.g.CYP2A6 and CYP3A4.37,43
Comparison of random forest and docking methods
A principal component analysis of the 19![[thin space (1/6-em)]](https://www.rsc.org/images/entities/char_2009.gif) 997 entries in ZINC was performed with already known CYP1A2 substrates projected onto this (see Fig. 4). The figure shows that the known CYP1A2 ligands primarily are located in the upper-right part of the score plot, reflecting that they are hydrophobic in nature (cf. the loadings plot, Fig. 4). The compounds selected from the ligand-based virtual screening seem to be more similar to the known CYP1A2 ligands than those obtained from the structure-based method. This is probably due to the fact that the ligand-based model was trained using known CYP1A2 ligands, and therefore identifies similar compounds. No such training is done with the structure-based method.
997 entries in ZINC was performed with already known CYP1A2 substrates projected onto this (see Fig. 4). The figure shows that the known CYP1A2 ligands primarily are located in the upper-right part of the score plot, reflecting that they are hydrophobic in nature (cf. the loadings plot, Fig. 4). The compounds selected from the ligand-based virtual screening seem to be more similar to the known CYP1A2 ligands than those obtained from the structure-based method. This is probably due to the fact that the ligand-based model was trained using known CYP1A2 ligands, and therefore identifies similar compounds. No such training is done with the structure-based method.
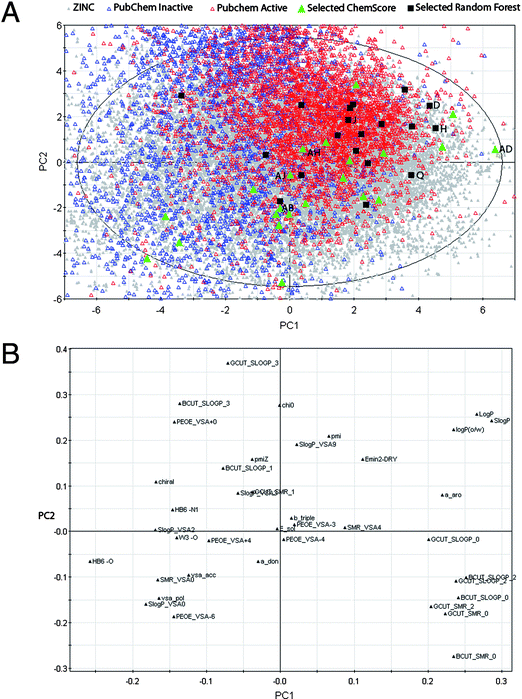 | ||
Fig. 4 Score plot (top) and loadings plot (bottom) from principal component analysis (two first of seven principal components (PCs) shown (R2 = 0.67, Q2 = 0.40)) of the 19![[thin space (1/6-em)]](https://www.rsc.org/images/entities/char_2009.gif) 997 entries extracted from the ZINC database (in grey). The experimentally tested compounds selected by the ligand-based random forest method (19 compounds) and the structure-based docking method (22 compounds) are colored black and green, respectively. Other known CYP1A2 inhibitors/non-inhibitors from PubChem are shown with open red/blue triangles, respectively. The tested compounds with best IC50 values are shown. 997 entries extracted from the ZINC database (in grey). The experimentally tested compounds selected by the ligand-based random forest method (19 compounds) and the structure-based docking method (22 compounds) are colored black and green, respectively. Other known CYP1A2 inhibitors/non-inhibitors from PubChem are shown with open red/blue triangles, respectively. The tested compounds with best IC50 values are shown. | ||
Fig. 5 shows the frequency distribution of the ChemScore values for the entries that are predicted as inhibitors and non-inhibitors of CYP1A2 with the random forest method. The majority of entries predicted as inhibitors with ChemScore are also predicted as inhibitors with the random forest method (8294 out of 11![[thin space (1/6-em)]](https://www.rsc.org/images/entities/char_2009.gif) 821 corresponding to 70%, see the caption of Fig. 5). Out of the 8085 entries predicted as non-inhibitors with ChemScore, 4096 were also predicted as non-inhibitors with the random forest method (51% agreement between the two virtual screening methods).
821 corresponding to 70%, see the caption of Fig. 5). Out of the 8085 entries predicted as non-inhibitors with ChemScore, 4096 were also predicted as non-inhibitors with the random forest method (51% agreement between the two virtual screening methods).
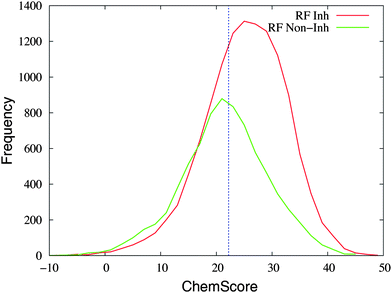 | ||
| Fig. 5 The distribution of ChemScore values of the entries in the database that are predicted as inhibitors (“RF Inh”, in red) or non-inhibitors (“RF Non-Inh”, in green) with the random forest method. An entry was predicted as an inhibitor with the random forest method if the probability was ≥50%. The line at a value of 22.2 in ChemScore indicates the threshold used for considering a compound as an inhibitor with ChemScore. In total, 4096 and 8294 entries are classified as non-inhibitors and inhibitors by both methods, respectively; 3527 entries are predicted as inhibitors by ChemScore and non-inhibitors by the random forest method; 3989 entries are predicted as non-inhibitors by ChemScore and inhibitors by the random forest method. | ||
We have identified 16 compounds that inhibit the activity of the enzyme with more than 50% at a concentration of 0.3 μM (cf.Tables 1 and S1†). Of these, the majority (13 compounds) are predicted as inhibitors with both random forest and ChemScore. Considering only the ability of ChemScore to predict the experimental outcome (inhibition of the activity of CYP1A2 by more than 50% at a concentration of 0.3 μM), it correctly predicts that 15 compounds are inhibitors out of a total of 27 that were predicted as inhibitors (56%, Table 2). With the random forest method, a slightly larger number of compounds (32 compounds) are predicted as inhibitors but fewer (14 compounds, 44%) are verified as being inhibitors. Notably, if using 50% inhibition at a concentration of 3 μM as threshold for inhibition/non-inhibition, there is almost no difference between the random forest and ChemScore methods. This could be due to the fact that the random forest model has been trained on a set of compounds where an active compound is defined as inhibiting CYP1A2 with an affinity better than 40 μM, i.e. not a particularly high affinity.
| Number of compounds | Predicted with | Verified experimentally | Correctly predicted with | ||||
|---|---|---|---|---|---|---|---|
| Random forest | ChemScore | Both methods | IC50 < 0.3 μM | Random forest | ChemScore | Both methods | |
| Inhibitor | 32 | 27 | 23 | 16 | 14 | 15 | 13 |
| Non-inhibitor | 9 | 14 | 5 | 25 | 7 | 13 | 5 |
| Total | 41 | 41 | 28 | 41 | 21 | 28 | 18 |
The three best inhibitors having IC50 values of about 20 nM were predicted as inhibitors of CYP1A2 with both methods, having very high ChemScore values of more than 40, whereas the random forest probabilities are in the range of 60–80% (Fig. 2 and Table S1†). Thus, with ChemScore it seems to be possible to identify high affinity inhibitors. With the random forest method, on the other hand, it has previously been shown that a more certain classification of inhibitors with affinities lower than 40 μM was obtained using probabilities of 100%, but as shown here, this does not necessarily lead to high affinity inhibitors. That is, our experience from this study shows that in future studies aiming at identifying CYP1A2 ligands, the selection of potential CYP1A2 ligands could be done a bit differently. It could be sufficient to apply docking and select the compounds with best scores to identify potent inhibitors, or if applying the random forest model, to select predicted inhibitors with lower probabilities than 100%.
As mentioned previously, it is also of interest to consider CYP1A2 as a non-target, i.e. to identify the non-inhibitors correctly. ChemScore correctly predicts 13 out of a total of 14 predicted non-inhibitors and 25 experimentally verified non-inhibitors (52%) (see Table 2). Again, this is slightly worse with the random forest method that only predicts 7 of the non-inhibitors correctly. Thus, the restrictions induced by the enzyme preventing binding seem to be better included when explicitly considering the enzyme rather than only the descriptor space.
Although the random forest method seems to have a slightly worse ability to predict the inhibitors and non-inhibitors than ChemScore for this set of 41 compounds, it still has surprisingly good performance. Since only 39 two-dimensional physicochemical properties of each compound need to be calculated to use the random forest-based virtual screening method, it could be useful for quickly searching large compound databases.
Conclusion
Using two different types of virtual screening methods, one based on the random forest method and the other on the ChemScore scoring function, a database consisting of 16![[thin space (1/6-em)]](https://www.rsc.org/images/entities/char_2009.gif) 338 compounds was screened for CYP1A2 inhibitors and 41 compounds were selected for subsequent experimental testing. Among these compounds, 16 inhibited the CYP1A2 activity by more than 50% at a concentration of 0.3 μM. The 9 most active compounds bind with an IC50 value of less than 250 nM to CYP1A2 and the three best inhibitors have affinities in the same range as α-naphthoflavone (IC50 ≈ 20 nM). A comparison of the outcomes from the two virtual screening methods shows that the structure-based method identifies more inhibitors, which are furthermore more potent as well. Moreover, the prediction rate of the non-inhibitors is better for the structure-based method. Thus, the structure-based method seems well-suited either when considering CYP1A2 as a classical drug target or a non-target. This is relevant for identification of inhibitors of CYP1A2, e.g. for cancer therapy or chemo-prevention, or to avoid other, undesirable, inhibitory effects of the enzyme, e.g. in drug–drug interactions.
338 compounds was screened for CYP1A2 inhibitors and 41 compounds were selected for subsequent experimental testing. Among these compounds, 16 inhibited the CYP1A2 activity by more than 50% at a concentration of 0.3 μM. The 9 most active compounds bind with an IC50 value of less than 250 nM to CYP1A2 and the three best inhibitors have affinities in the same range as α-naphthoflavone (IC50 ≈ 20 nM). A comparison of the outcomes from the two virtual screening methods shows that the structure-based method identifies more inhibitors, which are furthermore more potent as well. Moreover, the prediction rate of the non-inhibitors is better for the structure-based method. Thus, the structure-based method seems well-suited either when considering CYP1A2 as a classical drug target or a non-target. This is relevant for identification of inhibitors of CYP1A2, e.g. for cancer therapy or chemo-prevention, or to avoid other, undesirable, inhibitory effects of the enzyme, e.g. in drug–drug interactions.
Acknowledgements
P.V. gratefully acknowledges the financial assistance provided by the Drug Research Academy. L.O. is grateful for support from the Danish Medical Research Council. C.O. thanks the Vienna Science and Technology Fund for financial support. Michael Kranendonk is thanked for providing the CYP1A2 plasmid and Olivier Taboreau for valuable commentsNotes and references
- F. P. Guengerich, A malleable catalyst dominates the metabolism of drugs, Proc. Natl. Acad. Sci. U. S. A., 2006, 103, 13565–13566 CrossRef CAS.
- F. P. Guengerich, Cytochrome P450 and chemical toxicology, Chem. Res. Toxicol., 2008, 21, 70–83 CrossRef CAS.
- D. W. Nebert and D. W. Russell, Clinical importance of the cytochromes P450, Lancet, 2002, 360, 1155–1162 CrossRef CAS.
- R. Ortiz de Montellano, Cytochrome P450: Structure, Mechanism, and Biochemistry, Kluwer Academic/Plenum Publishers, New York, 2005 Search PubMed.
- L. C. Wienkers and T. G. Heath, Predicting in vivo drug interactions from in vitro drug discovery data, Nat. Rev. Drug Discovery, 2005, 4, 825–833 CrossRef CAS.
- J. A. Williams, R. Hyland, B. C. Jones, D. A. Smith, S. Hurst, T. C. Goosen, V. Peterkin, J. R. Koup and S. E. Ball, Drug–drug interactions for UDP-glucuronosyltransferase substrates: a pharmacokinetic explanation for typically observed low exposure (AUCi/AUC) ratios, Drug Metab. Dispos., 2004, 32, 1201–1208 CrossRef CAS.
- M. Pirmohamed and B. K. Park, Cytochrome P450 enzyme polymorphisms and adverse drug reactions, Toxicology, 2003, 192, 23–32 CrossRef CAS.
- D. Kim and F. P. Guengerich, Cytochrome P450 activation of arylamines and heterocyclic amines, Annu. Rev. Pharmacol., 2005, 45, 27–49 CrossRef CAS.
- T. Shimada, H. Yamazaki, M. Mimura, Y. Inui and F. P. Guengerich, Interindividual variations in human liver cytochrome P-450 enzymes involved in the oxidation of drugs, carcinogens and toxic chemicals: studies with liver microsomes of 30 Japanese and 30 Caucasians, J. Pharmacol. Exp. Ther., 1994, 270, 414–423 CAS.
- L. H. Patterson and G. I. Murray, Tumour cytochrome P450 and drug activation, Curr. Pharm. Des., 2002, 8, 1335–1347 CrossRef CAS.
- C. C. Hong, B. K. Tang, G. Hammond, D. Tritchler, M. Yaffe and N. Boyd, Cytochrome P450 1A2 (CYP1A2) activity and risk factors for breast cancer: a cross-sectional study, Breast Cancer Res., 2004, 6, R352–R365 CrossRef.
- A. Seow, B. Zhao, E. J. Lee, W. T. Poh, M. Teh, P. Eng, Y. T. Wang, W. C. Tan and H. P. Lee, Cytochrome P4501A2 (CYP1A2) activity and lung cancer risk: a preliminary study among Chinese women in Singapore, Carcinogenesis, 2001, 22, 673–677 CrossRef CAS.
- I. Kola and J. Landis, Can the pharmaceutical industry reduce attrition rates?, Nat. Rev. Drug Discovery, 2004, 3, 711–715 CrossRef CAS.
- L. Afzelius, C. H. Arnby, A. Broo, L. Carlsson, C. Isaksson, U. Jurva, B. Kjellander, K. Kolmodin, K. Nilsson, F. Raubacher and L. Weidolf, State-of-the-art tools for computational site of metabolism predictions: comparative analysis, mechanistical insights, and future applications, Drug Metab. Rev., 2007, 39, 61–86 CrossRef CAS.
- G. Cruciani, E. Carosati, B. B. De, K. Ethirajulu, C. Mackie, T. Howe and R. Vianello, MetaSite: understanding metabolism in human cytochromes from the perspective of the chemist, J. Med. Chem., 2005, 48, 6970–6979 CrossRef CAS.
- E. Stjernschantz, N. P. Vermeulen and C. Oostenbrink, Computational prediction of drug binding and rationalisation of selectivity towards cytochromes P450, Expert Opin. Drug Metab. Toxicol., 2008, 4, 513–527 CrossRef CAS.
- P. Czodrowski, J. M. Kriegl, S. Scheuerer and T. Fox, Computational approaches to predict drug metabolism, Expert Opin. Drug Metab. Toxicol., 2009, 5, 15–27 CrossRef CAS.
- M. Hennemann, A. Friedl, M. Lobell, J. Keldenich, A. Hillisch, T. Clark and A. H. Goller, CypScore: quantitative prediction of reactivity toward cytochromes P450 based on semiempirical molecular orbital theory, ChemMedChem, 2009, 4, 657–669 CrossRef CAS.
- P. Rydberg, D. E. Gloriam, J. Zaretzki, C. Breneman and L. Olsen, SMARTCyp: a 2D method for prediction of cytochrome P450-mediated drug metabolism, ACS Med. Chem. Lett., 2010, 1, 96–100 CrossRef CAS.
- R. P. Sheridan, K. R. Korzekwa, R. A. Torres and M. J. Walker, Empirical regioselectivity models for human cytochromes P450 3A4, 2D6, and 2C9, J. Med. Chem., 2007, 50, 3173–3184 CrossRef CAS.
- S. B. Singh, L. Q. Shen, M. J. Walker and R. P. A. Sheridan, Model for predicting likely sites of CYP3A4-mediated metabolism on drug-like molecules, J. Med. Chem., 2003, 46, 1330–1336 CrossRef CAS.
- P. Rydberg, D. E. Gloriam and L. Olsen, The SMARTCyp cytochrome P450 metabolism prediction server, Bioinformatics, 2010, 26, 2988–2989 CrossRef CAS.
- J. M. Kriegl, L. Eriksson, T. Arnhold, B. Beck, E. Johansson and T. Fox, Multivariate modeling of cytochrome P450 3A4 inhibition, Eur. J. Pharm. Sci., 2005, 24, 451–463 CrossRef CAS.
- J. M. Kriegl, T. Arnhold, B. Beck and T. Fox, Prediction of human cytochrome P450 inhibition using support vector machines, QSAR Comb. Sci., 2005, 24, 491–502 CAS.
- L. Afzelius, I. Zamora, M. Ridderström, T. B. Andersson, A. Karlén and C. M. Masimirembwa, Competitive CYP2C9 inhibitors: enzyme inhibition studies, protein homology modeling, and three-dimensional quantitative structure–activity relationship analysis, Mol. Pharmacol., 2001, 59, 909–919 CAS.
- L. Terfloth, B. Bienfait and J. Gasteiger, Ligand-based models for the isoform specificity of cytochrome P450 3A4, 2D6, and 2C9 substrates, J. Chem. Inf. Model., 2007, 47, 1688–1701 CrossRef CAS.
- P. Vasanthanathan, O. Taboureau, C. Oostenbrink, N. P. Vermeulen, L. Olsen and F. S. Jørgensen, Classification of cytochrome P450 1A2 inhibitors and noninhibitors by machine learning techniques, Drug Metab. Dispos., 2009, 37, 658–664 CrossRef CAS.
- D. Zhou, R. Liu, S. A. Otmani, S. W. Grimm, R. J. Zauhar and I. Zamora, Rapid classification of CYP3A4 inhibition potential using support vector machine approach, Lett. Drug Des. Discovery, 2007, 4, 192–200 CrossRef CAS.
- PubChem bioassay website, http://pubchem.%20ncbi.%20nlm.%20nih.%20gov/, accessed August 2009.
- M. Ekroos and T. Sjogren, Structural basis for ligand promiscuity in cytochrome P450 3A4, Proc. Natl. Acad. Sci. U. S. A., 2006, 103, 13682–13687 CrossRef CAS.
- P. R. Porubsky, K. M. Meneely and E. E. Scott, Structures of human cytochrome P-450 2E1. Insights into the binding of inhibitors and both small molecular weight and fatty acid substrates, J. Biol. Chem., 2008, 283, 33698–33707 CrossRef CAS.
- P. R. Porubsky, K. P. Battaile and E. E. Scott, Human cytochrome P450 2E1 structures with fatty acid analogs reveal a previously unobserved binding mode, J. Biol. Chem., 2010, 285, 22282–22290 CrossRef CAS.
- P. Rowland, F. E. Blaney, M. G. Smyth, J. J. Jones, V. R. Leydon, A. K. Oxbrow, C. J. Lewis, M. G. Tennant, S. Modi, D. S. Eggleston, R. J. Chenery and A. M. Bridges, Crystal structure of human cytochrome P450 2D6, J. Biol. Chem., 2006, 281, 7614–7622 CrossRef CAS.
- S. Sansen, J. K. Yano, R. L. Reynald, G. A. Schoch, K. J. Griffin, C. D. Stout and E. F. Johnson, Adaptations for the oxidation of polycyclic aromatic hydrocarbons exhibited by the structure of human P450 1A2, J. Biol. Chem., 2007, 282, 14348–14355 CrossRef CAS.
- M. R. Wester, J. K. Yano, G. A. Schoch, C. Yang, K. J. Griffin, C. D. Stout and E. F. Johnson, The structure of human cytochrome P450 2C9 complexed with flurbiprofen at 2.0-A resolution, J. Biol. Chem., 2004, 279, 35630–35637 CrossRef CAS.
- P. A. Williams, J. Cosme, A. Ward, H. C. Angove, V. D. Matak and H. Jhoti, Crystal structure of human cytochrome P450 2C9 with bound warfarin, Nature, 2003, 424, 464–468 CrossRef CAS.
- P. A. Williams, J. Cosme, D. M. Vinkovic, A. Ward, H. C. Angove, P. J. Day, C. Vonrhein, I. J. Tickle and H. Jhoti, Crystal structures of human cytochrome P450 3A4 bound to metyrapone and progesterone, Science, 2004, 305, 683–686 CrossRef CAS.
- J. K. Yano, M. R. Wester, G. A. Schoch, K. J. Griffin, C. D. Stout and E. F. Johnson, The structure of human microsomal cytochrome P450 3A4 determined by X-ray crystallography to 2.05-A resolution, J. Biol. Chem., 2004, 279, 38091–38094 CrossRef CAS.
- J. K. Yano, M. H. Hsu, K. J. Griffin, C. D. Stout and E. F. Johnson, Structures of human microsomal cytochrome P450 2A6 complexed with coumarin and methoxsalen, Nat. Struct. Mol. Biol., 2005, 12, 822–823 CAS.
- P. Vasanthanathan, J. Hritz, O. Taboureau, L. Olsen, F. S. Jørgensen, N. P. Vermeulen and C. Oostenbrink, Virtual screening and prediction of site of metabolism for cytochrome P450 1A2 ligands, J. Chem. Inf. Model., 2009, 49, 43–52 CrossRef CAS.
- C. A. Baxter, C. W. Murray, D. E. Clark, D. R. Westhead and M. D. Eldridge, Flexible docking using Tabu search and an empirical estimate of binding affinity, Proteins: Struct., Funct., Genet., 1998, 33, 367–382 CrossRef CAS.
- M. D. Eldridge, C. W. Murray, T. R. Auton, G. V. Paolini and R. P. Mee, Empirical scoring functions. 1. The development of a fast empirical scoring function to estimate the binding affinity of ligands in receptor complexes, J. Comput.-Aided Mol. Des., 1997, 11, 425–445 CrossRef CAS.
- J. K. Yano, T. T. Denton, M. A. Cerny, X. Zhang, E. F. Johnson and J. R. Cashman, Synthetic inhibitors of cytochrome P-450 2A6: inhibitory activity, difference spectra, mechanism of inhibition, and protein cocrystallization, J. Med. Chem., 2006, 49, 6987–7001 CrossRef CAS.
Footnote |
| † Electronic supplementary information (ESI) available: Experimental section, Tables S1 and S2, and Fig. S1*. See DOI: 10.1039/c1md00087j |
| This journal is © The Royal Society of Chemistry 2011 |
