Binding properties and biological characterization of new sugar-derived Ras ligands†
Elena
Sacco
a,
Sherwin J.
Abraham
b,
Alessandro
Palmioli
a,
Gaetana
Damore
a,
Anna
Bargna
a,
Elisa
Mazzoleni
a,
Vadim
Gaponenko
*b,
Marco
Vanoni
a and
Francesco
Peri
*a
aDepartment of Biotechnology and Biosciences, University of Milano-Bicocca, P.zza della Scienza, 2, 20126, Milano, Italy. E-mail: francesco.peri@unimib.it; Fax: (+39)0264483565; Tel: (+39)0264483453
bDepartment of Biochemistry and Molecular Genetics, University of Illinois at Chicago, 900 S. Ashland Ave., Chicago, IL 60607. E-mail: vadim@uic.edu; Fax: +1 (312) 413-0353; Tel: +1 (312) 355-4965
First published on 7th March 2011
Abstract
Since mutations of Ras genes have a great incidence in human tumours, Ras oncoproteins are a major clinical target for the development of anticancer agents. We have developed synthetic molecules able to inhibit Ras activation. Here we present new, water-soluble Ras inhibitors composed by an aromatic pharmacofore moiety covalently linked to different sugars. New glycosylated compounds bind to Switch 2 region of Ras, also involved in effector binding, inhibit GEF-catalyzed nucleotide exchange on Ras in vitro, and reduce Ras-dependent proliferation of murine fibroblasts. The influence of the sugar unit on Ras binding affinity and on the biological activity of Ras inhibitors has been investigated.
Introduction
The guanine nucleotide-binding protein Ras is involved in various cellular signal transduction pathways inducing cell proliferation, differentiation or apoptosis.1–3 Ras functions as a molecular switch, cycling between a GDP-bound inactive state and a GTP-bound active state.4 The active Ras-GTP complex, in turn, exists in a dynamic equilibrium of two different conformational states that show different affinity for downstream effector proteins.5 The cyclic switch from activated to inactivated states and conformations is catalyzed by other proteins, namely guanine nucleotide exchange factors (GEF) that promote nucleotide exchange (activation), and GTPase activating proteins (GAP) that accelerate hydrolysis of Ras-bound GTP to GDP (deactivation).6Oncogenic Ras mutants are found in 30% of human tumors, with great incidence in colon (50%), and pancreatic (90%) adenocarcinomas.7 Furthermore, aberrant Ras signalling contributes to pathogenesis of some human developmental disorders, including Neuro-Cardio-Facio-Cutaneous syndromes.8 Thus, Ras proteins are considered a major clinical target for the above diseases, and a significant effort has been recently devoted to the development of small molecules that are able to bind to Ras and inhibit its activation.
We synthesized small molecules that bind to Ras and inhibit GEF-mediated nucleotide exchange in vitro.9–12 Some of these synthetic Ras inhibitors are only composed by aromatic pharmacophores,9,12 others contain aromatic moieties covalently linked to sugar scaffolds derived from glucose and arabinose.10,11 While showing affinity to Ras in vitro10,11 and selective toxicity towards colorectal cancer cells expressing the oncogenic K-RasG13D mutant,13 synthetic Ras ligands previously developed by our group suffered from low water solubility and therefore poor bioavailability. Recently we developed a small molecule (here named compound 2) showing interesting in vitro activity associated with good water solubility.14 Such molecule, containing an aromatic pharmacophore (here named compound 1) conjugated to glucose, is able to bind to the β-3/α-2 region of H-Ras-GDP that is involved in GEF binding, as demonstrated by NMR experiments. By MD simulations and docking refinement of such NMR binding data two most representative low-energy binding modes between 2 and Ras were obtained. In one only the aromatic part of 2 interacts with Ras, while the glucose unit stays external to the binding cavity, in the other one, the sugar too is involved in binding interactions with Ras. Here we defined the role of glucose moiety in Ras binding and in inhibitory efficacy of compound 2 and of other differently glycosylated compounds.
Results and discussion
Chemistry
To investigate more directly the influence of the sugar moieties on activity of synthetic Ras inhibitors, we present here the binding properties and the biological characterization of the non-glycosylated, aromatic pharmacophore 1 compared to differently glycosylated derivatives 2–4, whose chemical structures are depicted in Fig. 1A. According to structure–activity data from previous studies on Ras inhibitors, aromatic rings with functional groups such as phenols or hydroxylamines can form a pharmacophore that binds Ras with significant affinity.10,13 Compound 1 was therefore projected as the simplest Ras-binding unit that was then conjugated to some of the sugars most abundant in animals and plants, namely glucose (2),14N-acetyl glucosamine (3) and lactose (4), with the aim to increase hydrophilicity and water solubility. Compounds 3 and 4 were synthesized by the procedure previously used for 2 (see ESI for details on synthesis†).14 Compound 1 was reacted with, respectively, N-acetylglucosamine and lactose in DMF–AcOH:aqueous sodium acetate buffer (pH 4.5) at 50 °C for 24 h. The yields of the chemoselective glycosylation reactions were, respectively, 46% and 52% for the preparation of 3 and 4. As expected, sugar-containing compounds dissolved readily in acqueous buffer. However, compound 1 dissolved only in the presence of DMSO.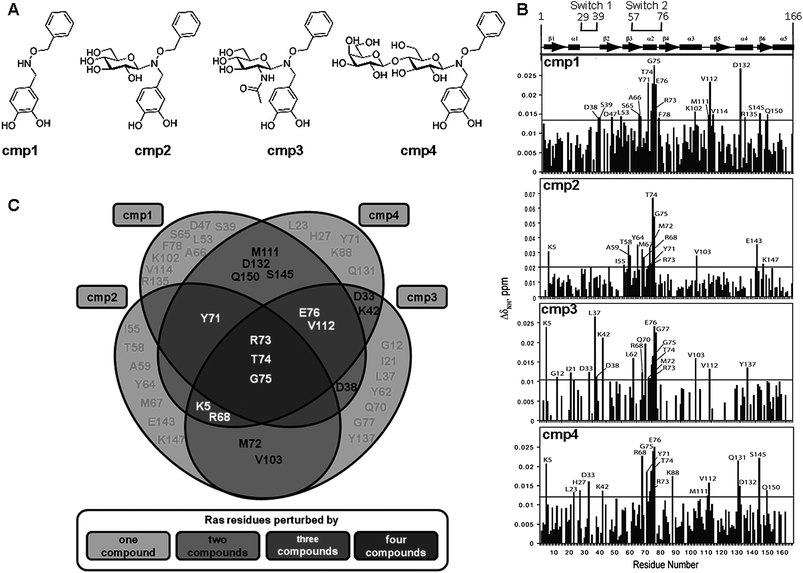 | ||
Fig. 1 (A) Structure of compounds 1–4. (B) Normalized HN chemical shift perturbations resulting from NMR titration of H-Ras-GDP with compounds 1–4. The graphs are generated based on HSQC spectra of H-Ras-GDP at the protein:compound ratio of 1![[thin space (1/6-em)]](https://www.rsc.org/images/entities/char_2009.gif) :2. The horizontal line marks the average value of chemical shift perturbations plus one standard deviation. The statistically significant chemical shift perturbations are marked on the graphs with residue type and number. (C) Venn chart for comparing the residues of Ras perturbed by the different compounds. Each circle contains the residues of Ras that undergo to chemical shift upon the addition with a specific compound in the NMR titration experiment. The intersections among circles contain residues perturbed by more than one compound. :2. The horizontal line marks the average value of chemical shift perturbations plus one standard deviation. The statistically significant chemical shift perturbations are marked on the graphs with residue type and number. (C) Venn chart for comparing the residues of Ras perturbed by the different compounds. Each circle contains the residues of Ras that undergo to chemical shift upon the addition with a specific compound in the NMR titration experiment. The intersections among circles contain residues perturbed by more than one compound. | ||
NMR binding experiments
First, by NMR experiments in solution the H-Ras-GDP binding sites of the compounds were characterized by titration of compounds 1–4 (Fig. 1A) into a solution of 15NH-Ras followed by 15N-edited HSQC experiments. Data on compound 2 were published by our group, and are reported here to allow comparative analysis with compounds 1, 3 and 4. Although chemical shift perturbations obtained by this assay most likely occur at the protein-ligand binding interface, indirect effects resulting from ligand-induced structural rearrangements can also be detected. Statistically significant chemical shift perturbations obtained upon compounds addition, are marked in Fig. 1B and are summarized as a Venn chart in Fig. 1C. Quite a large number of Ras residues are perturbed by one or more compounds (Fig. 1B). Compound 1, having the lowest Ras affinity of the tested compounds (see below), induces the highest number of chemical shift perturbations not shared with other compounds that likely correspond to specific binding. On the contrary, residues perturbed by all or most compounds define the binding site. These include residues R73, T74 and G75 (Fig. 1C, residues in the intersection area among all four compounds) and residues K5 and R68 (shared by compounds 2, 3, and 4), Y71 (shared by compounds 1, 2, and 4), E76 and V112 (shared by compounds 1, 3 and 4). Residues R68, Y71, R73, T74, G75 and E76 map to the β-3/α-2 region of Ras (Switch 2 region, residues 57–76). Residues K5 and V112 map to the β-1 and β-5 strand, respectively, that are adjacent to the β-3/α-2 region in Ras the dimensional 3D structure, thus completing the surface patch on the catalytic domain of H-Ras-GDP involved in the binding to compounds. Therefore all compounds, as previously published for compound 2, bind to Switch 2 region of Ras, also involved in binding with effectors, such as GEFs.NMR titration experiments also provided an opportunity to determine dissociation constants for compounds 1–4 binding to H-Ras-GDP. The chemical shift changes caused by compound binding were used in a fitting procedure to determine the Kd values. Example fits for compounds 1–4 interacting with the dominant binding site in the β-3/α-2 region of H-Ras-GDP are shown in ESI (Fig. S1†). Compounds 2, 3 and 4 displayed good affinities with dissociation constants of 9.5 ± 1.2 μM, 5.5 ± 2.9 μM and 7.8 ± 2.9 μM, respectively. Compound 1 bound H-Ras-GDP weakly with a dissociation constant of 21.4 ± 7.6 μM.
The compounds tested here share the same aromatic moiety and different covalently linked sugar moieties. Because the compounds involve very similar interfaces when interacting with H-Ras-GDP we hypothesized that the compounds bind H-Ras-GDP through their aromatic ring structure. To test this hypothesis we performed a saturation transfer difference (STD) experiment that is designed to delineate the moieties in small compounds that are directly involved in binding large proteins (Fig. 2A–C). Compound 1 bound H-Ras-GDP significantly weaker than the other compounds displaying low intensity STD signals in the aromatic region. This observation is in agreement with our hypothesis and with the lower binding affinity for compound 1 measured by NMR titration. Compounds 3 and 4 (Fig. 2B and 2C respectively) exhibited larger STD signals in the aromatic region than compound 1 (Fig. 2A). The 1H signals belonging to the sugar moieties expected to be observed in the region roughly ranging from 2 to 5 ppm of 1H NMR spectrum were very weak. The only significant STD signals in the aliphatic region belonged to the buffer components. Together, this supports our hypothesis that the aromatic ring structure that is common in the tested compounds provides the dominant binding site to H-Ras-GDP. However, there is still a question of what causes differences in compound binding specificity and affinity. One possible explanation of this phenomenon is structural modulation of the ring structure by the attached sugar moiety. To test this idea we compared one-dimensional NMR spectra of compounds 1, 3, 4 (Fig. 2D–F). Indeed, the 1H signals belonging to common aromatic ring structure in compounds 1, 3, 4 do not overlay with compound 1 (Fig. 2D) exhibiting more significant differences from compounds 3 and 4 (Fig. 2E and 2F respectively). Although the 1H signals in the aromatic region of compounds 3 and 4 are more similar to each other, clear differences are also discernable. Therefore the attached sugar moieties slightly alter the relative orientation of the aromatic rings and thus affect compound binding specificity and affinity.
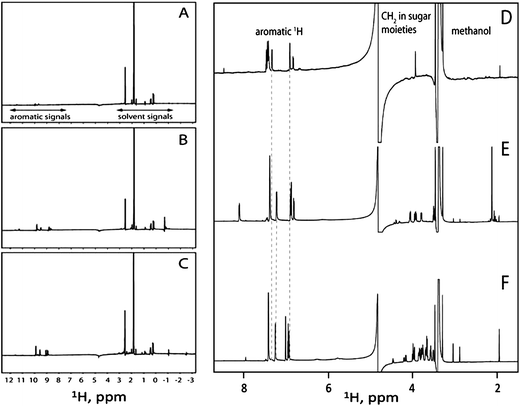 | ||
| Fig. 2 STD spectra of compound 1 (A), compound 3 (B), and compound 4 (C) bound to H-Ras-GDP. The aromatic 1H signals belonging to the tested compounds and the 1H signals belonging to the buffer components are marked. One-dimensional 1H-NMR spectra of compounds 1 (D), 3 (E), and 4 (F). The dashed lines indicate differences in chemical shifts for 1H signals in the aromatic region of compounds 1, 3, and 4. | ||
Biology
The ability of compounds 1–4 to interfere with the in vitroGEF-catalyzed nucleotide exchange on Ras was studied using experiments with fluorescent nucleotide MANT-GDP.15,16 The exchange reactions between GDP and fluorescent MANT-GDP on H-Ras were monitored by adding a 5-fold excess of MANT-GDP (1.25 μM) and the catalytic domain of GEF (RasGRF1, 0.0625 μM) to 0.25 μM H-Ras-GDP. The exchange reactions were performed in presence of increasing concentrations of compounds 1–4 (0, 100, 250 and 500 μM for 1, 2, 4 and 0, 50, 100 and 250 μM for 3). The intrinsic fluorescence of 3 hampered exchange assays when used at concentrations higher than 250 μM. Representative sets of exchange curves obtained with each compound are reported in the electronic ESI (Fig S2†). The initial rate of each exchange reaction (mean of at least three independent experiments) was plotted as a function of compound concentration (dose–response curves). The dose-response curves (Fig. 3A) and the IC50 values of the activity of synthetic compounds in inhibiting the GEF-mediated nucleotide exchange of Ras (Fig. 3B) clearly point out that compounds 2–4 are more potent in inhibiting nucleotide exchange than 1. The inhibitory efficiency of compounds directly correlates with their Ras affinity, as shown by the IC50versus Kd plot in the insert of Fig. 3A.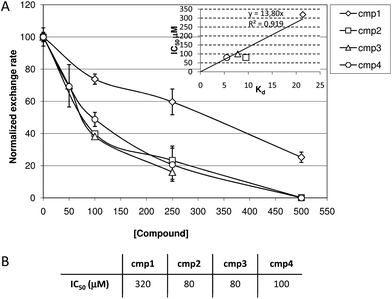 | ||
| Fig. 3 (A) Dose-response curves of compounds 1–4 dissolved in DMSO-containing buffer on GEF-catalyzed exchange in Ras, obtained by plotting the exchange rate as a function of compound concentration. The exchange rate of control reaction (without any synthetic compound) was normalized to 100. (B) Inhibitory efficacy of compounds 1–4 on GEF-catalyzed nucleotide exchange on Ras as derived from curves in Figure S2,† expressed as IC50 values. | ||
The effects of compounds 2–4 on the Ras-dependent proliferation of normal (NIH3T3) and KRAS-transformed (NIH-RAS) murine fibroblasts were then investigated. Only water soluble compounds 2–4 were assayed, while compound 1 was not tested because DMSO required for its solubilization has a cytotoxic effect at concentrations higher than 0.1% (v/v).17Cells were plated at a density of 3000 cells cm−2, left to adhere to the wells for 18 h, and then treated with compounds 2–4 supplemented in the growth medium, and counted at 24, 48 and 72 h after treatment. Growth curves of normal and transformed fibroblasts treated with increasing concentrations of compound 3 are reported in Fig. 4A and 4B, respectively. These data highlight a dose-dependent inhibitory effect of compound 3 on cell proliferation. Similar results were obtained with compounds 2 and 4 (data not shown). Growth curves of normal (Fig. 4C) and transformed (Fig. 4D) fibroblasts treated with 100 μM of each compound show that compounds 2–4 had a similar inhibitory efficacy on proliferation.
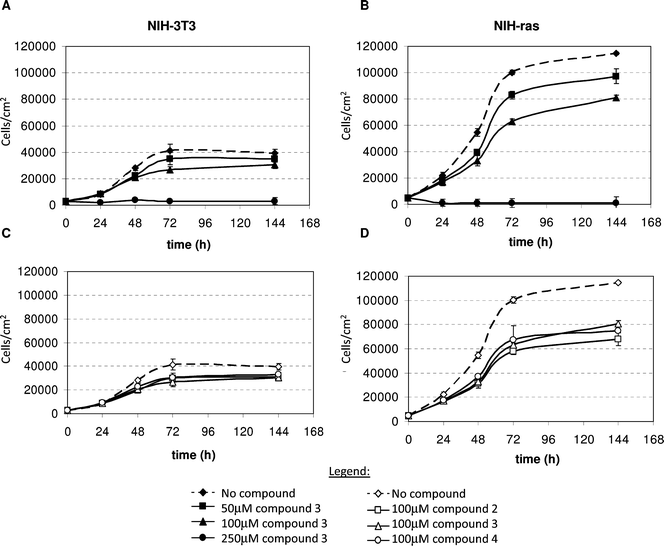 | ||
| Fig. 4 Growth curves of normal NIH3T3 (A) and K-RAS transformed NIH-RAS (B) murine fibroblasts grown in media supplemented with different concentration of compound 3: 0 μM (black diamonds and dotted lines) 50μM (black squares) 100 μM (black triangles) and 250μM (black circles). Growth curves of NIH3T3 (C) and NIH-RAS (D) cells treated with 100 μM of compound 2 (open squares), 3 (open triangles) and 4 (open circle). Control curves (with 0μM compound) are showed as open diamond and dotted lines. Plotted data are mean ± s.d. computed from at least two independent experiments performed in triplicates. | ||
Specificity of the action of the compounds was confirmed by assaying the activation state of p42/p44 MAPKs, well known Ras effectors, that act downstream of growth-factor activated pathway. NIH-RAScells treated for 24 h with 250μM compound 3 show reduced phosphoMAPK levels if compared with cells treated with buffer (Fig. 5A). The Ras-specific GEF involved in the growth-factor activated pathway is hSos1 that shares with RasGRF1 the general structure of the catalytic core, despite some different regulation of catalytic activity. To confirm that our compounds can inhibit hSos1-mediated exchange, as well as GRF1-mediated exchange we performed hSos1-catalyzed nucleotide exchange assay on Ras in presence of different concentrations of compound 3 (Fig. S3, ESI). Fig. 5B shows that compound 3 inhibits in a dose dependent manner the hSos1-catalyzed nucleotide exchange on H-Ras, with a calculated IC50 that is very similar to that observed for RasGRF1-catalyzed exchange, indicating that the inhibirory effect of compounds is not limited to a specific GEF protein, but is extended likely to all as-GEFs that share the same Ras-binding site.
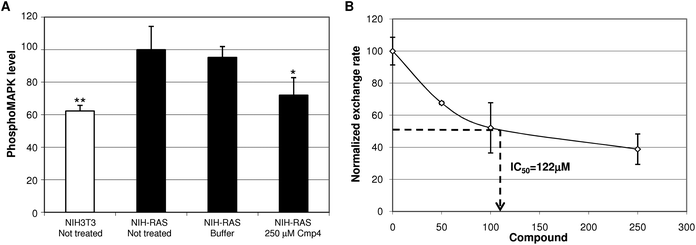 | ||
| Fig. 5 (A)Phosphorylated MAPK level in cell lysates from NIH3T3, NIH-RAS cells not treated or treated for 24 h with 250mM Cmp3, or buffer. Data are normalized on the Phospho-MAPK level in NIH-RAS cells taken equal to 100. Data shown are mean ± standard deviation of two independent experiments, each performed in triplicate. Single and double asterisk above histograms indicates a statistical significance of 95% and 99% respectively, calculated by Student's t-test in comparison to cells treated with buffer. (B) Dose–response curves of compound 3 on GEF-catalyzed exchange of Ras. The initial exchange rate of each exchange reaction (mean of at least three independent experiments) was plotted as a function of the compound concentration (dose–response curves). The exchange rate of control reaction (performed without compound) was normalized to 100. | ||
Conclusion
NMR experiments demonstrate that all compounds bind Ras in a very similar manner predominantly through their aromatic ring structure. However the sugar moieties, even though do not participate directly in Ras binding, affect it by likely modulating the relative orientation and conformational mobility of the (two) aromatic rings interacting with Ras, so that the glycosylated compounds bind to Ras with higher affinity than the non glycosylated compound 1.All compounds specifically bind to β-3/α-2 region (Switch 2) of H-Ras-GDP, also involved in binding with effectors, including GEF. This supports the hypothesis that such compounds can function as Ras inhibitors by affecting Ras-GEF binding. Accordingly, all compounds are able to inhibit the GEF-catalyzed nucleotide exchange on Ras in vitro. In this assay, glycosylated compounds were more potent in inhibiting Ras activation than compound 1. This result is in agreement with the lower affinity of such compound for Ras and also could be due to the fact that it, unlike compounds 2–4, does not bind residue R68 (Fig. 1C intersection among compounds 2, 3 and 4) that plays a critical role in conformational changes occurring in Ras activation and in binding to GEFs.18 In fact, in the crystal structure of Ras in complex with the catalytic domain of the GEF hSos1 (PDB code 1BKD),19 R68 of Ras directly interacts with E1002 of hSos1. The inability to interact with R68 could therefore account for the weakest biological activity of 1.
In conclusion the sugar moiety of Ras inhibitors is not only involved in increasing their water solubility, but plays a key role in orientating the pharmacophore groups in a way that improve the Ras affinity and the Ras inhibitory efficacy. Preparation of larger libraries of glycol-randomized synthetic Ras inhibitors in which aromatic hydroxylamine-containing pharmacophores are linked to a variety of sugars or other natural compounds20 is in progress. Their characterization will allow to define in more detail structure/activity relationships in this class of compounds.
Acknowledgements
We acknowledge support by the American Cancer Society Grant RGS-09-057-01-GMC to VG, by MIUR (FAR60%) and Creabilis to MV. Thanks to Roberto Cighetti for doing the TOC Figure.References
- M. Barbacid, Annu. Rev. Biochem., 1987, 56, 779–827 CrossRef CAS.
- M. Malumbres and M. Barbacid, Nat. Rev. Cancer, 2003, 3, 459–465 CrossRef CAS.
- M. Drosten, A. Dhawahir, E. Y. Sum, J. Urosevic, C. G. Lechuga, L. M. Esteban, E. Castellano, C. Guerra, E. Santos and M. Barbacid, EMBO J., 2010, 29, 1091–1104 CrossRef CAS.
- F. McCormick, Cell, 1989, 56, 5–8 CrossRef CAS.
- M. Spoerner, C. Herrmann, I. R. Vetter, H. R. Kalbitzer and A. Wittinghofer, Proc. Natl. Acad. Sci. U. S. A., 2001, 98, 4944–4949 CrossRef CAS.
- J. L. Bos, H. Rehmann and A. Wittinghofer, Cell, 2007, 129, 865–877 CrossRef CAS.
- L. Chin, A. Tam, J. Pomerantz, M. Wong, J. Holash, N. Bardeesy, Q. Shen, R. O'Hagan, J. Pantginis, H. Zhou, J. W. Horner, 2nd, C. Cordon-Cardo, G. D. Yancopoulos and R. A. DePinho, Nature, 1999, 400, 468–472 CrossRef CAS.
- S. Schubbert, K. Shannon and G. Bollag, Nat. Rev. Cancer, 2007, 7, 295–308 CrossRef CAS.
- S. Colombo, F. Peri, R. Tisi, F. Nicotra and E. Martegani, Ann. N. Y. Acad. Sci., 2004, 1030, 52–61 CrossRef CAS.
- F. Peri, C. Airoldi, S. Colombo, E. Martegani, A. S. van Neuren, M. Stein, C. Marinzi and F. Nicotra, ChemBioChem, 2005, 6, 1839–1848 CrossRef CAS.
- C. Airoldi, A. Palmioli, A. D'Urzo, S. Colombo, M. Vanoni, E. Martegani and F. Peri, ChemBioChem, 2007, 8, 1376–1379 CrossRef CAS.
- S. Colombo, A. Palmioli, C. Airoldi, R. Tisi, S. Fantinato, S. Olivieri, L. De Gioia, E. Martegani and F. Peri, Curr. Cancer Drug Targets, 2010, 10, 192–199 Search PubMed.
- A. Palmioli, E. Sacco, C. Airoldi, F. Di Nicolantonio, A. D'Urzo, S. Shirasawa, T. Sasazuki, A. Di Domizio, L. De Gioia, E. Martegani, A. Bardelli, F. Peri and M. Vanoni, Biochem. Biophys. Res. Commun., 2009, 386, 593–597 CrossRef CAS.
- A. Palmioli, E. Sacco, S. Abraham, C. J. Thomas, A. Di Domizio, L. De Gioia, V. Gaponenko, M. Vanoni and F. Peri, Bioorg. Med. Chem. Lett., 2009, 19, 4217–4222 CrossRef CAS.
- C. Lenzen, R. H. Cool, H. Prinz, J. Kuhlmann and A. Wittinghofer, Biochemistry, 1998, 37, 7420–7430 CrossRef CAS.
- E. Sacco, D. Metalli, S. Busti, S. Fantinato, A. D'Urzo, V. Mapelli, L. Alberghina and M. Vanoni, FEBS Lett., 2006, 580, 6322–6328 CrossRef CAS.
- J. M. Crawford and N. S. Braunwald, In Vitro Cellular & Developmental Biology - Animal, 1991, 27A, 633–638 Search PubMed.
- G. Buhrman, G. Holzapfel, S. Fetics and C. Mattos, Proc. Natl. Acad. Sci. U. S. A., 2010, 107, 4931–4936 CrossRef CAS.
- P. A. Boriack-Sjodin, S. M. Margarit, D. Bar-Sagi and J. Kuriyan, Nature, 1998, 394, 337–343 CrossRef CAS.
- B. R. Griffith, J. M. Langenhan and J. S. Thorson, Curr. Opin. Biotechnol., 2005, 16, 622–630 CrossRef CAS.
Footnote |
| † Electronic supplementary information (ESI) available: Synthetic methods, NMR, biology, Figure S1, Figure S2, Figure S3. See DOI: 10.1039/c0md00264j |
| This journal is © The Royal Society of Chemistry 2011 |