Structure–activity relationships of benzimidazole derivatives as antiparasitic agents: Dual activity-difference (DAD) maps†
Jaime
Pérez-Villanueva
a,
Radleigh
Santos
b,
Alicia
Hernández-Campos
a,
Marc A.
Giulianotti
b,
Rafael
Castillo
a and
Jose L.
Medina-Franco
*b
aFacultad de Química, Departamento de Farmacia, Universidad Nacional Autónoma de México, México, DF 04510, México
bTorrey Pines Institute for Molecular Studies, 11350 SW Village Parkway, Port St. Lucie, FL 34987, USA. E-mail: jmedina@tpims.org; Fax: +1 772 345 3649; Tel: +1 772 345 4685
First published on 8th November 2010
Abstract
Parasitic infections still remain a major health threat in developing countries. Herein we report a systematic characterization of the structure–activity relationships (SAR) of a comprehensive set of benzimidazole derivatives tested against Trichomonas vaginalis and Giardia intestinalis. The analysis was based on pairwise comparisons of the activity similarity and molecular similarity using different molecular representations. Overall, results encourage simultaneous lead optimization efforts for benzimidazole derivatives active against both protozoan. In order to explore the activity profile of the benzimidazoles against the two parasites, we developed the dual activity-difference (DAD) map. DAD map is a complementary approach to systematically characterize the SAR of compound data sets.
Parasitic diseases are still a major health problem in developing countries. Among the most common protozoa infections are giardiosis, caused by Giardia intestinalis, and trichomonosis, a genitourinary infection caused by Trichomonas vaginalis.1,2 Recently, antiprotozoal activity of benzimidazole derivatives has been reported against these two parasites including compounds in the low nanomolar range. We have reported a first study towards the systematic characterization of the structure–activity relationships (SAR) of this class of compounds. Using the emerging concept of activity landscape3 we explored the SAR of 32 benzimidazoles finding a heterogeneous SAR for both parasites.4
Expanding on our previous work, herein we report a systematic characterization of the activity landscape of a larger set with 55 benzimidazole derivatives tested against T. vaginalis and G. intestinalis. This is a comprehensive set of published benzimidazoles with activity against the two parasites.5–9 The extended set includes 14 compounds with an alkylthio substituent at position 28 and nine 2-(trifluoromethyl)benzimidazoles,5–7 for which the SAR has not been characterized thoroughly. We also present a general approach to systematically explore the selectivity profile of these compounds against the two protozoan.
The chemical structures of the benzimidazole derivatives analyzed in this work are schematically depicted in Fig. 1. Most of the compounds have been synthesized in our group. Table S1 in the ESI,† shows the complete chemical structure for all 55 compounds. Noteworthy, 23 molecules in the data set have two tautomeric forms yielding a total of 78 chemical representations. Although theoretical efforts have been conducted to suggest the bioactive tautomeric form of some benzimidazoles as antiparasitic agents,10 it remains to be proven which tautomeric form(s) of the compounds are the biological relevant for giardicidal and trichomonicidal activity. Table S1 also lists the 50% inhibitory concentration (IC50) in in vitro susceptibility assays for each parasite as pIC50 (−logIC50). The activity of the 55 compounds was obtained by the same group under similar conditions. All compounds are non 2-methylcarbamates and their mechanism of action remains unknown.11,12
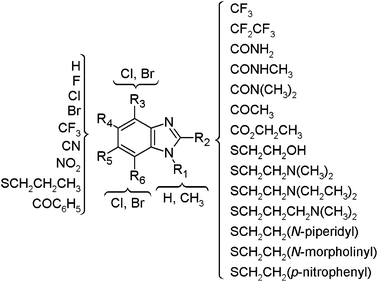 | ||
| Fig. 1 General form of the benzimidazole derivatives studied in this work. The chemical structures of the 55 compounds, including the tautomeric forms, are shown in Table S1 in the ESI.† | ||
The characterization of the antiprotozoal activity landscape for the benzimidazole derivatives was based on pairwise comparisons of the activity similarity and molecular similarity. Since chemical space13,14 and the activity landscape may vary with the structural representation,15,16 we considered an initial set of ten fingerprint representations to measure molecular similarity, namely radial, dendritic, MOLPRINT 2D, atom pairs, MACCS (166-bits), TDG, GpiDAPH3, piDAPH3, 3-, and 4-point pharmacophore fingerprints (see Methods). Despite the fact that the data set of molecules studied in this work share the same core scaffold, whole molecule fingerprint-based similarity methods were able to capture the activity landscape. Molecular similarity was computed with the Tanimoto coefficient. Figure S1 in the ESI summarizes the distribution of the 3,003 pairwise similarities for the 55 benzimidazoles (78 structural representations, considering the tautomeric forms) calculated with the ten fingerprints.† Table S2 in the ESI shows the correlation between the ten fingerprints.† Based on the distribution of similarity values and the relationships between the fingerprints, we selected dendritic, MACCS keys and piDAPH3 to characterize the activity landscape. Of note, the three fingerprints showed low correlation (<0.75) and dendritic fingerprint was able to differentiate between tautomeric forms.
Activity landscapes were portrayed using the well-established Structure–Activity Similarity (SAS) maps.17 Briefly, in a SAS map, the activity similarity is represented in the Y-axis and molecular similarity is plotted in the X-axis. A general form is presented in Table 1. Using thresholds for activity and molecular similarity, it is possible to define four regions in the SAS maps. Region I corresponds to pairs of molecules with high activity similarity and low molecular similarity and therefore are associated with regions of scaffold (or side chain) hopping. Points in region II denote pairs of molecules with high molecular similarity and high activity similarity. Thus, compounds in this region are in a smooth or continuous SAR landscape. Region IV identifies pairs of molecules that have high molecular similarity and low activity similarity and therefore correspond to activity cliffs or discontinuous SAR.18 Figure S2 in the ESI shows six SAS maps,† three for each parasite using the selected molecular representations. For each parasite, we identified several pairs of compounds that are located in similar regions of the SAS map for all three molecular representations, e.g., consensus pairs (marked in black in Figure S2†).16 Among the consensus pairs, we identified pairs of compounds with the same molecules in the pair that are located in similar regions of the SAS maps for T. vaginalis and G. intestinalis, e.g., dual-target consensus pairs. Table 1 summarizes the number of data pairs in different regions of the SAS maps for each parasite (see Methods for the thresholds used to define the four regions). Table 1 also summarizes the number of consensus pairs and dual-target consensus pairs. Noteworthy, we observed a large number of dual-target consensus pairs, in particular in the side chain hopping region of the landscape (1,104 (37%) data points in region I). This result suggests a common mechanism of action for several of the benzimidazoles in both parasites. Similar conclusions were obtained with the smaller set of 32 compounds previously reported.4 We also detected four consensus activity cliffs common for both parasites (2_16, 2_20, 3_16, and 3_20). Overall, a heterogeneous SAR was found for both protozoan.
|
|
|||||||||
|---|---|---|---|---|---|---|---|---|---|
| Representation | Median similarity of activesb | I | II | III | IV | ||||
| Totalc | Active pairsd | Total | Active pairs | Total | Active pairs | Total | Active pairs | ||
| a Regions I–IV are defined by the median similarity of active compounds and 0.5 as the threshold for activity similarity. b Median similarity of compounds with pIC50 > 7.3 (IC50 < 50 nM). c Total number of data points (pair of compounds) in the region. d Number of data points with at least one active compound (pIC50 > 7.3) in the pair. e Consensus pairs for the three molecular representations. f Consensus pairs in both parasites for the three molecular representations. | |||||||||
| T. vaginalis | |||||||||
| Dendritic | 0.26 | 1815 | 621 | 868 | 287 | 290 | 192 | 30 | 12 |
| MACCS | 0.54 | 1598 | 571 | 1085 | 337 | 237 | 158 | 83 | 46 |
| piDAPH3 | 0.69 | 1959 | 635 | 724 | 237 | 289 | 177 | 31 | 27 |
| Consensus pairse | 1388 | 499 | 509 | 194 | 217 | 142 | 9 | 9 | |
| G. intestinalis | |||||||||
| Dendritic | 0.24 | 1575 | 696 | 898 | 397 | 472 | 341 | 58 | 29 |
| MACCS | 0.55 | 1535 | 715 | 938 | 378 | 393 | 280 | 137 | 90 |
| piDAPH3 | 0.67 | 1645 | 635 | 828 | 458 | 477 | 327 | 53 | 43 |
| Consesus pairs | 1244 | 556 | 548 | 294 | 354 | 246 | 17 | 9 | |
| Dual-target consensus pairsf | 1104 | 300 | 491 | 160 | 122 | 70 | 4 | 4 | |
Fig. 2 depicts a representative SAS map for T. vaginalis. The map shows the relationship between activity similarity and molecular similarity obtained with MACCS keys. The plot contains 3,003 data points that represent a pairwise comparison. Representative consensus pairs are shown along with their chemical structure and IC50 value against T. vaginalis. Compound pairs 9_16, 16_62, and 16_77, in region I of the SAS map, have low structural similarity and high activity similarity (Fig. 2). These data points are examples of side chain hopping, i.e., the substitution pattern around the benzimidazole scaffold is quite different; however, all compounds have similar activity. The compound pair 75_77, in region II, has high structural similarity and high activity similarity and illustrates a smooth SAR. Data point 77_78, also in region II, represents a tautomeric pair that is approximated to have the same activity. The pair 9_12, in region IV, illustrates an activity cliff where a small change in the structure is associated with a significant change in the IC50.18 Additional examples of activity cliffs illustrated in Fig. 2 are the pairs 2_20, 3_20, 9_49, and 9_50. Although the change in activity for these pairs is less dramatic than the change in IC50 for 9_12, it is readily observed that small changes in the substitution pattern of the benzimidazole scaffold are associated with considerable changes in activity. All pairs of compounds discussed here have the same relative position in the SAS maps of T. vaginalis obtained with other structural representations (Figure S2†). Moreover, most of these pairs occupy the same relative position in the SAS maps of G. intestinalis. Exceptions are pairs 9_12, 9_49, and 9_50 that are in a smooth region of the SAR for G. intestinalis (Figure S2†).
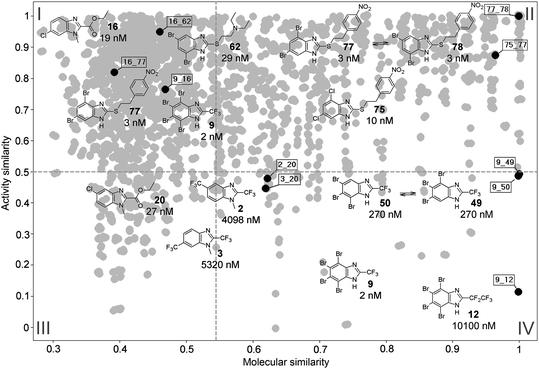 | ||
| Fig. 2 Representative SAS map for T. vaginalis obtained with MACCS keys. Each data point indicates a pairwise comparison. Figure also shows the chemical structures and biological activity (IC50) of selected consensus pairs in the three most representative regions of the SAS map. | ||
Having characterized the activity landscape of the benzimidazole derivatives for T. vaginalis and G. intestinalis, we systematically compared the activity and SAR of the molecules against the two parasites. The difference of pIC50 values is indicated in Table S1.† Several compounds showed a similar activity (low ΔpIC50) with T. vaginalis and G. intestinalis. We observed that most of the highly active compounds against T. vaginalis (pIC50 > 7, IC50 < 100 nM) also have high activity against G. intestinalis. These compounds have large substituents at the position 2 of the benzimidazole scaffold such as alkylthio and ethyl ester (16, 20, 23, 24, 28, 32, 55, 59–68, 71–78). Furthermore, for both parasites trifluoromethyl substitution at position 2 give compounds with activities that ranges from poor to moderate (pIC50 = 4.53–6.97) with the exception of compound 9 which has strong activity. Interestingly, the 1-methylbenzimidazole derivatives 13–32 have low differences in activity against two parasites in almost all cases (|ΔpIC50| = 0–0.77, median |ΔpIC50| = 0.205). For these compounds, chlorine atom substitution at position 6 is favorable for the activity for both parasites while substitution at position 5 is less favorable. Similar conclusions were obtained with the previous data of the 32 non 2-methylcarbamates.4 These results suggest that several of the new 2-(trifluoromethyl)benzimidazoles and compounds with an alkylthio substituent at position 2 also have a common mechanism of action against the two protozoan. However, we also identified molecules with large potency difference against the two parasites; there are nine compounds with more than one log unit in potency difference, and five compounds with more than 1.4 log units (Table S1†). None of the five compounds have an alkylthio substituent at position 2. Most of these compounds with large activity differences have bromine atoms at positions 4 to 7 or large substituents at positions 5 and 6.
The correlation between the pIC50 values for T. vaginalis and G. intestinalis is shown in Figure S3 in the ESI.† From this correlation it is straightforward to identify the five compounds discussed above with high potency differences. However, using just the correlation of pIC50 values or potency differences (ΔpIC50), it is not easy to systematically deduce the structural modifications associated with changes in potency against the two parasites. To this end, herein we propose the dual-activity difference (DAD) map. A general form of the map is in Fig. 3. This map is based on pairwise activity differences against the two parasites; the activity difference for one parasite is represented in the Y-axis and the activity difference for the second parasite is plotted in the X-axis.
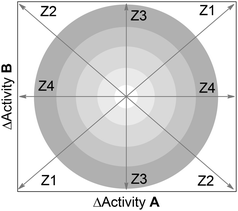 | ||
| Fig. 3 General form of the dual activity-difference (DAD) map showing four major zones, labeled as Z1–Z4. Concentric rings denote different magnitudes in activity differences; outer rings indicate larger differences. Pairs of compounds along or nearby Z1, indicate that the activity of the two compounds in the pair against A and B increases or decreases in similar proportion. Pairs of compounds along or nearby Z2, indicate that the change in activity for the compounds in the pair is opposite for A and B. Zones 3 and 4 identify pairs of compounds with the same or similar activity for one target, but different activity for the other target. Data pairs located at the intersections of Z1–Z4 (inner circle) indicates that the pair of compounds has similar activity against A and B. See text for details. | ||
A DAD map provides a visual and systematic characterization of the selectivity profile for a set of compounds screened with two parasites (or, in general, with two “targets”) A and B. Four general zones can be distinguished in Fig. 3, delineated by the lines Z1–Z4. Concentric rings in the figure denote different magnitudes in activity difference; outer rings indicate larger differences. Pairs of compounds along line Z1 or nearby this zone, indicate that the activity of the two compounds in the pair against A and B increases or decreases in similar proportion. In other words, the structural changes for the molecules in the pair along Z1 (either a small or a large structural change) have a similar impact in the activity against the two targets (either an increase or decrease in activity). Therefore, zone Z1 is associated with similar SAR of the compounds for both targets. Pairs of compounds along or nearby Z2, indicate that the change in activity for the compounds in the pair is opposite for A and B. Thus, the structural change in the pair of compounds along Z2 is associated with an inverse SAR, i.e., increases the activity for one target but decreases the activity for the other target. Data points along or nearby Z3 and Z4, denote pairs of molecules with the same or similar activity for one target (A or B, respectively), but different activity for the other target (B or A, respectively). Data pairs located exactly or close to the intersections of lines Z1–Z4 (inner circle) indicates that the pair of compounds has identical or similar activity against A and B. In other words, structural changes (either small or large changes) in the pair of compounds in this region have no or little impact, in the activity against the two targets. Noteworthy, molecular similarity is not represented directly in Fig. 3. However, molecular similarity information can be added to the DAD map (see below).
Fig. 4A shows the DAD map for the benzimidazole derivatives tested with T. vaginalis and G. intestinalis. The plot contains 3,003 data points that represent all (non-duplicate) pairwise comparisons (see Methods). Selected data points are colored by the zone they are associated with (see also Fig. 3); red points are close to Z1, blue points are close to Z2, yellow points are close to Z3, and green points are close to Z4. The black data point is approximately at the center of the map e.g., at the intersection of the four zones. Fig. 4B shows the chemical structures of the selected pairs in Fig. 4A along with their IC50 values for T. vaginalis and G. intestinalis. The pair 28_63, located towards the center of the map, exemplifies a pair of molecules where the structural changes do not modify significantly the activity either for T. vaginalis (IC50 = 86 vs. 85 nM) or for G. intestinalis (IC50 = 69 vs. 72 nM). Of note, 28_63 is also a good example of side chain hopping for both parasites, i.e., the substitution pattern around the benzimidazole scaffold is quite different; however, the activity is very similar (Fig. 4B).
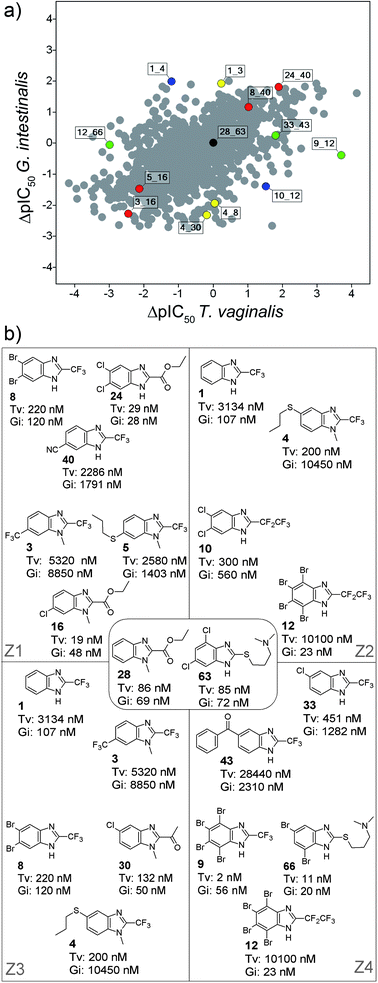 | ||
| Fig. 4 (a) DAD map for the benzimidazole derivatives tested with T. vaginalis and G. intestinalis. Selected pairs are color-coded by zone in the map (see also Fig. 3): red, Z1; blue, Z2; yellow, Z3; and green, Z4. The black data point is approximately at the center of the map. (b) Chemical structures of selected pairs in panel A along with their IC50 values for the two parasites. | ||
Compound pairs 3_16, 5_16, 8_40, and 24_40 are examples of data points close to Z1. The structural changes in each of these molecular pairs are associated with a similar change in activity difference for T. vaginalis and G. intestinalis. For example, for the pair 3_16 the change at R2 of a trifluoromethyl group (3) to ethyl ester (16), and the change at R5 of a trifluoromethyl group (3) to a chlorine atom (16), are associated with an increase in activity for both parasites (Fig. 4B). Similar conclusions can be obtained for other pairs in region Z1. Also note, the activity difference (ΔpIC50) for both parasites is lager in pairs 3_16 and 24_40 (located in outer regions of the map) as compared with the activity differences observed in pairs 5_16 and 8_40 (located towards the center of the map).
Compound pairs 1_4 and 10_12 are examples of data points close to the Z2 line (Fig. 4A). The structural change in each pair is associated with and inverse effect in activity. For example, comparing pair 1–4, N-methylation and substitution at R4 for a propylthio group (4) is associated with a significant increase in activity for T. vaginalis. However, the same structural changes are associated with a significant decrease in activity for G. intestinalis (Fig. 4B). Of note, 1 is selective for G. intestinalis whereas 4 is selective for T. vaginalis.
Data points 1_3, 4_8, and 4_30 are examples of pairs of compounds close to Z3 (Fig. 4A). In these points, the activity against T. vaginalis is similar whereas the activity against G. intestinalis changes (Fig. 4B). In contrast, compound pairs 9_12, 12_66, and 33_43, close to Z4, exemplify data points with similar activity against G. intestinalis but different activity against T. vaginalis. As discussed above, data points in the outer regions of the map have larger differences in activity (see concentric rings in Fig. 3). It is worth mentioning the pair 9_12, with similar activity for G. intestinalis but 3.7 log units in potency difference for T. vaginalis (Fig. 4A and 4B). Of note, 12 is selective for G. intestinalis whereas 33 is selective for T. vaginalis.
Molecular similarity information is not represented in the general form of the DAD map. Thus, it is not possible to deduce from this map if, for a given pair, the activity difference is associated with a small or large molecular change. However, since the DAD map is based on pairwise comparisons, it is straightforward to represent pairwise molecular similarity into this plot. Fig. 5A shows the DAD map of the benzimidazole derivatives distinguishing the data points by dendritic fingerprint similarity. A continuous color scale is used from green (less similar; similarity = 0.016) to red (more similar; similarity = 0.92). Fig. 5B shows in color 925 data pairs with high molecular similarity (similarity higher than the median similarity of the active compounds, see Table 1). Similar maps were obtained using MACCS keys and piDAPH3 fingerprints (data not shown). In general, we observed that compounds with high structural similarity tend to be located towards the center of the DAD map (Fig. 5B). This means that several pairs of benzimidazoles with high structural similarity have low activity differences for both parasites. This result further supports the conclusion that several benzimidazole derivatives have a similar and smooth SAR against T. vaginalis and G. intestinalis. However, we also detected pairs of structurally similar molecules with larger potency differences against the two parasites (a prominent example is the pair 9_12).
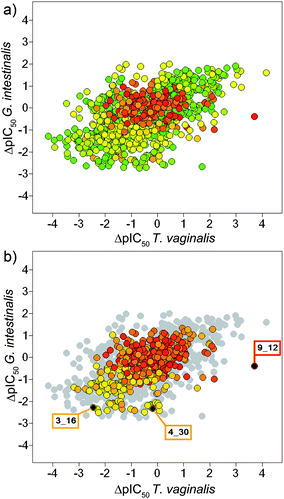 | ||
| Fig. 5 (a) DAD map with data pairs color-coded by dendritic fingerprint similarity using a continuous scale from green (less similar) to red (more similar). (b) Map showing in color 925 data pairs with high similarity. Selected pairs are marked in black and labeled with the compound numbers. The chemical structures of compounds in these pairs are shown in Fig. 4. See text for details. The figure using a continuous scale from white to black is shown in Figure S4 in the ESI.† | ||
Mapping molecular similarity into the DAD plot clearly reveals activity differences associated with small (or large) differences in structure. Three representative examples are illustrated in Fig. 5B. Data pairs 3_16 and 4_30 in regions Z1 and Z3, respectively, have high molecular similarity as measured with dendritic fingerprint. The pair 9_12 in region Z4 also has high molecular similarity and it is associated with a large change in activity difference for T. vaginalis. However, the activity difference with G. intestinalis is small. Therefore, it is possible to deduce from the DAD map, colored by molecular similarity that 9_12 is an activity cliff in the landscape of T. vaginalis but it is in the smooth region of the SAR for G. intestinalis.
In conclusion, a systematic characterization of the activity landscape of a comprehensive data set of benzimidazole derivatives screened against T. vaginalis and G. intestinalis revealed a heterogeneous SAR in both cases. Results supported our previous conclusions suggesting a common mechanism of action for several compounds against the two parasites, including compounds from the new set of 2-(trifluoromethyl)benzimidazoles and compounds with an alkylthio substituent at position 2. These results further encourage simultaneous lead optimization efforts for benzimidazole derivatives active against both protozoan. We also identified some compounds selective for each parasite and confirmed the presence of consensus activity cliffs. As part of the characterization of the SAR against both parasites, we developed the DAD map. This map allows for one to systematically explore differences in antiprotozoal activity for the benzimidazoles in order to identify structural changes associated with activity differences. Since molecular similarity information can be easily represented in the plot, the DAD map is a complementary tool used to systematically explore the SAR of the benzimidazoles. The predictive ability of the SAS and DAD maps in prospective studies remains to be explored.
Methods
The chemical structures and biological activity of the 55 benzimidazole derivatives were taken from the literature. Pairwise structural similarities were computed with the Tanimoto coefficient.19 2D similarity values were calculated with the Molecular Operating Environment (MOE)20 MACCS keys (166 bits), graph-based three point pharmacophores (GpiDAPH3), and typed graph distance (TGD). We also used the following 2D (32-bit) fingerprints as implemented in Canvas:21,22 radial, dendritic, atom pairs, and MOLPRINT 2D. 3D similarity values were calculated with the MOE pharmacophore atom triangle (piDAPH3) and Canvas 3- and 4-point pharmacophores fingerprints. To compute 3D similarities, a single low-energy conformation was considered for each molecule as previously reported.4 For each pair of molecules, the activity similarity for T. vaginalis and G. intestinalis was measured with the expression: , where Ai and Aj are the pIC50 values of the ith and jth molecules, and max-min indicate the range of activities in the data set. SAS maps were constructed by plotting the activity similarity against the structural similarity for each pair of compounds. In order to quantitatively characterize the SAS maps, each map was partitioned in four regions by using 0.5 as threshold for activity similarity. The median similarity of the most active compounds in the data set (pIC50 > 7.3) was used as threshold for molecular similarity.16DAD maps were generated by plotting pairwise pIC50 differences for both parasites. Duplicate comparisons were not considered. For example, compounds pairs 1_2 and 2_1 would have the same coordinates in the DAD map, with opposite sign. In this example we just considered one pair, 1_2.
Acknowledgements
The authors thank Dr Gerald M. Maggiora, for enlightening discussions. This work was supported by the State of Florida, Executive Office of the Governor's Office of Tourism, Trade, and Economic Development. J.P-V is supported by CONACyT and Carso Health Institute PhD studentships. J.P-V also thanks the State of Florida for partial support of his research visit at TPIMS.References and notes
- P. Upcroft and J. A. Upcroft, Clin. Microbiol. Rev., 2001, 14, 150–164 CrossRef CAS.
- D. S. Berkman, A. G. Lescano, R. H. Gilman, S. Lopez and M. M. Black, The Lancet, 2002, 359, 564–571 CrossRef.
- J. Bajorath, L. Peltason, M. Wawer, R. Guha, M. S. Lajiness and J. H. Van Drie, Drug Discovery Today, 2009, 14, 698–705 CrossRef CAS.
- J. Pérez-Villanueva, R. Santos, A. Hernández-Campos, M. A. Giulianotti, R. Castillo and J. L. Medina-Franco, Bioorg. Med. Chem., 2010, 18, 7380–7391 CrossRef CAS.
- G. Navarrete-Vázquez, L. Yépez, A. Hernández-Campos, A. Tapia, F. Hernández-Luis, R. Cedillo, J. González, A. Martínez-Fernández, M. Martínez-Grueiro and R. Castillo, Bioorg. Med. Chem., 2003, 11, 4615–4622 CrossRef CAS.
- G. Navarrete-Vázquez, M. D. Rojano-Vilchis, L. Yépez-Mulia, V. Meléndez, L. Gerena, A. Hernández-Campos, R. Castillo and F. Hernández-Luis, Eur. J. Med. Chem., 2006, 41, 135–141 CrossRef CAS.
- M. Andrzejewska, L. Yépez-Mulia, R. Cedillo-Rivera, A. Tapia, L. Vilpo, J. Vilpo and Z. Kazimierczuk, Eur. J. Med. Chem., 2002, 37, 973–978 CrossRef CAS.
- M. Andrzejewska, L. Yepez-Mulia, A. Tapia, R. Cedillo-Rivera, A. E. Laudy, B. J. Starościak and Z. Kazimierczuk, Eur. J. Pharm. Sci., 2004, 21, 323–329 CrossRef CAS.
- D. Valdez-Padilla, S. Rodríguez-Morales, A. Hernández-Campos, F. Hernández-Luis, L. Yépez-Mulia, A. Tapia-Contreras and R. Castillo, Bioorg. Med. Chem., 2009, 17, 1724–1730 CrossRef CAS.
- F. López-Vallejo, J. L. Medina-Franco, A. Hernández-Campos, S. Rodríguez-Morales, L. Yépez, R. Cedillo and R. Castillo, Bioorg. Med. Chem., 2007, 15, 1117–1126 CrossRef CAS.
- G. Navarrete-Vázquez, R. Cedillo, A. Hernández-Campos, L. Yépez, F. Hernández-Luis, J. Valdez, R. Morales, R. Cortés, M. Hernández and R. Castillo, Bioorg. Med. Chem. Lett., 2001, 11, 187–190 CrossRef CAS.
- J. Valdez, R. Cedillo, A. Hernández-Campos, L. Yépez, F. Hernández-Luis, G. Navarrete-Vázquez, A. Tapia, R. Cortés, M. Hernández and R. Castillo, Bioorg. Med. Chem. Lett., 2002, 12, 2221–2224 CrossRef CAS.
- J. L. Medina-Franco, K. Martínez-Mayorga, M. A. Giulianotti, R. A. Houghten and C. Pinilla, Curr. Comput.-Aided Drug Des., 2008, 4, 322–333 Search PubMed.
- J.-L. Reymond, R. van Deursen, L. C. Blum and L. Ruddigkeit, Med. Chem. Commun., 2010, 1, 30–38 RSC.
- L. Peltason, P. Iyer and J. Bajorath, J. Chem. Inf. Model., 2010, 50, 1021–1033 CrossRef CAS.
- J. L. Medina-Franco, K. Martínez-Mayorga, A. Bender, R. M. Marín, M. A. Giulianotti, C. Pinilla and R. A. Houghten, J. Chem. Inf. Model., 2009, 49, 477–491 CrossRef CAS.
- V. Shanmugasundaram and G. M. Maggiora, 222nd ACS National Meeting, Chicago, IL, United States, 2001. American Chemical Society, Washington, D.C., Meeting abstract CINF-032 Search PubMed.
- G. M. Maggiora, J. Chem. Inf. Model., 2006, 46, 1535–1535 CrossRef CAS.
- P. Willett, J. M. Barnard and G. M. Downs, J. Chem. Inf. Comput. Sci., 1998, 38, 983–996 CrossRef CAS.
- Molecular Operating Environment (MOE), version 2009.10, Chemical Computing Group Inc., Montreal, Quebec, Canada. Available at http://www.chemcomp.com (Accessed September, 2010) Search PubMed.
- M. Sastry, J. F. Lowrie, S. L. Dixon and W. Sherman, J. Chem. Inf. Model., 2010, 50, 771–784 CrossRef CAS.
- Canvas, version 1.3, Schrödinger, LLC, New York, NY, 2010 Search PubMed.
Footnote |
| † Electronic supplementary information (ESI) available: Chemical structures and activity of benzimidazoles (Table S1); correlation matrix for the pairwise molecular similarities (Table S2); pairwise molecular similarities as cumulative distribution functions (Figure S1), SAS maps with different representations (Figure S2), correlation between the pIC50 values for T. vaginalis and G. intestinalis (Figure S3), DAD map with data pairs color-coded using a continuous gray scale (Figure S4), SAS maps with data pairs color-coded using a continuous gray scale (Figure S5). See DOI: 10.1039/c0md00159g |
| This journal is © The Royal Society of Chemistry 2011 |

