Interactome-wide prediction of short, disordered protein interaction motifs in humans†‡
Richard J.
Edwards
*a,
Norman E.
Davey
b,
Kevin O'
Brien
c and
Denis C.
Shields
c
aCentre for Biological Sciences, University of Southampton, UK. E-mail: r.edwards@southampton.ac.uk; Fax: + 44 23 8059 4459; Tel: + 44 2380 594344
bStructural and Computational Biology Unit, European Molecular Biology Laboratory, 69117 Heidelberg, Germany
cUCD Complex and Adaptive Systems Laboratory & UCD Conway Institute of Biomolecular and Biomedical Sciences, University College Dublin, Ireland
First published on 30th August 2011
Abstract
Many of the specific functions of intrinsically disordered protein segments are mediated by Short Linear Motifs (SLiMs) interacting with other proteins. Well known examples include SLiMs that interact with 14-3-3, PDZ, SH2, SH3, and WW domains but the true extent and diversity of SLiM-mediated interactions is largely unknown. Here, we attempt to expand our knowledge of human SLiMs by applying in silicoSLiM prediction to the human interactome. Combining data from seven different interaction databases, we analysed approximately 6000 protein-centred and 1600 domain-centred human interaction datasets of 3+ unrelated proteins that interact with a common partner. Results were placed in context through comparison to randomised datasets of similar size and composition. The search returned thousands of evolutionarily conserved, intrinsically disordered occurrences of hundreds of significantly enriched recurring motifs, including many that have never been previously identified (http://bioware.soton.ac.uk/slimdb/). In addition to True Positive results for at least 25 different known SLiMs, a striking number of “off-target” proteins/domains also returned significantly enriched known motifs. Often, this was due to the non-independence of the datasets, with many proteins sharing interaction partners or contributing interactions to multiple domain datasets. The majority of these motif classes, however, were also found to be significantly enriched in one or more randomised datasets. This highlights the need for care when interpreting motif predictions of this nature but also raises the possibility that SLiM occurrences may be successfully identified independently of interaction data. Although not as compositionally biased as previous studies, patterns matching known SLiMs tended to cluster into a few large groups of similar sequence, while novel predictions tended to be more distinctive and less abundant. Whether this is due to ascertainment bias or a true functional composition bias of SLiMs is not clear and warrants further investigation.
Introduction
Since the discovery of the first domains, protein modularity has been central to the understanding of protein function. The basic functionality of the majority of proteins is mediated by the interaction of its modules with various other proteins. The range of functions a protein can carry out is closely linked to the number of modules it contains, be they domains,1–3 short linear motifs (SLiMs or LMs),4,5 or other molecular recognition features (MoRFs).6Protein domains, particularly those forming distinct three-dimensional structures, are relatively easy to find in silico and have rapidly accumulated in the literature over the past few decades, such that the majority of domains have now been discovered.1–3 Focus is now increasingly not only on structured regions of the proteome, but also on disordered regions7 in search of the more elusive modules.Many of the specific functions of intrinsically disordered protein segments are mediated by Short Linear Motifs (SLiMs). SLiMs are functional peptide microdomains, typically 3–10 amino acids in length, which usually occur in regions of intrinsic disorder.8,9 They are known to mediate many important protein-protein interactions in a variety of scenarios, including protein scaffolding (e.g. 14-3-3), intra- (e.g.PDZ) and extra-cellular signalling (e.g. integrin-binding RGD), control of gene expression (e.g. PBX Homeobox ligand), subcellular localisation (e.g. Golgi to ER retrieval), post-translational modification (e.g.phosphorylation) and cleavage (e.g. Taspase1).9 Through transient and low-affinity interactions, SLiMs can function as molecular switches and cooperatively regulate dynamic cell signalling events.10 Their ubiquity and importance has made them critical molecular targets for pathogens and predators, particularly viruses, which are known to mimic over 50 different eukaryotic host SLiMs.11 As key players in signalling pathways, SLiMs also represent important targets for diseases, both in terms of causal mutations and potential therapeutics.12
Annotation efforts over the last decade have provided high quality data for known SLiMs, with databases specifically focusing on phosphorylation13 and cleavage sites,14,15 in addition to classical ligand-binding SLiMs.4,5 With the exception of a few well-studied examples, however, we still know comparatively little about the abundance and variety of functional motifs. It is therefore of great interest to discover new interaction motifs that may form the basis of future reagents, including drugs, to disrupt or regulate important interactions.
Currently there is a disproportionate number of known domains (∼10![[thin space (1/6-em)]](https://www.rsc.org/images/entities/char_2009.gif) 000) compared to known SLiMs (∼200), suggesting that the difficulty involved in SLiM discovery is reflected in our knowledge of them. It was estimated that 15–40% of protein-protein interactions may be mediated by SLiMs8 but protein-protein interaction data does not reflect this; only 1% interactions detected in genome-scale human yeast-2-hybrid experiments12 and as little as 5% of all interactions contained in the Human Protein Reference Database (HPRD),16 which includes data derived from many low throughput SLiM discovery experiments, are mediated through known SLiMs.12 Previous attempts could explain only 19% of known interactions by known domain-domain interactions.17 This proportion will undoubtedly increase as more complex structures are solved experimentally but the capacity for SLiM-mediated interactions remains extensive. Furthermore, it is not unrealistic to hypothesise that a larger proportion of the undiscovered interactome may be SLiM-mediated than current trends suggest, since their low affinity and temporally transient activity may make them much more difficult to discover experimentally by current methods than domain-mediated interactions.
000) compared to known SLiMs (∼200), suggesting that the difficulty involved in SLiM discovery is reflected in our knowledge of them. It was estimated that 15–40% of protein-protein interactions may be mediated by SLiMs8 but protein-protein interaction data does not reflect this; only 1% interactions detected in genome-scale human yeast-2-hybrid experiments12 and as little as 5% of all interactions contained in the Human Protein Reference Database (HPRD),16 which includes data derived from many low throughput SLiM discovery experiments, are mediated through known SLiMs.12 Previous attempts could explain only 19% of known interactions by known domain-domain interactions.17 This proportion will undoubtedly increase as more complex structures are solved experimentally but the capacity for SLiM-mediated interactions remains extensive. Furthermore, it is not unrealistic to hypothesise that a larger proportion of the undiscovered interactome may be SLiM-mediated than current trends suggest, since their low affinity and temporally transient activity may make them much more difficult to discover experimentally by current methods than domain-mediated interactions.
Despite these challenges, advances in motif statistics,18,19 motif enrichment,20 dataset design21 and motif classification22,23 are enabling rapid motif discovery with ever-increasing accuracy. These tools are ideally suited to aid in the annotation of interaction data. The potential of interactome-wide in silico predictions of interaction motifs was demonstrated by Neduva et al.24 when they applied their LMD (a.k.a. DILIMOT25) motif prediction tool to the known interactomes of human, Drosophila melanogaster, Caenorhabditis elegans and yeast. Of the potential motifs returned, they validated two of the predictions using fluorescent polarisation to demonstrate specific binding between hub proteins and peptides corresponding to the predicted motif. This pioneering study, however, had several shortcomings: LMD does not allow amino acid ambiguity or flexible lengths in its returned motifs. Secondly, it returns the probability of a given motif occurring by chance, but not the chance of any motif occurring. More recent software, SLiMFinder,19 addresses these issues directly by incorporating ambiguity into SLiM predictions and calculating a significance value for each motif, which estimates with reasonable accuracy the probability of the dataset returning an apparently convergently-evolved motif of the same or greater over-representation by chance. This method has recently been improved by incorporating evolutionary information to mask residues based on their relative conservation.20
In this paper, we describe an attempt to mine the known interaction data for interacting modules by focusing on the discovery and rediscovery of SLiMs using these latest developments in SLiM prediction. We also enlarge the search space in humans by incorporating additional interaction data with eight distinct strategies of dataset compilation. We highlight important issues to be considered during in silicoSLiM discovery and have made our results available as a navigable online resource, which can be mined for predictions for specific proteins and provides an invaluable reference for future studies.
Results and discussion
Enrichment of significant results vs. expectation
To investigate the affects of dataset quality on the return of motifs, four different strategies were used to compile protein-protein interactions (PPI) for both protein- and domain-centred interactomes, giving eight different compilation strategies in total (Table 1). From hereon, these will be referred to as “ppi” (all known interactions), “y2h” (yeast-two-hybrid only), “bin” (binary-enriched) and “com” (complex-enriched), with the suffix “dom” indicating domain-centred datasets. (See Methods for details.)| PPI type | Datasetsa | Protein hubs analyseda | Significanta | Datasetsa | Domain hubs analyseda | Significanta |
|---|---|---|---|---|---|---|
| a Numbers of datasets for each PPI compilation strategy: Datasets, in total; Analysed, analysed with SLiMFinder (< = 1000 sequences, 3+ unrelated); Significant, returning 1+ significant results (p < 0.05). | ||||||
| ppi | 12207 |
7346 | 590 (8.0%) | 1759 | 1660 | 458 (27.6%) |
| y2h | 7392 | 2956 | 116 (3.9%) | 1255 | 1129 | 166 (14.7%) |
| bin | 10247 |
4880 | 193 (4.0%) | 1572 | 1539 | 212 (13.8%) |
| com | 8853 | 4832 | 266 (5.5%) | 1468 | 1342 | 294 (21.9%) |
The proportion of datasets returning motif predictions with a SLiMChance significance of p < 0.05 varied from 3.9%–8.0% for protein-centred datasets, and 13.8%–27.6% for domain-centred datasets (Table 1). Expected numbers of motifs returned at a given p value can be estimated by a simple product of the p value and the number of datasets analysed. Enrichment can then be defined as the ratio of observed results at a given p value to this random expectation. This expectation assumes that the SLiMChance algorithm is completely accurate in its estimation of significance on real data. In reality, SLiMChance is slightly stringent and has a tendency to under-estimate significance.18 Therefore, we also analysed datasets of equal size to the real data constructed using two different strategies: “rseq”, in which sequences were selected from the human proteome at random, and “rupc” in which clusters of related sequences from the “real” data where randomly shuffled to make new datasets. (See Methods for details.)
For all protein-centred PPI compilation strategies, the number of significant SLiMFinder predictions (p < 0.01) dramatically exceeded random expectation for the real data, whereas for random data it generally did not (Fig. 1). Apparent enrichment at p < 0.001 in random data was due to a very small number of datasets and was exceeded in every case by the corresponding set of real data. Domain-centred datasets returned a greater proportion of significant motifs than protein-centred datasets, although this difference diminished with increasing significance. Randomised domain-centred datasets show a similar pattern, indicating that dataset size may influence results. This is not surprising as SLiMChance has been shown to be more sensitive for larger datasets.19 This observation could also account for the apparent increased effectiveness of “ppi” and “com” datasets, which in turn tend to be larger than the “y2h” and “bin” datasets. To investigate this further, we compared the size distribution (in terms of Unrelated Protein Clusters (UPC)) of datasets returning significant motifs (p < 0.05) with those that do not. As predicted, within each class of dataset (PPI combination strategy and real/rseq/rupc), the datasets returning significant motifs tend to be larger than those that do not (data not shown). This is especially pronounced in random data.
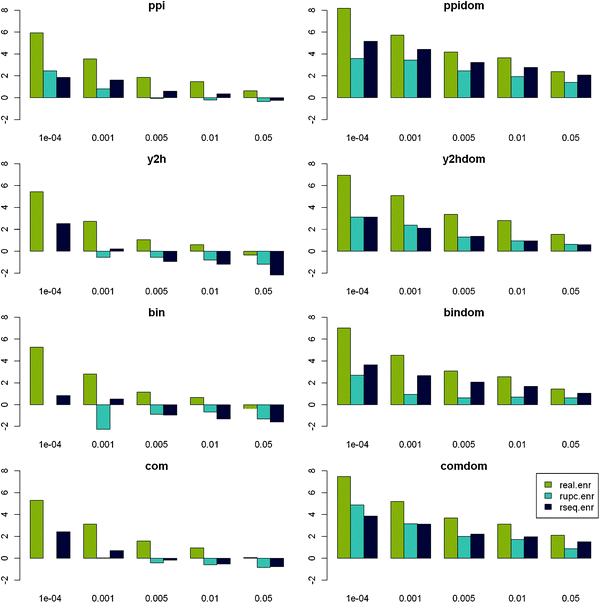 | ||
| Fig. 1 Enrichment of significant results vs. expectation. Log2 enrichment of datasets returning significant motifs vs. SLiMChance expectation is plotted against decreasing SLiMChance significance for Real (gold), RUPC (cyan) and RSeq (blue) datasets for each ppi compilation strategy. | ||
False discovery rates and motif numbers
For such a large analysis, Bonferroni corrections for multiple testing can be conservative. Instead, to gauge the overall enrichment of results, we have considered the False Discovery Rate (FDR) at a particular significance threshold. FDR is essentially the inverse of the motif enrichment ratio (See Methods). In total, 404 datasets across all sixteen PPI construction strategies returned predicted SLiMs at a FDR < 0.05. If accurate, this implies that over 380 of these motifs are genuine significant results. In contrast, from all sixteen randomisations, only 48 random datasets returned predicted SLiMs at a False Discovery Rate of 0.05. Of these, the majority (36) were from random sequence datasets for entire domain-based PPI networks, which again represent the largest datasets. FDR is obviously very dependent on the total number of datasets, which differs considerably between PPI strategies. When comparing individual predictions from different strategies, it is therefore more appropriate to use the SLiMChance “Sig” statistic. These data also violate the underlying assumption of independence that corrections for multiple testing make. For these reasons, we concentrate on the “Sig” statistic for the rest of this paper but caution the reader to be aware of the underlying multiple testing issue.Classification of motif predictions
In the absence of laboratory validation, the strongest evidence for a successful bioinformatics method is the recovery of known “True Positives” (TP) from realistic biological data. Each of the 3978 patterns returned by different datasets was compared to known SLiMs using CompariMotif26 and manually classified. Hubs returning known motifs were compared to annotations for known motifs, predominantly using ELM4 and MiniMotif Miner,27 to identify True Positives. This analysis returned (recognisable variants of) twenty-five known interaction motifs from interaction datasets assembled for 58 different proteins (22 motifs) and 16 different domains (15 motifs) (Table 2, and ESI, Table S1‡). The 58 TP from protein-centred datasets represent 22 different known SLiMs, while the 16 domain-centred TPs represent 15 different known SLiMs. Given that most SLiMs interact with domains that are found in multiple proteins, this difference in relative numbers of datasets compared to returned motifs is not surprising. The return of TP predictions also mirrors the overall trend regarding the different PPI compilation strategies, with the full PPI datasets returning most TP motifs. Interestingly, however, no single strategy returns all the TP motifs.| Motif | Description | Full PPIa | Y2H a | Binarya | Complexa |
|---|---|---|---|---|---|
| a No. gene/domain hubs returning significant predicted SLiM matching known motif. | |||||
| LIG_1433 | Dominant 14-3-3 ligand motif [HKR][ST].[ST].P | 6/1 | 2/1 | 2/1 | 6/1 |
| LIG_AP_GAE | Gamma-adaptin ear ligand motif [DE][DE][DE]F.[DE]F | 2/1 | 0/0 | 0/0 | 0/0 |
| LIG_BRCT | S..F phosphomotif interacting with BRCA1 | 1/0 | 0/0 | 0/0 | 0/0 |
| LIG_CtBP | P.DLS CtBP interaction ligand | 1/1 | 2/0 | 2/0 | 1/1 |
| LIG_CYC | Cyclin recognition motif, [RK].L | 0/1 | 0/0 | 0/0 | 0/1 |
| LIG_Dyn | K.TQT Dynein Light Chain ligand | 1/0 | 0/0 | 0/0 | 0/0 |
| LIG_EH | Canonical Eps15 homology (EH) domain binding motif, NPF | 2/0 | 0/0 | 0/0 | 0/0 |
| LIG_GoLoco | Part of G-protein G-alpha domain binding motif | 0/0 | 0/1 | 0/1 | 0/0 |
| LIG_PABPC1 | PABPC1 binding region | 1/1 | 0/0 | 1/1 | 1/1 |
| LIG_PCNA | Q...[IL]...FF PCNA ligand | 1/0 | 0/0 | 0/0 | 1/0 |
| LIG_PDZ | Canonical C-terminal PDZ motif [ST].[ILV]$ | 24/1 | 10/2 | 18/2 | 8/2 |
| LIG_PP1 | PP1 docking motif [RK].{0,1}[IV][⁁P][FW] | 1/0 | 1/0 | 1/0 | 0/0 |
| LIG_PTB | NP.Y Phosphotyrosine binding (PTB) motif | 1/0 | 0/0 | 0/0 | 1/0 |
| LIG_SH2 | SH2 domain ligand. Strongest Y.N, Y..Q and Y..P motifs only | 4/0 | 0/0 | 0/0 | 5/1 |
| LIG_SH3 | Canonical P..P SH3 ligand motif | 1/0 | 0/0 | 0/0 | 0/0 |
| LIG_WW_1 | PP.Y WW ligand motif | 0/1 | 0/0 | 0/1 | 0/0 |
| MOD_CAAXbox | Generic CAAX box prenylation motif C.[ILMV].$ | 1/1 | 0/0 | 1/0 | 0/0 |
| MOD_CK1 | S..[ST] Motif recognised by CK1 for Ser/Thr phosphorylation | 2/0 | 0/0 | 0/0 | 1/1 |
| MOD_CK2 | CK2 phosphorylation motif. [ST]...[DE] | 2/1 | 0/0 | 0/0 | 0/1 |
| MOD_GSK3 | [ST]...[ST] Site recognised by GSK3 for Ser/Thr Phosphorylation | 0/0 | 0/0 | 0/0 | 2/0 |
| MOD_PKB | R.R...[ST][⁁P] PKB Phosphorylation site | 2/1 | 0/0 | 0/0 | 1/0 |
| MOD_PKC | PKC phosphorylation motif, [ST].[KR] | 0/0 | 0/0 | 1/1 | 0/0 |
| MOD_STP | Common recurring phosphorylation motif [ST]P | 7/2 | 1/1 | 2/1 | 2/1 |
| MOD_SUMO | Canonical sumoylation motif, [AILMV]K.E (ELM MOD_SUMO) | 1/0 | 0/0 | 0/0 | 0/0 |
| Yxx# | Multifunctional Y..[ILMVF] motif, which includes ITAM, ITIM, ITSM, SH2 and endocytic targeting motifs | 8/1 | 2/0 | 2/0 | 5/2 |
Another typical statistic of interest is the return of known “False Positives” (FP), which are predictions known to be incorrect. At face value, this analysis returns a great number of motifs that appear to fall into this category. We have identified numerous different groups of motifs that we have classed as “Off-target or generic recurring” motifs, which are either returned by multiple datasets, or are known ELMs returned by the “wrong” dataset (Table 3). However, these are not FP motifs in the true sense of the term, in that many of them are either known, or highly likely, to be real SLiMs of biological importance. The “false” aspect of these predictions lies in the assumption that they are responsible for SLiM-mediated interactions with the PPI hub that returned the motif. This is explored further in subsequent sections.
| Motif | ppia | y2h a | bina | com a | Realb | RSeqc | RUPC c |
|---|---|---|---|---|---|---|---|
| a No. gene/domain hubs returning significant predicted SLiM matching known motif. b Total number of gene/domain hubs from real interaction datasets. c No. random gene/domain datasets returning significant predicted SLiM matching known motif. d Note that due to overlapping motifs, this total is an over-estimate. | |||||||
| LIG_1433 | 4/7 | 1/2 | 2/4 | 1/2 | 8/15 | 4/18 | 3/16 |
| LIG_AP_GAE | 3/1 | 0/0 | 0/0 | 2/2 | 5/3 | 0/0 | 6/2 |
| LIG_CYC | 5/3 | 0/0 | 2/1 | 5/1 | 12/5 | 0/0 | 2/2 |
| LIG_CtBP | 0/2 | 0/2 | 0/2 | 0/2 | 0/8 | 0/1 | 0/0 |
| LIG_EH | 1/0 | 0/0 | 0/0 | 0/0 | 1/0 | 1/1 | 2/0 |
| LIG_FHA | 8/3 | 2/0 | 2/0 | 3/0 | 15/3 | 7/11 | 6/10 |
| LIG_IQ | 3/9 | 3/3 | 3/5 | 1/5 | 10/22 | 11/18 | 3/7 |
| LIG_PABPC1 | 0/0 | 0/0 | 0/1 | 0/1 | 0/2 | 0/0 | 0/1 |
| LIG_PCNA | 1/0 | 0/1 | 0/1 | 0/0 | 1/2 | 1/0 | 0/0 |
| LIG_PDZ | 3/15 | 2/11 | 1/10 | 2/6 | 8/42 | 5/15 | 1/3 |
| LIG_PP1 | 0/0 | 1/1 | 0/1 | 0/0 | 1/2 | 0/1 | 0/0 |
| LIG_PTB | 0/0 | 0/0 | 0/0 | 0/0 | 0/0 | 0/1 | 1/0 |
| LIG_RGD | 1/1 | 0/0 | 0/0 | 1/1 | 2/2 | 0/0 | 0/0 |
| LIG_SCF | 0/0 | 0/0 | 0/0 | 1/1 | 1/1 | 0/0 | 0/0 |
| LIG_SH2 | 2/1 | 1/0 | 2/0 | 0/4 | 4/5 | 1/3 | 2/0 |
| LIG_SH3 | 9/22 | 2/9 | 2/18 | 3/10 | 16/59 | 1/18 | 7/16 |
| LIG_WW_1 | 1/1 | 0/0 | 0/1 | 0/0 | 1/2 | 0/0 | 0/0 |
| MOD_CAAXbox | 0/0 | 0/0 | 0/0 | 0/0 | 0/0 | 0/5 | 1/1 |
| MOD_CK1 | 5/8 | 1/3 | 1/3 | 2/9 | 9/23 | 5/22 | 21/9 |
| MOD_CK2 | 10/18 | 1/5 | 2/6 | 6/10 | 19/49 | 16/36 | 10/14 |
| MOD_CamKII | 2/1 | 2/1 | 2/2 | 3/0 | 9/4 | 3/5 | 3/1 |
| MOD_GSK3 | 9/12 | 0/3 | 2/6 | 1/17 | 12/38 | 7/24 | 12/20 |
| MOD_NGLC | 5/1 | 1/0 | 1/0 | 3/2 | 10/3 | 7/24 | 5/6 |
| MOD_PIKK | 0/0 | 0/1 | 0/0 | 1/0 | 1/1 | 2/3 | 0/0 |
| MOD_PKA | 2/0 | 0/0 | 0/0 | 1/0 | 3/0 | 1/0 | 1/0 |
| MOD_PKB | 6/5 | 1/1 | 1/3 | 5/2 | 13/11 | 0/4 | 0/6 |
| MOD_PKC | 1/1 | 0/1 | 0/0 | 1/0 | 2/2 | 3/0 | 1/1 |
| MOD_PLK | 1/0 | 0/0 | 0/0 | 0/0 | 1/0 | 2/1 | 3/1 |
| MOD_SDE | 10/20 | 3/5 | 2/7 | 5/17 | 20/49 | 11/27 | 8/8 |
| MOD_STP | 16/31 | 5/10 | 4/21 | 4/16 | 29/78 | 3/26 | 10/35 |
| MOD_SUMO | 12/17 | 5/4 | 5/2 | 6/11 | 28/34 | 1/1 | 0/1 |
| TRG_KDEL | 12/10 | 2/3 | 1/2 | 10/12 | 25/27 | 0/0 | 0/0 |
| Yxx# | 3/4 | 1/0 | 1/0 | 0/1 | 5/5 | 7/4 | 5/4 |
| CxxC | 3/6 | 1/3 | 1/4 | 1/4 | 6/17 | 3/3 | 3/2 |
| RGR | 1/13 | 0/4 | 0/2 | 3/7 | 4/26 | 1/1 | 0/2 |
| WALKER | 6/16 | 0/0 | 0/0 | 5/8 | 11/24 | 4/5 | 1/5 |
| diKR | 39/72 | 3/8 | 6/20 | 10/46 | 58/146 | 24/82 | 18/41 |
| pST | 75/38 | 14/20 | 29/18 | 25/29 | 143/105 | 147/137 | 135/93 |
| pY | 16/5 | 7/2 | 10/3 | 7/1 | 40/11 | 59/52 | 34/29 |
| TOTAL d | 275/343 | 59/103 | 82/143 | 118/227 | 533/826 | 337/549 | 304/336 |
The PCNA ligand motif as a case study
Often, “off-target” motifs are an artefact of the complex non-independence of the PPI datasets themselves. (This also makes the correction for multiple testing very difficult.) This is exemplified by the PCNA ligand motif, Q...[IL].FF. The PCNA hub returns the TP ligand motif for two of the four PPI compilation strategies (“ppi” and “com”, Table 4). At the time of writing, ELM4 defines the ligand motif (LIG_PCNA) as (⁁{0,3}|Q).[⁁FHWY][ILM][⁁P][⁁FHILVWYP][DHFM][FMY]... and lists nine human occurrences (Fig. 2). Of these, eight contain occurrences of SLiMFinder predictions that are variants of the known motif (Fig. 2, and ESI, Table S2‡). Of these, five return the strong Q...[IL]...FF motif, while three return a weaker [ILV]...[FHY]F or [ILV]...[FWY]F variant. In all but one case, the predicted motif matches the annotated ELM. The exception is the Werner syndrome ATP-dependent helicase WRN, which returns occurrences of weaker variants at positions 540 and 1407 rather than the annotated occurrence at position 144. Curiously, WRN features a reasonably conserved glutamine three positions N-terminal of the leucine at position 540 (Fig. 3), rather than two residues N-terminal as in the ELM definition. Whether this represents a new variant of the PCNA ligand, or is simply a chance occurrence of a similar conserved pattern, is not clear. The ninth annotated ELM occurrence, in Cyclin-dependent kinase inhibitor 1 (CDKN1A), is not returned by SLiMFinder because, unlike the other occurrences of the motif, the central (iso)leucine ([IL]) is a methionine (M) and the second phenylalanine (F) is a tyrosine (Y) in this protein (ESI, Fig. S1‡). The homologous protein Cyclin-dependent kinase inhibitor 1C (CDKN1C), however, does return the [ILV]...[FHY]F motifs (ESI, Table S2‡). This occurrence is clearly homologous to the ELM occuurence in CDK1NA (data not shown) but CDK1NC has a glycine where the conserved glutamine should be and so it is not clear whether this occurrence could function as a PCNA ligand. Indeed, the presence of a proline between the glutamine and [ILV]...[FHY]F motif raises further doubts over whether the CDKN1C sequence (GPLISDFF) could bind PCNA. Crucially for the return of off-target motifs, four of the proteins containing occurrences of the Q...[IL]...FF motif also interact with the protein DNA-(apurinic or apyrimidinic site) lyase (APEX1) (Fig. 2). At least three of the SLiM occurrences returned by the APEX1 dataset are therefore “True Positives” in the sense of being real functional motifs, even though they are “False Positives” in the sense that they interact with PCNA rather than APEX1.| PPI a | Nb | Cloudc | Motifd | Rankd | Sigd | Supportd |
|---|---|---|---|---|---|---|
| a PPI compilation strategy. b Number of PCNA-interactors in dataset. The number of UP clusters is given in brackets. c Cloud of overlapping motifs. Numbers in brackets indicate numbers of different sequences and UP clusters containing motifs in the cloud. d Predicted motifs: returned pattern, rank in dataset, SLiMChance significance, motif support (no. occurrences/no. sequences/no. UP). | ||||||
| Full PPI | 112 (74) | 1 (9/8) | Q...[IL]...FF | 1 | 4.3 × 10⁻⁸ | 8/8/7 |
| Q.[ST].[IL]...FF | 2 | 4.3 × 10⁻⁴ | 4/4/4 | |||
| TL.SFF | 3 | 0.044 | 3/3/3 | |||
| Complex | 91 (62) | 1 (19/16) | Q...[IL]...FF | 1 | 1.5 × 10⁻⁸ | 8/8/7 |
| Q.[ST].[IL]...FF | 2 | 2.7 × 10⁻⁴ | 4/4/4 | |||
| I...FF | 3 | 0.003 | 7/7/7 | |||
| [ILV]...[FWY]F | 5 | 0.006 | 20/18/15 | |||
| [ILV]...[FHY]F | 6 | 0.019 | 20/18/15 | |||
| TL.SFF | 7 | 0.030 | 3/3/3 | |||
| Q...L...FF | 8 | 0.034 | 5/5/4 | |||
| 2 (13/13) | D[FILV].N | 4 | 0.005 | 14/13/13 | ||
| Binary | 24 (18) | — | — | — | — | — |
| Y2H | 22 (17) | — | — | — | — | — |
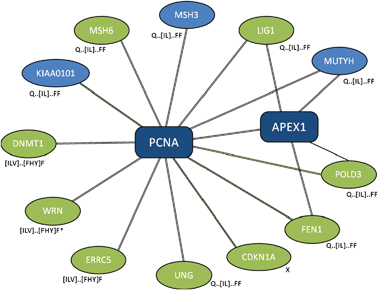 | ||
| Fig. 2 Subset of PCNA interaction dataset returning LIG_PCNA ELM. Selected proteins that interact with proliferating cell nuclear antigen (PCNA) with evidence types. Black double-line, “complex-enriched” interaction; green dashed line, yeast-two hybrid; single black line, other interaction evidence. With the exception of APEX1, interactions between spokes are not shown. Spokes containing annotated occurrences of the ELM LIG_PCNA are highlighted in green. Variants of the LIG_PCNA SLiM returned by SLiMFinder analysis are shown next to each hub. *, WRN returns LIG_PCNA variants but the positions of the two occurrences do not match that in the ELM database. | ||
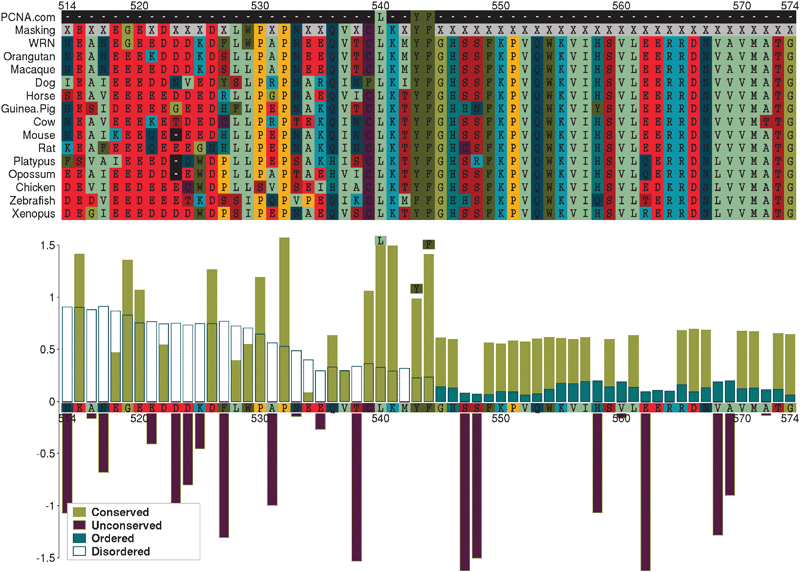 | ||
| Fig. 3 Predicted LIG_PCNA occurrence in WRN. The upper panel shows an alignment of a region of human Werner syndrome, RecQ helicase-like (WRN) with predicted vertebrate orthologues, centred on the SLiM occurrence. The lower panel plots Relative Local Conservation (RLC) and IUPred disorder prediction scores for each residue. Residues designated “unconserved” (RLC < 0) and/or “disordered” (IUPred < 0.2) were masked out of the analysis (X in the “Masking” row of the alignment). | ||
In addition to the five Q...[IL]...FF occurrences that are known ELM occurrences, the PCNA interactome returns three additional Q...[IL]...FF occurrences in PCNA-associated factor p15PAF (KIAA0101), DNA mismatch repair protein MSH3 and A/G-specific adenine DNA glycosylase (MUTYH) (Fig. 2). Given the size and composition of the PCNA interactome, the expected number of occurrences of the Q...[IL]...FF motif is 0.035 (data not shown); it is highly probable that these represent true PCNA ligand occurrences. Indeed, one of the three, MSH3, is clearly homologous to an occurrence annotated in ELM in the yeast MSH3 protein (data not shown), while MSH3 itself is homologous to MSH6, which is known to interact with PCNA through the PCNA ligand SLiM (Fig. 2).
The PCNA dataset is also informative about how small changes to the composition or masking of the interaction datasets can affect the SLiM predictions returned. Whilst both the “ppi” and “com” datasets return the core Q...[IL]...FF motif and two other variants (Q.[ST][IL]...FF and TL.SFF) with similar significance, the “com” dataset also returns another four variants of the PCNA ligand as well as an unknown motif D[FILV].N (Table 4, and ESI, Table S2‡). Since, by definition, the full PPI dataset contains all the proteins returning these motifs, the shift into significance for these motifs is purely the result of a reduction in the number of proteinsnot containing the SLiM. On the other hand, the “bin” and “y2h” datasets do not return any significant motifs, including the Q...[IL]...FF TP, which is a result of losing a number of ligand-containing interactors through the interaction filtering (Table 4, Fig. 2).
The importance of quality input data
SLiM discovery from PPI data is a fine balance between the signal provided by interactors that contain the SLiM and the noise of randomly recurring motifs returned (or, more accurately, expected) from all interactors, whether they contain the true SLiM or not. Over-zealous inclusion of predicted interactors that, in reality, are not true direct interactors of the hub (and therefore cannot interact with it through a SLiM) serve to add noise, which can drown out the signal; on the other hand, over-zealous removal of proteins not known to be direct interactors can remove too much of the signal (ESI, Fig. S2‡).In an attempt to investigate this affect, four different PPI compilation strategies were applied to the human PPI data (ESI, Fig. S3‡). Datasets constructed with all four strategies successfully return known motifs (Table 2, and ESI, Table S1‡). The simplest approach (“ppi”), in which all interactors are included, seems to be the most successful, returning the most True Positives (Table 2) and the highest proportion of significant results in total (Table 1, Fig. 1). These datasets obviously have more proteins than the other strategies and this result indicates that SLiMFinder is more sensitive to a reduction in signal than a reduction of noise.
The increased return of significant results from larger datasets also raises the possibility that many of the datasets are right on the cusp of motif detection. This is exemplified by the return of the CAAX box motif (C.[IL].$) from PDE6D (Table 2, p = 3.33 × 10⁻⁶, FDR = 0.001). Of the 26 PDE6D interactors, nine returned occurrences of the CAAX box motif (Fig. 4). However, only one of the three subset strategies returns the motif with significance (p < 0.05, Table 2). This is because, in each case, interactors returning the motif are removed by the filtering process (ESI, Fig. S3‡) and, even though a number of occurrences remain in each case (“bin”, 6/23; “y2h”, 5/22; “com”, 3/6), there is not enough signal to overcome the random expectation. This emphasises the importance of interactome coverage and the need for care to be taken when filtering proteins out of the interaction data.
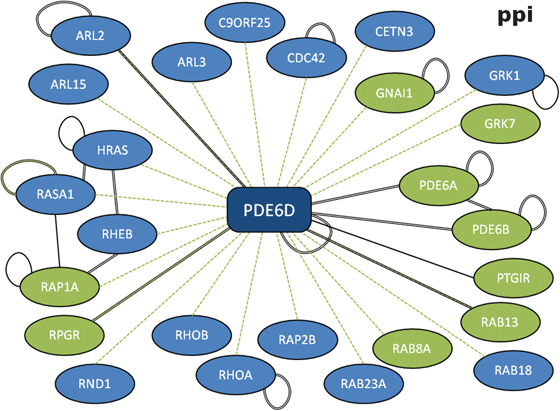 | ||
| Fig. 4 Protein-protein interaction network for PDE6D. Full compiled interactome for retinal rod rhodopsin-sensitive cGMP 3′,5′-cyclic phosphodiesterase subunit delta (PDE6D) with evidence types. Black double-line, “complex-enriched” interaction; green dashed line, yeast-two hybrid; single black line, other interaction evidence. Spokes returning the CAAX box motif are highlighted in green. | ||
Enrichment of significant motifs in domain-based datasets
Domain datasets yield considerably more significant results (as a percentage) than protein-based datasets. Worse, randomised domain-based datasets yield more motifs than expected by chance, whereas protein-based datasets generally do not (Fig. 1). This can be explained to an extent by the relationship between dataset size (UP) and return of significant motifs. The effect is especially pronounced in random data, supporting the notion that many of these results might in fact be the random bringing together of genes containing frequently recurring biological motifs – the larger the dataset, the more chance of bringing together such sequences.The second factor in the enrichment of motifs in the real domain-based datasets is the multi-domain nature of many human proteins and recurring domain architecture, which means that many domain-based datasets will return motifs that interact with different domains that co-occur in proteins. This explains the even more pronounced return of off-target and generic recurring motifs from domain datasets compared to protein datasets; even though there are less domain datasets, more of them (in absolute terms) return such motifs (Table 3).
Results for real datasets are enriched for novel motifs
Apart from the enrichment related to dataset size, are the different PPI strategies returning results that are qualitatively different in nature to each other, or the random data? Although the presence of predictions with highly significant FDR indicates that they are, a major drawback of the FDR calculation is that it can be artificially inflated by the presence of True Positives. To assess this, any motifs identified as True Positives, off-target motifs or generic recurring motifs were removed. (Obviously, random data only has the latter two types of motif.) The ratio of real:random motifs returned at different levels of SLiMChance significance was then used to investigate whether there was still an enrichment of motifs from the real data, indicating that there might be genuine novel motifs in the results. Because the high significance motifs (p < 0.001) are dominated by True Positives and off-target known motifs, it is not surprising that there is little or no enrichment at this stringency once these motifs have been removed. In the mid range of significance values (0.001 < p < 0.01), however, real results are enriched by up to one order of magnitude over random datasets, with the yeast-2-hybrid and binary-enriched datasets being most enriched (data not shown). The exception seems to be the “ppidom” datasets, which have proportionally few motifs left once the True Positives, off-target and generic motifs have been removed.Candidate novel motifs
It is beyond the scope of this paper to examine specific novel motif predictions in detail; without laboratory experimental validation, support for individual predictions can be anecdotal at best. One of the major challenges of validating predictions from this study comes from the highly interconnected nature of the interactome previously discussed; just as known motifs are returned by “off-target” hubs, we cannot have the desired confidence that the hubs returning novel motifs are likewise not “off-target” even if the motif itself is a functional SLiM. It is also inevitable that, with a study of this size, a number of the novel motif predictions will turn out to be false positives in the true sense. This is not to say, however, that we do not feel there are any genuine novel motifs within the results.Although it is obviously tempting to equate SLiM predictions from randomised datasets with “random noise”, this is not strictly true. Just as the results from real datasets are dominated by “off-target” and “generic” motifs that represent genuine SLiMs, albeit SLiMs that do not (as far as we know) interact with the specified hub protein/domain, it is important to conceptually distinguish stochastic over-representation of a genuine SLiMversus pure noise in randomised datasets. In the former case, the random element driving the false discovery is the combination by chance of a number of proteins containing the same real SLiM (e.g. the WALKER motif). In the latter case, the random element is coincidental combinations of amino acids. Because over-representation of a SLiM in a whole proteome is going to increase its chances of stochastic over-representation in a subset of proteins, it is not surprising that a substantial proportion of results returned by randomised datasets correspond to “off-target” motifs. This includes 77% of the random results at FDR < 0.05. Interestingly, three of the remaining eleven random motifs (FDR < 0.05) are the LQxxL motif, returned by different random datasets. In total, this motif is returned by seven different random datasets and ten real domain interactome datasets. It is highly probable, therefore, that this represents another recurring motif of genuine biological significance. The motif itself shows similarity to part of the core alpha helical section of the Ubiquitin Interaction Motif (UIM) PFam domain (ESI, Fig. S4‡) and LQxxL is the top ranked motif returned by the ubiquitin domain binary-enriched dataset. Occurrences in ubiquitin interactors are generally lacking the characteristic charged flanking regions of the UIM, however, and only one confirmed UIM protein (ATXN3) is among the 33 LQxxL containing spokes in this dataset. Given the overall abundance of this motif, which in total is returned in 435 different spoke proteins across the 17 significant datasets, it is unlikely to be a specific ligand although, given the ubiquitous nature of ubiquitin, we cannot rule out the possibility that it represents a novel core ubiquitin binding motif that is related to the UIM sequence.
Another important implication of these observations is that the return of a particular motif from random data does not necessarily rule that motif out as being a stochastic false positive when it is returned in real datasets. This is embodied by the PABPC1 interaction motif (S.L...NA.EF) that, in addition to being returned by the PABPC1 interactome and the two domains found in PABPC1 (PABP and RRM_1), is returned by one random dataset (p = 0.015) that happens to contain three otherwise unrelated interactors of PABPC1 (ATXN2, PAIP2, TOB1) (ESI, Fig. S5‡). A future challenge of interpretation will be taking candidate SLiMs and predicting their true functional significance. To aid this endeavour, all motif predictions from this analysis have been made available as ESI‡ and an interactive database (http://bioware.soton.ac.uk/slimdb/). This resource will continue to be updated and annotated as literature and/or experimental support for given motifs becomes available. Clues to function may also be gained by searching the motif against the whole proteome and looking for enriched biological functions associated with evolutionary conserved occurrences.28
Recurrence of common core motifs
Visual inspection of the motifs returned identified a trend that certain amino acid combinations tended to occur in the results a lot more than others and, furthermore, previously identified SLiMs tended to occur within larger “clouds” of similar motifs (see Methods) when compared to candidate novel motifs. Combinations of serine with charged amino acids are particularly prevalent, for example. Due to the prevalence of phosphorylation motifs in the proteome, this bias is not surprising but the general trend of larger clouds for known motifs and smaller clouds for novel motifs still needs explaining. At least three factors could be reponsible, either independently or in combination:1. Ascertainment bias. It is inevitable that known SLiMs are likely to have more examples in the PPI network. This is both because more abundant SLiMs are more likely to be discovered and, once discovered, knowledge of SLiMs can be used to identify additional interactors. It is also likely that functional studies are enriched in regions with an existing known function, increasing the chance of discovering a second motif in the same place.
2. Physiochemical bias. A more interesting explanation is that there is an inherent bias in the combinations of amino acid that can be successfully employed as a functional SLiM. If true, many motifs share the same core signature, which might make it easier to distinguish true SLiMs from randomly occurring patterns. At the same time, however, it will make distinguishing motifs much harder as there will be fewer distinct residues conferring specificity.
3. Regulatory bias. Molecular signalling switches might rely on competitive binding for overlapping SLiMs. Such motifs will not only share some common residues but will also co-occur in the very same proteins, which might make them even harder to distinguish.
In an attempt to get a better handle on the relationship between motifs, a network analysis was performed using CompariMotif26 relationships between the patterns returned by “Real” datasets (p < 0.01) (Fig. 5). As expected from the motif “cloud” data (which, in contrast to CompariMotif, requires co-occurrence in addition to pattern similarity), several clusters of patterns were formed (ESI, Table S3‡). The largest of these are dominated by TP motifs. While a subset of novel motifs do cluster with the TP SLiMs, the majority either form small clusters with each other or do not cluster with any other motifs. The contrast between the TP and novel motifs is seen more clearly when their networks are investigated separately (Supplemental Fig 7). This favours one of two explanations:
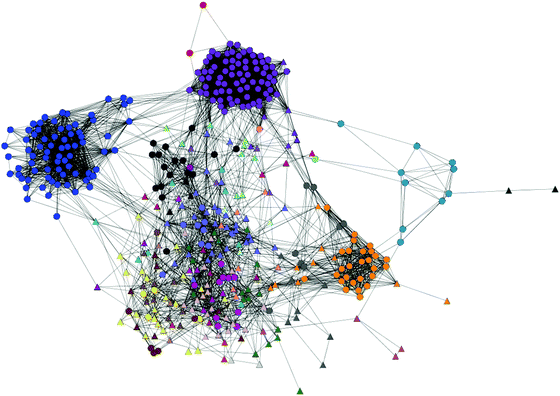 | ||
| Fig. 5 MCL clustering of TP and novel motifs based on CompariMotif similarity. Each node represents a motif. Circles, TP; Triangles, Novel. Each colour is a different MCL cluster. Details of clusters can be found in the ESI, Table S3.‡ | ||
1. There is heavy ascertainment bias in terms of motif composition for the known motifs; novel motifs represent entirely new classes of SLiM.
2. Certain amino acid combinations are enriched for functional reasons; novel motifs with these amino acids are more likely to be functional SLiMs, while the motifs with a very different composition are more likely to be false positives.
Resolving this issue will need more data on the nature of SLiM-mediated interactions and whether any specific physical or chemical properties are universally favoured. Such analysis is beyond the scope of this paper. It is not surprising that the largest clusters of motifs, spanning many interaction hubs, have been identified by biochemical means in the past, while the remaining novel motifs are members of much smaller groupings. A subset of the novel motifs likely represent false positives, however, which may be occupying regions of motif space that are not favourable for ligand-binding motifs. These data do highlight an important question that has widespread consequences for future motif discovery: common as they are, are SLiM-mediated PPI dominated by a handful of common motifs types? Or, is the current repertoire of known SLiMs just the tip of the iceberg? In other words, should we concentrate on looking for more of the same, or are there whole new classes of SLiM out there waiting to be discovered? Furthermore, if there are no strong constraints on what sequence can potentially function as SLiMs, can we expect large numbers of unique motifs that only mediate a single PPI pairing? Mining the natural interactome for recurring patterns will never recover such motifs; instead, PPI networks will need to be supplemented by phage display or peptide library screens to identify other, non-native, sequences that can bind the same targets. Alternatively, methods that look for SLiM-like sequence fingerprints in individual proteins6,29 may be able to identify singleton SLiMs, even if they cannot predict the PPI partners.
Comparisons with previous analyses
It is of interest to know how these results compare to the previous analysis of Neduva et al.24 Out of the 690 motif predictions (422 distinct patterns) provided in Table S1 of Neduva et al., only 37 (24 patterns) have an exact match in our analysis. At face value, this seems like a disturbingly small number. However, it must be remembered that there are many important differences between DILIMOT and SLiMFinder. To control the size of the motif space searched, SLiMFinder (in this analysis) was limited to a maximum wildcard length of two. This immediately rules out 271 results (170 patterns) from the Neduva et al. study, which have wildcard spacers of 3+. Relaxing the match criteria to allow completely overlapping motifs where one is a subset or (for degenerate motifs) variant of the other, increases the number of common predictions to 179 (99 patterns), which is approximately 25% of their human motifs.It is also clear that the results of Neduva et al. are biased in a way that the results presented here are not, with a strong tendency to return proline-rich motifs. 436/690 (63%) DILIMOT predictions (226/422 (54%) patterns) contain one or more prolines, compared to 379/3990 (9.5%) SLiMFinder patterns. Serine enrichment is also strong, with 244 (35%) predictions (149 (35%) patterns) versus 955 (24%) for SLiMFinder. Only 118/422 (28%) DILIMOT patterns have neither a proline or serine, compared to 2862 (78%) SLiMFinder patterns. The reasons for this are not clear but at least part of the explanation no doubt lies in the fact that a low complexity filter was applied to this analysis and both prolines and serines have a tendency to occur in low complexity runs. Low complexity motifs of this nature are also more likely to be rediscovered in homologous proteins than more specific motifs and so are probably further enriched in the DILIMOT analysis, which uses rediscovery in mouse to weight results.
Future work
The current analysis uses a fairly indiscriminate compilation of the interactome databases. The different PPI compilation strategies used here, including attempts to enrich for binary interactions, give great insights into the relative trade-offs of inappropriately adding or removing interaction partners. There are three key lessons to be learnt from the sensitivity of some of the results to losing a few interactors (e.g. the PDE6D CAAX box). First, future methods for compiling interaction data for SLiM discovery need to be very careful about the erroneous removal of true interactors. Second, the addition of one or two extra SLiM-mediated interactors (from additional interaction data) may, in future, be enough to raise the signal above the noise for some of the datasets that are currently not returning motifs. Third, even small improvements in the masking of disorder and/or conservation that add one or two additional occurrences for a motif might be the difference between significance and non-significance. Throughout this analysis, IUPred30 disorder prediction has been used with a rather conservative cut-off for masking. Being conservative in terms of such masking is sensible for two reasons: (1) as noted, SLiMFinder is more tolerant of excess noise than loss of signal; (2) it has been shown that, while SLiMs generally occur in regions of native disorder, the important residues have a propensity towards structure,31 characteristic of disordered “Molecular Recognition Features” (MoRFs) that undergo a disorder-to-order transition upon binding.6 If it can be done without losing too much signal, incorporating techniques that explicitly characterise32 or predict such binding sites (e.g. ANCHOR29 or PONDR-RIBS33) could substantially improve disorder masking.As these methods are honed, the potential of SLiM discovery will continue to improve by increasing the motif signal. Furthermore, as the level and quality of annotation and cross-talk between databases increases with the implementation of data standards (HUPO, PSIetc.), it should be possible to improve things further by reducing noise and increasing the quality of datasets by including only directly interacting proteins. Background noise can be reduced further still by focusing analysis on the specific protein regions known to be responsible for interacting with the hub protein/domain. Again, this will become increasingly possible as the quantity and quality of interaction data continue to improve. A particular problem with eukaryotic datasets is the presence of many multi-domain proteins that can draw together several sub-networks of the interactome into large overlapping interaction datasets. This contributes greatly to the return of off-target motifs (Table 3). Methods that can partition protein interactions by domain should greatly enhance both the sensitivity and specificity of motif prediction for domain-centred interaction datasets.
Methods
Human sequence data
To maximise genome coverage while minimising redundancy, a dataset consisting of one protein sequence per protein-coding gene was constructed from the EnsEMBL human genome, release 53.34 This was performed by mapping all EnsEMBL human peptides onto their genes and assessing them in the context of the external database entry used as evidence for that gene. If the external database was SwissProt35 and one of the peptides has the exact same sequence as the SwissProt sequence, this peptide sequence was used for that gene. In all other cases, the longest peptide (in terms of non-X amino acids) was used. The only exception to this was the rare situation where the “best” EnsEMBL sequence had a run of 20+ consecutive Xs and the mapped UniProt sequence (SwissProt orTrEMBL) had more non-X amino acids than it. In this case, the sequence was replaced by the UniProt sequence.Orthologous sequence alignments
To assess SLiM conservation, a multiple sequence alignment (MSA) was constructed for each human sequence and its putative orthologues. Orthologue MSAs were generated with GOPHER,36 using a search database that consisted of 45 metazoan EnsEMBL genomes, which had been treated in the same way as the human dataset to generate a single protein sequence per gene for each species. GOPHER uses BLAST37 to identify homologues for each sequence, converting BLAST hits into estimates of global percentage identity using GABLAM.38 Putative orthologues were retained using the following criteria:1. The human query sequence had a minimum global (GABLAM ordered) similarity of 40% with the orthologue.
2. The query has a higher percentage similarity to the orthologue than any other sequence of the same species.
3. The orthologue has a higher percentage similarity to the query than to any other human sequence.
4. If (3) is not met, the orthologue must be ancestral to a duplication event involving the query. In this case, the closest human paralogue to the sequence and the query must be more similar to each other than either is to the orthologue. (See GOPHER documentation for details.)
Putative orthologues were then aligned using MAFFT.39
Protein-protein interaction data
Protein-protein interaction (PPI) data was downloaded (5 May 2009) from HPRD,16 BioGRID,40 Domino,41MINT,42 Reactome,43DIP44 and IntAct.45 To remove redundancy, all interactions were mapped onto HGNC gene symbols46 or EnsEMBL genes, using data downloaded from HGNC, HPRD, UniProt and EnsEMBL. All genes that could be mapped onto an EnsEMBL protein in the human genomic dataset were then used to make datasets of interacting proteins for each gene. In total, 197030 pairwise PPI were compiled for 12266 human genes. Interaction evidence was then used to generate four different interaction datasets (Table 1, and ESI, Fig. S3‡):
1. All PPI (“ppi”). All evidence codes were used, except “indirect_complex” and “neighbouring_reaction”.
2. Yeast-2-Hybrid (“y2h”). Only PPI supported by the following evidence codes were retained: “2 hybrid”, “two hybrid”, “two hybrid array”, “two hybrid pooling”, “two hybrid pooling approach”, “two hybrid fragment pooling approach”, “two-hybrid” and “yeast 2-hybrid”.
3. Binary-enriched (“bin”). All mutually interacting sets of three proteins (where A interacts with B & C and B also interacts with C (and A, B & C are all different)) were removed from the PPI dataset. Any Yeast-2-Hybrid PPI that had been removed were added back in.
4. Complex-enriched (“com”). Only PPI supported by the following evidence codes were retained: “affinity capture-luminescence”, “affinity capture-ms”, “affinity capture-western”, “anti bait coimmunoprecipitation”, “anti bait coip”, “anti tag coimmunoprecipitation”, “anti tag coip”, “coimmunoprecipitation”, “coip”, “complex”, “direct_complex”, “gst pull down”, “his pull down”, “mass spectrometry studies of complexes”, “pull down”, “reconstituted complex”, “tandem affinity purification” and “tap”.
Domain-based datasets
All human proteins were analysed for protein domains using a HMMER247 search of PFam LS HMMs.1 For any domains found in 2+ proteins with PPI data, the interactors of proteins containing that domain were combined into a single domain-centred dataset. (To reduce unnecessary redundancy, any domains found in only a single protein with PPI data were ignored as these datasets would be, by definition, the same as for the single protein.)SLiM prediction
SLiMFinder19 was run on each dataset using default settings unless otherwise stated. In each case the following masking strategies were applied to the input sequences (SLiMFinder parameters in square brackets; see SLiMFinder documentation for details) [masking=T]:• N-terminal methionines were masked, as were alanines at position 2, which are also very common [metmask=T posmask=2:A].
• Because of the large number of datasets being analysed, the default complexity filter of 5 identical amino acids (aa) in an 8 aa window was made slightly stricter for this analysis at 4 aa in a 6 aa window [compmask=4,6].
• Disorder masking of regions using IUPred.30 Disorder was predicted at an IUPred cut-off ≥ 0.2, with a minimum (dis)ordered region length of five consecutive residues [dismask=T iucut=0.2 minregion=5].
• Conservation masking using the Relative Local Conservation strategy of Davey et al.20 for sequences with 3+ GOPHER orthologues (see above). Only orthologues with fewer than 10 undefined (“X”) residues and 20% gaps relative to the query were used [consmask=T conscore=rel vnematrix=blosum62.bla minhom=3 homfilter=T maxx=10 maxgap=0.2].
SLiMBuild used the default settings, allowing wildcard spacers of up to two consecutive wildcards and extending motifs up to five defined positions [maxwild=2 slimlen=5]. Ambiguous positions were permitted with the following “equivalency groups” of amino acids that could be combined into a single ambiguous position: ILMVF, FYW, FYH, KRH, DE, ST. Each ambiguous motif variant had to occur in at least two unrelated sequences, while each predicted SLiM returned had to occur in at least three unrelated proteins [ambocc=2 minocc=3]. Flexible-length wildcards were not permitted in this analysis [wildvar=F]. The SLiMFinder walltime was disabled [walltime=0] but analyses were limited to datasets with less than 1000 proteins [maxseq=1000].
SLiM prediction significance
For SLiMChance probability calculations, post-masking aa frequencies for each UPC were used [maskfreq=T smearfreq=F]. To be returned, a predicted SLiM needed a SLiMChance significance ≤ 0.05 and more than two non-wildcard positions (or the equivalent) [probcut=0.05 minic=2.1]. Several studies have used the motif count-based hypergeometric test against a background determined by the rest of the proteome to calculate the significance of motif enrichment.48 However, in our analysis, we chose to use the SLiMFinder (SLiMChance) treatment of statistical significance as we were concerned with problems of false signals arising from the lack of compositional uniformity of the proteome, and other biases. Protein attributes can vary greatly between test sets and background sets in terms of amino acid composition, disorder content and protein length, thereby distorting motif counts. Furthermore, homologous groupings of proteins can highly enrich motifs, particularly rare motifs with high information content. Our previous work has introduced a binomial test that largely corrects for these biases, essentially by sampling amino acid composition from the test dataset, correcting for protein length and weighting based on protein divergence, resulting in a robust scheme for motif enrichment significance calculation.Motif “clouds”
Frequently, a number of closely related, overlapping, significant motifs will be returned by a dataset. This is due to the non-independent nature of motifs, i.e. enrichment of a given motif will also tend to enrich all other motifs for which that motif is a component. E.g. The interactomes of CTBP1 return multiple significant SLiMs that are variations of the CtBP ligand, including P[IL]DL and D...[IL]DL. To aid interpretation, motifs are therefore grouped by SLiMFinder into “clouds” based on overlapping instances. To be clouded together, two motifs must share two non-wildcard positions in at least one occurrence (i.e. two defined residues in one protein).MCL clustering of TP and novel motifs
All patterns returned by “Real” datasets at p < 0.01 were subject to an all-by-all CompariMotif26 motif-motif comparison using default settings. These data were used to generate a motif network with each motif as a node and each CompariMotif similarity (min. normalised MatchIC > 0.5) as an edge. This network was then used as input for an MCL cluster analysis.49 Individual patterns were designated “TP” if they were a recognisable variant of a known PPI SLiM in at least one of the datasets returning that pattern, otherwise they were designated “Novel”. Random data was not used for this analysis because they are probably enriched for False Positives.False discovery rates
False discovery rates (FDR) were calculated using the principles of Storey50 based on the assumption that the SLiMChance statistical calculations were robust and that, as a result, 5% of results returned at p < = 0.05 (and 1% of results at p < = 0.01 etc.) would be false positives. For each significance p, therefore, FDR was calculated as:| FDR = pN/np, |
Random data
Two random datasets were generated to establish the empirical background of stochastically occurring over-represented motifs.Random sequence datasets
In the first “Random Sequence” dataset, each interaction dataset was taken in turn and the interactors replaced with an equal number of human proteins selected at random from the whole human genome dataset. These datasets therefore have the same number of proteins as the “real” data but would usually have more unrelated proteins as the probability of randomly selecting related sequences was much lower than the probability that a known hub protein is annotated as interacting with two or more related proteins.Random UPC datasets
To overcome any potential bias caused by the Random Sequence datasets having more UPC (and more singletons) than the real data, a second randomised dataset was generated by randomly recombining UPCs from the original data such that:• The number of UPCs in the random datasets matched the number of UPCs from the original datasets
• Each UPC from the original data was used once. (i.e. random selection without replacement.)
In reality, UPCs from different hubs are not necessarily unrelated and so some of the random UPC datasets will actually be reduced in size compared to the original data (in terms of UPC numbers and, sometimes, even in terms of absolute sequence numbers if spokes from different hub datasets are randomly selected for the same random dataset).
This then produced two random datasets with different attributes and biases: the Random Sequence data tending to have more UPC than the real data and the Random UPC datasets tending to have fewer. By framing the real data in this fashion, any inherent bias due to the underlying UPC distribution should be apparent.
Conclusions
This work represents only the second large scale de novoSLiM prediction of this nature on human data. Since the first analysis of Neduva et al.24 a number of improvements have been made to the underlying methodology, most importantly in terms of estimating statistical significance, which allows for direct comparisons across different datasets. This work has successfully rediscovered a number of known motifs, demonstrating the potential of the method but, equally importantly, has also highlighted some potential pitfalls that only become obvious with an analysis of this scale. The domination of significant results by off-target and recurring motifs was neither something that was expected nor reported by Neduva et al., although re-interpreting their results in the light of our discoveries indicates that their analysis was also prone to similar problems. It is also clear, however, that while such results present challenges of interpretation, they are not “False Positives” in the strictest sense and often represent genuine biologically functional motifs in the proteins containing them. This is even true of some of the motifs returned by random datasets, and raises the intriguing possibility that novel sites of biological importance could be identified by looking for over-represented motifs in larger datasets up to full proteome level. Indeed, recent work in yeast has suggested that larger-scale prediction might indeed be frutiful.51 (This is currently not possible with SLiMFinder due to limitations with the BLAST-based evolutionary filtering.) The issue, therefore, becomes not just one of identifying the functional motifs but also to correctly assigning their function. This is something that is outside the scope of this work but it is hoped that the results presented here will provide the basis for future experimental analyses of specific predictions. To this end, we have made all motif predictions available as ESI‡ and a navigable online resource (http:// bioware.soton.ac.uk/slimdb/).This analysis is the largest de novo in silicoSLiM prediction in humans and has identified a number of candidates for novel functional motifs and/or motif occurrences. This work represents a major step forward by predicting a number of statistically over-represented and evolutionary conserved motifs outside of globular domains. While we have confidence that many of these represent motifs of true biological functional significance, the interdependent nature of the data makes categorical functional assignment difficult. Nevertheless, this study clearly identifies a number of areas that can be targeted to further enhance predictions and move closer to the ultimate goal of motif prediction with assigned function.
We conclude that SLiMFinder can be an effective tool for motif discovery. Users should be careful to assemble protein datasets that are enriched for direct interactors of the proposed motif binding protein. Ideally, such analyses will be performed in conjunction with data specifically supporting at least one such direct interaction, which can be used as a filter for motif predictions. This information could be provided a priori, using the “query” option in SLiMFinder to restrict results to a specific protein or disordered region. Alternatively, coupling the in silico predictions to in vitro interaction screening will greatly increase the power of such analyses. The extensive database of results provided here represent an initial starting point for exploring motifs in human proteins. Users can traverse this database in terms of a protein of interest, or a motif of interest, or a domain of interest. While the most strongly significant motifs generally represent previously well known motifs, this should not come as a surprise: the most complete interaction datasets represent well-studied proteins and experimental protein biochemists are adept at interpreting evidence for motifs in such sequences; thus, computational predictions are likely to be more useful for motifs for which the evidence is less glaringly obvious. These predicted motifs can then be further explored in follow-up experiments, to validate their significance.
Acknowledgements
This work was supported by Science Foundation Ireland grants 02/IN1/B294 and 08/IN.1/B1864. The authors would like to thank two anonymous reviewers and Dr Kieren Lythgow for helpful comments on the manuscript.References
- R. D. Finn, J. Mistry, J. Tate, P. Coggill, A. Heger, J. E. Pollington, O. L. Gavin, P. Gunasekaran, G. Ceric, K. Forslund, L. Holm, E. L. Sonnhammer, S. R. Eddy and A. Bateman, Nucleic Acids Res., 2010, 38, D211–222 CrossRef CAS.
- I. Letunic, T. Doerks and P. Bork, Nucleic Acids Res., 2009, 37, D229–232 CrossRef CAS.
- J. McDowall and S. Hunter, Methods Mol. Biol., 2011, 694, 37–47 CAS.
- C. M. Gould, F. Diella, A. Via, P. Puntervoll, C. Gemund, S. Chabanis-Davidson, S. Michael, A. Sayadi, J. C. Bryne, C. Chica, M. Seiler, N. E. Davey, N. Haslam, R. J. Weatheritt, A. Budd, T. Hughes, J. Pas, L. Rychlewski, G. Trave, R. Aasland, M. Helmer-Citterich, R. Linding and T. J. Gibson, Nucleic. Acids Res., 2010, 38, D167–180 CrossRef CAS.
- S. Rajasekaran, S. Balla, P. Gradie, M. R. Gryk, K. Kadaveru, V. Kundeti, M. W. Maciejewski, T. Mi, N. Rubino, J. Vyas and M. R. Schiller, Nucleic Acids Res., 2009, 37, D185–190 CrossRef CAS.
- A. Mohan, C. J. Oldfield, P. Radivojac, V. Vacic, M. S. Cortese, A. K. Dunker and V. N. Uversky, J. Mol. Biol., 2006, 362, 1043–1059 CrossRef CAS.
- A. K. Dunker and Z. Obradovic, Nat. Biotechnol., 2001, 19, 805–806 CrossRef CAS.
- V. Neduva and R. B. Russell, FEBS Lett., 2005, 579, 3342–3345 CrossRef CAS.
- P. Puntervoll, R. Linding, C. Gemund, S. Chabanis-Davidson, M. Mattingsdal, S. Cameron, D. M. Martin, G. Ausiello, B. Brannetti, A. Costantini, F. Ferre, V. Maselli, A. Via, G. Cesareni, F. Diella, G. Superti-Furga, L. Wyrwicz, C. Ramu, C. McGuigan, R. Gudavalli, I. Letunic, P. Bork, L. Rychlewski, B. Kuster, M. Helmer-Citterich, W. N. Hunter, R. Aasland and T. J. Gibson, Nucleic Acids Res., 2003, 31, 3625–3630 CrossRef CAS.
- T. J. Gibson, Trends Biochem. Sci., 2009, 34, 471–482 CrossRef CAS.
- N. E. Davey, G. Trave and T. J. Gibson, Trends Biochem. Sci., 2011, 36, 159–169 CrossRef CAS.
- V. Neduva and R. B. Russell, Curr. Opin. Biotechnol., 2006, 17, 465–471 CrossRef CAS.
- H. Dinkel, C. Chica, A. Via, C. M. Gould, L. J. Jensen, T. J. Gibson and F. Diella, Nucleic Acids Res., 2011, 39, D261–267 CrossRef.
- Y. Igarashi, E. Heureux, K. S. Doctor, P. Talwar, S. Gramatikova, K. Gramatikoff, Y. Zhang, M. Blinov, S. S. Ibragimova, S. Boyd, B. Ratnikov, P. Cieplak, A. Godzik, J. W. Smith, A. L. Osterman and A. M. Eroshkin, Nucleic Acids Res., 2009, 37, D611–618 CrossRef CAS.
- N. D. Rawlings, A. J. Barrett and A. Bateman, Nucleic Acids Res., 2010, 38, D227–233 CrossRef CAS.
- T. S. Keshava Prasad, R. Goel, K. Kandasamy, S. Keerthikumar, S. Kumar, S. Mathivanan, D. Telikicherla, R. Raju, B. Shafreen, A. Venugopal, L. Balakrishnan, A. Marimuthu, S. Banerjee, D. S. Somanathan, A. Sebastian, S. Rani, S. Ray, C. J. Harrys Kishore, S. Kanth, M. Ahmed, M. K. Kashyap, R. Mohmood, Y. L. Ramachandra, V. Krishna, B. A. Rahiman, S. Mohan, P. Ranganathan, S. Ramabadran, R. Chaerkady and A. Pandey, Nucleic Acids Res., 2009, 37, D767–772 CrossRef CAS.
- B. Schuster-Bockler and A. Bateman, BMC Bioinformatics, 2007, 8, 259 CrossRef.
- N. E. Davey, R. J. Edwards and D. C. Shields, BMC Bioinformatics, 2010, 11, 14 CrossRef.
- R. J. Edwards, N. E. Davey and D. C. Shields, PLoS One, 2007, 2, e967 Search PubMed.
- N. E. Davey, D. C. Shields and R. J. Edwards, Bioinformatics, 2009, 25, 443–450 CrossRef CAS.
- R. Aragues, A. Sali, J. Bonet, M. A. Marti-Renom and B. Oliva, PLoS Comput. Biol., 2007, 3, 1761–1771 CAS.
- C. Chica, A. Labarga, C. M. Gould, R. Lopez and T. J. Gibson, BMC Bioinformatics, 2008, 9, 229 CrossRef.
- H. Dinkel and H. Sticht, Bioinformatics, 2007, 23, 3297–3303 CrossRef CAS.
- V. Neduva, R. Linding, I. Su-Angrand, A. Stark, F. de Masi, T. J. Gibson, J. Lewis, L. Serrano and R. B. Russell, PLoS Biol., 2005, 3, e405 Search PubMed.
- V. Neduva and R. B. Russell, Nucleic Acids Res., 2006, 34, W350–355 CrossRef CAS.
- R. J. Edwards, N. E. Davey and D. C. Shields, Bioinformatics, 2008, 24, 1307–1309 CrossRef CAS.
- M. R. Schiller, Curr. Protoc. Protein Sci., 2007 Search PubMed , ch. 2, Unit 2 12.
- N. E. Davey, N. J. Haslam, D. C. Shields and R. J. Edwards, Nucleic. Acids Res., 2011, 39, W56–W60 CrossRef CAS.
- Z. Dosztanyi, B. Meszaros and I. Simon, Bioinformatics, 2009, 25, 2745–2746 CrossRef CAS.
- Z. Dosztanyi, V. Csizmok, P. Tompa and I. Simon, Bioinformatics, 2005, 21, 3433–3434 CrossRef CAS.
- M. Fuxreiter, P. Tompa and I. Simon, Bioinformatics, 2007, 23, 950–956 CrossRef CAS.
- V. Vacic, C. J. Oldfield, A. Mohan, P. Radivojac, M. S. Cortese, V. N. Uversky and A. K. Dunker, J. Proteome Res., 2007, 6, 2351–2366 CrossRef CAS.
- B. Xue, A. K. Dunker and V. N. Uversky, Int. J. Mol. Sci., 2010, 11, 3725–3747 CrossRef CAS.
- T. J. Hubbard, B. L. Aken, S. Ayling, B. Ballester, K. Beal, E. Bragin, S. Brent, Y. Chen, P. Clapham, L. Clarke, G. Coates, S. Fairley, S. Fitzgerald, J. Fernandez-Banet, L. Gordon, S. Graf, S. Haider, M. Hammond, R. Holland, K. Howe, A. Jenkinson, N. Johnson, A. Kahari, D. Keefe, S. Keenan, R. Kinsella, F. Kokocinski, E. Kulesha, D. Lawson, I. Longden, K. Megy, P. Meidl, B. Overduin, A. Parker, B. Pritchard, D. Rios, M. Schuster, G. Slater, D. Smedley, W. Spooner, G. Spudich, S. Trevanion, A. Vilella, J. Vogel, S. White, S. Wilder, A. Zadissa, E. Birney, F. Cunningham, V. Curwen, R. Durbin, X. M. Fernandez-Suarez, J. Herrero, A. Kasprzyk, G. Proctor, J. Smith, S. Searle and P. Flicek, Nucleic Acids Res., 2009, 37, D690–697 CrossRef CAS.
- UniProt Consortium, Nucleic. Acids Res., 2009, 37, D169–174 CrossRef.
- N. E. Davey, R. J. Edwards and D. C. Shields, Nucleic Acids Res., 2007, 35, W455–459 CrossRef.
- S. F. Altschul, T. L. Madden, A. A. Schaffer, J. Zhang, Z. Zhang, W. Miller and D. J. Lipman, Nucleic Acids Res., 1997, 25, 3389–3402 CrossRef CAS.
- N. E. Davey, D. C. Shields and R. J. Edwards, Nucleic Acids Res., 2006, 34, 3546–3554 CrossRef CAS.
- K. Katoh and H. Toh, Briefings Bioinf., 2008, 9, 286–298 CrossRef CAS.
- B. J. Breitkreutz, C. Stark, T. Reguly, L. Boucher, A. Breitkreutz, M. Livstone, R. Oughtred, D. H. Lackner, J. Bahler, V. Wood, K. Dolinski and M. Tyers, Nucleic Acids Res., 2008, 36, D637–640 CrossRef CAS.
- A. Ceol, A. Chatr-aryamontri, E. Santonico, R. Sacco, L. Castagnoli and G. Cesareni, Nucleic Acids Res., 2007, 35, D557–560 CrossRef CAS.
- A. Chatr-aryamontri, A. Ceol, L. M. Palazzi, G. Nardelli, M. V. Schneider, L. Castagnoli and G. Cesareni, Nucleic Acids Res., 2007, 35, D572–574 CrossRef CAS.
- L. Matthews, G. Gopinath, M. Gillespie, M. Caudy, D. Croft, B. de Bono, P. Garapati, J. Hemish, H. Hermjakob, B. Jassal, A. Kanapin, S. Lewis, S. Mahajan, B. May, E. Schmidt, I. Vastrik, G. Wu, E. Birney, L. Stein and P. D'Eustachio, Nucleic Acids Res., 2009, 37, D619–622 CrossRef CAS.
- L. Salwinski, C. S. Miller, A. J. Smith, F. K. Pettit, J. U. Bowie and D. Eisenberg, Nucleic Acids Res., 2004, 32, D449–451 CrossRef CAS.
- S. Kerrien, Y. Alam-Faruque, B. Aranda, I. Bancarz, A. Bridge, C. Derow, E. Dimmer, M. Feuermann, A. Friedrichsen, R. Huntley, C. Kohler, J. Khadake, C. Leroy, A. Liban, C. Lieftink, L. Montecchi-Palazzi, S. Orchard, J. Risse, K. Robbe, B. Roechert, D. Thorneycroft, Y. Zhang, R. Apweiler and H. Hermjakob, Nucleic Acids Res., 2007, 35, D561–565 CrossRef CAS.
- E. A. Bruford, M. J. Lush, M. W. Wright, T. P. Sneddon, S. Povey and E. Birney, Nucleic Acids Res., 2008, 36, D445–448 CrossRef CAS.
- S. R. Eddy, Bioinformatics, 1998, 14, 755–763 CrossRef CAS.
- S. Michael, G. Trave, C. Ramu, C. Chica and T. J. Gibson, Bioinformatics, 2008, 24, 453–457 CrossRef CAS.
- A. J. Enright, S. Van Dongen and C. A. Ouzounis, Nucleic Acids Res., 2002, 30, 1575–1584 CrossRef CAS.
- J. D. Storey, Ann. Stat., 2003, 31, 2013–2015 CrossRef.
- D. S. Lieber, O. Elemento and S. Tavazoie, PLoS One, 2010, 5, e14444 CAS.
Footnotes |
| † Published as part of a Molecular BioSystems themed issue on Intrinsically Disordered Proteins: Guest Editor M Madan Babu. |
| ‡ Electronic supplementary information (ESI) available. See DOI: 10.1039/c1mb05212h |
| This journal is © The Royal Society of Chemistry 2012 |