Systems biology of ovine intestinal parasite resistance: disease gene modules and biomarkers†
Haja N.
Kadarmideen
*a,
Nathan S.
Watson-Haigh
a and
Nicholas M.
Andronicos
b
aCommonwealth Scientific and Industrial Research Organisation (CSIRO), Livestock Industries, Davies Laboratory, PMB PO Aitkenvale, Townsville QLD 4814, Australia. E-mail: Haja.Kadarmideen@csiro.au
bCommonwealth Scientific and Industrial Research Organisation (CSIRO), Livestock Industries, FD McMaster Laboratory, Chiswick, Armidale, NSW 2350, Australia
First published on 11th November 2010
Abstract
This study reports on the molecular systems biology of gastrointestinal nematode (GIN) infection and potential biomarkers for GIN resistance in sheep. Microarray gene expression data were obtained for 3 different tissues at 4 time points from sheep artificially challenged with two types of nematodes, Haemonchus contortus (HC) and Trichostrongylus colubriformis (TC). We employed an integrated systems biology approach, integrating 3 main methods: standard differential gene expression analyses, weighted gene co-expression network analyses (WGCNA) and quantitative genetic analyses of gene expression traits of key biomarkers. Using standard differential gene expression analyses we identified differentially expressed genes (DE) which responded differently in sheep challenged with HC compared to those challenged with TC. These interaction genes (e.g. MRPL51, SMEK2, CAT, MAPK1IP1 and SLC25A20A) were enriched in Wnt receptor signalling pathway (p = 0.0132) and positive regulation of NFκβ transcription factor activity (p = 0.00208). We report FCER1A, a gene encoding a high-affinity receptor for the Fc region of immunoglobulin E, which is linked to innate immunity to GIN in sheep. Using weighted gene co-expression network analysis (WGCNA) methods, we identified gene modules that were correlated with the length of infection (disease modules). Hub genes (with high intramodular connectivity) were filtered further to identify biomarkers that are related to the length of infection (e.g. CAT, FBX033, COL15A1, IGFBP7, FBLN1 and IgCgamma). The biomarkers we found in HC networks were significantly associated with functions such as T-cell and B-cell regulations, TNF-alpha, interleukin and cytokine production. In TC networks, biomarkers were significantly associated with functions such as protein catabolic process, heat shock protein binding, protein targeting and localization, cytokine receptor binding, TNF receptor binding, apoptosis and IGF binding. These results provide specific gene targets for therapeutic interventions and provide insights into GIN infections in sheep which may be used to infer the same in related host species. This is also the first study to apply the concept of estimating breeding values of animals to expression traits and reveals 11 heritable candidate biomarkers (0.05 to 0.92) that could be used in selection of animals for GIN resistance.
Introduction
Gastrointestinal nematodes in sheep
Gastrointestinal nematode (GIN) infections are responsible for reduced meat and wool production in domestic livestock. In sheep, Haemonchus contortus and Trichostrongylus colubriformis infections in Australia alone were estimated to cost approximately AUD$ 400 million annually in 1990.39 This has since increased due to more expensive anthelmintics needed to combat drug resistance39 in nematode populations. Because of the failure of anthelmintic drenches, a major research effort is currently underway to find alternatives to chemical control, such as development of genetically resistant lines of animals.Finding host DNA genetic markers associated with the GIN resistance status of an animal will facilitate the selection of desirable host genotypes. However, breeding sheep which are genetically resistant to GIN is currently hampered as it requires the accurate identification of GIN resistant animals. Determining GIN resistance currently relies on indirect measures such as the number of nematode eggs present in faeces (WEC), packed cell volume (PCV) or increased numbers of eosinophils in peripheral blood.8,34 Recording of WEC, PCV and eosinophil counts is not widespread in sheep industries. Further, a standardized immunological parameter, indicative of GIN resistance in sheep has been elusive.26 This is because the mechanism of host resistance appears to be parasite specific and resistance is inferred through different biological mechanisms.1 For instance, resistance may be at the adult or larval stages, and the immune response and/or antigen recognition may be different.23 This makes it complex and difficult to develop direct genetic or immunological markers. Hence, a thorough knowledge of the underlying molecular systems, gene co-expression networks and pathways involved in the systemic response to GIN infection are needed. The main goal of this study was to investigate, via a systems biology approach, molecular mechanisms, master regulatory genes and potential biomarkers associated with host resistance to GIN parasitism. We also evaluate if some of the biomarker expression profiles are heritable for possible use in breeding resistant sheep.
Differential gene expression analysis
Microarray-based gene expression profiling allows detailed understanding of transcriptional differences across experimental perturbations. Identification of differentially expressed (DE) genes for different sets of experimental perturbations leads to identification of underlying genes that may contribute to differences in phenotypes (e.g. disease susceptibility versus resistance). These DE genes along with the mode of regulation could be functionally validated using real time PCR and eventually used as biomarkers in a range of applications (e.g. in disease prevention/prediction, drug development or in marker- or gene-assisted selection to select animals or plants with favourable expression20). However, it is well known that complex traits and clinical diseases in most species are not determined by individual genes acting alone but rather in complex multi-gene interactions.18,32 In many cases, it is the gene–gene interactions that cause phenotypic variation in complex diseases or traits rather than the marginal effects of individual genes.18,32,45 Hence, new approaches are warranted to capture such interacting genes.Co-expression network analysis
Gene co-expression networks can be represented as graphs, where each node corresponds to a gene and a pair of nodes is connected with an undirected edge (link) based on the strength of their pairwise expression similarity (e.g. correlation coefficient). While standard DE approaches are powerful in identifying genes that have substantial transcription differences between a given set of biological perturbations, co-expression (CE) approaches reveal group(s) of genes whose expression levels are largely very similar within a biological or clinical condition. The CE approaches are complementary to DE approaches and are closely related. There are clinical and performance traits, where phenotypic variation is controlled at many levels, some of which are independent of transcript abundance. For example, Hudson et al.15 stated that transcription factor (TF) modifications such as reversible phosphorylation and missense mutations can act independently of TF expression level and that such a process can be overlooked by standard DE analysis. They built co-expression networks separately for mutant versus normal muscle phenotypes in cattle and differentiated these two networks, using differential wiring, to prove that such approaches can correctly identify causal mutations. Hence, instead of exclusively defining DE genes, identification of groups of highly co-expressed (CE) genes or gene modules may facilitate the identification of important regulatory or causative genes that are highly connected to phenotypes.Co-expression networks are not based on direct measurements of interactions and as such have a different interpretation to those networks used in protein interaction studies or other fields attempting to model the biological interactions of molecules. In a co-expression network, two closely connected nodes would be highly correlated but not necessarily direct binding partners.6 Numerous studies have indicated that genes whose expression is highly correlated with each other across a range of experiments tend to be under similar transcriptional control or act within the same pathway. In practice, both standard differential analyses and co-expression gene module/network constructions are essential to identify potential causal genes. Wang et al.44 identified a co-expression module with 20 hub genes (enriched in cell cycle regulation) demonstrating significant association with the aggressive phenotype of prostate cancer. Through standard DE analyses they were able to link 5 of the 7 DE genes to cell cycle regulation and 2 were predicted to target 3 of the 20 hub genes. Hence, it would be more powerful to use both standard DE and CE network methods to understand the gene expression response from parasite resistant hosts to two gastrointestinal nematode (GIN) species. There are several different network construction methods that use high-throughput transcriptomics data; some are weighted, most are unweighted and some algorithms account for dependencies of gene–gene correlations (e.g. ref. 45). Here we apply the widely used approach (e.g.ref. 6, 12, 25, 40) of weighted gene co-expression network analysis (WGCNA) to microarray gene expression data. Following the methods of Zhang and Horvath49 and Carlson et al.6 we use the scale-free topology criterion and soft thresholding in the construction of gene networks. The strength of the correlation between each pair of genes is weighted using the power adjacency function. Potential biomarkers can be identified by using the intra-modular connectivity of genes, their biological roles, and the significance of correlation with phenotypes.
Biomarker heritabilities and expression breeding values (eEBVs)
In agri-biotech industry, sheep geneticists and breeders, looking to improve disease resistance in populations, are often interested in only a few genes that could be used in marker assisted or expression assisted selection of animals.21 The response to selection on a biomarker or a gene depends on its additive effects which is quantified by heritability. Hence, instead of estimating heritabilities for all genes in disease modules or all genes in networks, we restricted the analyses to only biomarkers that we identified as being useful and relevant for the industry. We apply typical quantitative genetics analysis, usually used for estimating heritability and breeding values for macro traits (e.g. body type and size, growth, disease episodes and reproduction),19,22 to quantitative gene expression traits (e-traits). This type of analysis has been described previously, for instance, in ref. 17 using a sire model.Systems biology approaches
We employed an integrated systems biology approach, integrating 3 main methods discussed above, to study the effects of GIN infection on gene expression in sheep. Fig. 1 is a flowchart showing the 3 main approaches undertaken and how they are integrated to produce drug targets and biomarkers. It starts with standard differential gene expression (DE) analyses to detect DE and interaction genes, then with weighted gene co-expression network analyses (WGCNA) to detect key hub genes and biomarkers, functional enrichment analyses of both DE and hub/biomarker genes and estimating heritability profiles of a few key biomarkers which the sheep industry could use in expression assisted selection (EAS) for breeding resistant sheep. | ||
| Fig. 1 A workflow indicating the steps and data involved in the systems genetic analysis of GIN data. | ||
Results and discussion
Differential gene expression
In the analysis of data from white blood cell (WBC) tissues, we focussed on finding 2-way interaction genes; those that have contrasting direction of regulation in sheep infected by two different parasites. Those genes are biologically interesting candidates as they shed light on parasite-specific gene expression profiles and differential gene regulatory systems to mount an immune response. We were able to model 2-way interactions between the parasites and the length of infection which are denoted as Parasite:L3, Parasite:L7 and Parasite:L21 where L0 was set as a reference to compare these interactions against. We found no evidence of Parasite:L3 genes but identified 156 Parasite:L7 interaction genes of which 148 were Parasite:L7 specific and 39 Parasite:L21 interaction genes of which 31 were Parasite:L21 specific. The list of 2-way interaction genes which are both significantly differentially expressed (adjusted p-values ≤0.05) and are ≥2 fold change different is given in file 1, ESI† (along with GenBank id, gene symbol, gene name and Entrez id). The expression profiles of the interaction genes are summarised in Fig. 2 with the aid of heatplots and the mean and 95% confidence intervals of the genes in major clusters. In both heatplots, there are 2 major clusters of genes, evident by the branching pattern in the dendrograms to the left of the heatplots. The mean and 95% confidence intervals for each of the major clusters are shown to the right in order to better visualise/understand the expression patterns of the interaction genes across the experimental groups. For the Parasite:L7 interaction genes, we found 2 major clusters (Fig. 2A): cluster (1) contains 71 genes whose expression is less in HC L7 samples compared to HC L0 samples but vice versa for the TC samples i.e. greater in TC L7 samples compared to TC L0; cluster (2) contains 85 genes whose expression is greater in HC L7 samples compared to HC L0 samples but similar/unchanging across the TC samples. There are also 2 major clusters of Parasite:L21 genes (Fig. 2B): cluster (1) contains 32 genes whose expression is similar/unchanging across the HC samples but greater in TC L21 samples compared to TC L0; cluster (2) contains 7 genes whose expression is greater in HC L21 samples compared to HC L0 samples but similar/unchanging across the TC samples. In the latter, it is clear that the genes are only overexpressed in HC L21 samples compared to the other 3 experimental groups which have the same level of expression. | ||
| Fig. 2 (A) Heatplot of the 156 Parasite:L7 interaction genes clustered by their expression profiles (clustering dendrogram to the left of the heatplots). Red and blue indicates over-expression and under-expression respectively. Mean expression and 95% confidence intervals of the two major gene clusters are shown to the right. (B) The same as (A) except for the 39 Parasite: L21 interaction genes. | ||
Genes associated with resistance and susceptibility to GIN in sheep have been identified through standard DE analyses in earlier studies,10 but these studies have found that very few genes were commonly expressed by sheep in response to both H. contortus and T. colubriformis. Thus, it indicated that there may be parasite species-specific mechanism(s) of host defence at play.1 Hence, our two-way interactions of the parasite vs. length of infection models were targeted to identify those parasite species-specific mechanisms of host defence. The examples of parasite-specific genes that we found to be differentially expressed or regulated in response to HC versusTC infection during infection time course include MRPL51, SMEK2, ING4, PDHX, CREM, TOX4, UBE2W, ZNF326, LOC ILF3, HBP1, RASSF4, CAT, MAPK1IP1 and SLC25A20. These genes were significantly enriched in infection and immune-related functions and pathways. The complete list of interaction genes is given in file 1, ESI.† Andronicos et al.1 have also shown that at the site of infection (gut mucosal surfaces) dual oxidase, glutathione peroxidase and trefoil factor and Toll-like receptors (TLR2, 4, 9) genes are associated with GIN resistance while CXCL10, GALIG, WARS and NFκβ signalling pathway (IKBKB and NFκβIA) are associated with susceptibility to GIN. In our study, we found that monoamine oxidase, myosin, ubiquitin, apolipoprotein, interferon regulatory factors, mucin, TLR and keratin gene were associated with resistance to TC worms while dextrin, glutathione s-transferase, ghrelin, IKBKB and NFκβIA expression levels are associated with susceptibility to HC worms.
Amongst the DE genes found for the contrast between infected animals and animals infected for 21 days (200 genes, adjusted p-values ≤0.05), we found the FCER1A gene. A complete list of probe sets along with GenBank id, gene name, gene symbol and Entrez id is given in file 2, ESI.† To our knowledge, this gene has not been linked to innate immunity to GIN in sheep. This gene encodes a high-affinity receptor gene for the Fc region of immunoglobulin E (IgE). FCER1A is known to be expressed on the surfaces of circulating basophils29 in response to serum IgE levels and in turn the level of cell surface FcεRI expressed by these cells mediates their IgE reactivity.27,41 This suggests that basophils may be involved in the initiation phase of the host response to GIN since FCER1A was differentially expressed when comparing naive against post-challenge infected animals. Recently, several studies have demonstrated that basophils act as antigen presenting cells to drive the establishment of the Th2 and IgE responses against protease antigens, protein allergens and GIN.37,43 The expression of FCER1A after a primary challenge of GIN, in genetically resistant animals, is therefore consistent with the involvement of basophils in the establishment of an antigen-dependent Th2 host immune response.
Weighted gene co-expression network analysis
By constructing separate co-expression networks for different conditions, such as parasite-tissue specific states, it is possible to identify parasite-mediated changes in the network connectivity patterns. Further, parasite-tissue specific gene networks provide information on gene modules and hub genes that are master regulatory genes in a specific biological/experimental condition. For instance, there would be a few highly connected genes within the network, and the deletion of a gene with a large number of co-regulated partners (hub gene) is more likely to result in a major phenotypic change. A highly connected hub gene would be so essential in some organisms that knocking out that hub gene could be lethal. This formed one of the main aims for our study: to build four different parasite-tissue specific weighted gene co-expression networks using microarray gene expression data for (1) abomasal sample from sheep infected with H. contortus (HCA samples), (2) white blood cell sample from sheep infected with H. contortus (HCB samples), (3) gut sample from sheep infected with T. colubriformis (TCG samples) and (4) white blood cell samples from sheep infected with T. colubriformis (TCB samples). Fig. 3 shows the frequency of genes and their level of connectivity (k) and log–log plots of the HCA, HCB, TCG and TCB networks. It shows a large number of genes with k = 50–70 and small number of genes with k > 200 across the 4 networks. Those genes with high connectivity (e.g. k > 200) should be considered as hub acting genes. The straight line relationship shows approximate scale-free topology. A linear relationship, with a high R2 value (0.78, 0.88, 0.92 and 0.86 for HCA, HCB, TCG and TCB networks respectively), in the log–log plots (Fig. 3) shows approximate scale-free topology. Table 1 provides a summary of the total number of gene modules detected, those modules that are highly correlated to GIN infection (called “disease modules”), numbers of genes in disease modules and disease biomarkers in each of the 4 networks. Overall, we detected 6 disease modules based on gene significance measures (see Methods section); a complete list of all genes in the six disease modules (color coded according to their module type and network) along with gene bank id, gene symbol, gene name and Entrez id is given in file 3, ESI.† We carried out a functional enrichment analysis on the genes in each of the six disease modules using GOEAST. Functional enrichment analysis results are given as ESI† files (4 to 9) for the three gene ontology domains: biological, cellular and molecular function. All GOEAST enrichment analyses for the 6 modules are reported at log-odds ratio ≥3 and a Bonferroni corrected p-value ≤0.01. In what follows below, we provide a description of each network and discuss some of the biologically interesting module genes (based on GOEAST analyses) and how they might be involved in GIN infection and immunity. It is, however, beyond the scope of this article to discuss each module gene (a total of 2548) in a biological context. However, we provide a complete list of disease module genes in file 3 (ESI†) so domain specialists such as immunologists/biologists can perform further experimental validation.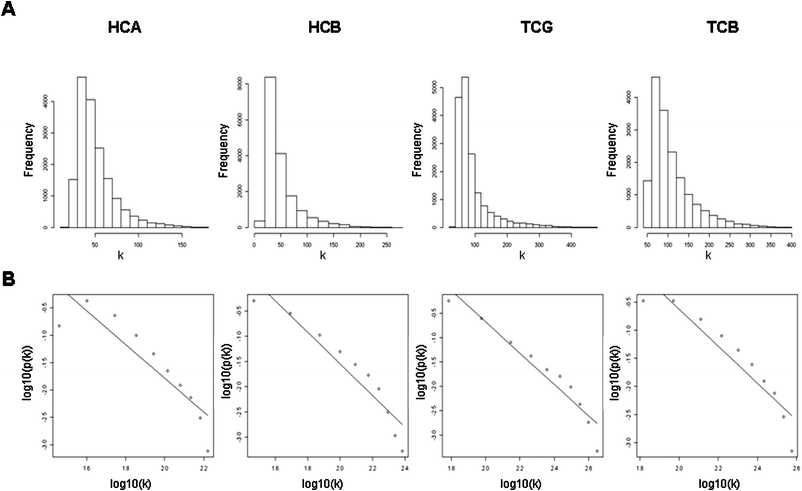 | ||
| Fig. 3 Gene connectivity distributions (top row) and log–log plots (bottom row) for the four GIN networks. | ||
| HCA | HCB | TCB | TCG | |
|---|---|---|---|---|
| Total modules | 10 | 17 | 4 | 18 |
| Disease modules | Pink, yellow | Green | Turquoise | Blue, red |
| Genes in disease modules | 135 | 79 | 1541 | 793 |
| Biomarkers in disease modules | 17 | 2 | 14 | 25 |
 | ||
| Fig. 4 A hierarchical clustering dendrogram of the topological overlap measure (TOM) matrix for the HCA dataset. Genes were assigned to modules, indicated as colours below the dendrogram, using the static tree cutting method. | ||
Of particular interest among the HCA module genes was the presence of GHRL (Ghrelin) (pink module), ITGB2 (integrin, β2) (yellow module) and FYN (fyn oncogene related to src and fgr) (yellow module) genes. It is known that the GHRL gene is one of the most important genes in regulating immune response to gut infection and also plays a role in obesity and other metabolic syndromes.11,35ITGB2 is involved in several immune system processes: T cell proliferation, T cell activation and leukocyte migration. FYN is involved in the FcεRI signalling pathway (also implicated by the DE analysis). This pathway triggers cytokine production, NK cell mediated cytotoxicity and the T cell receptor signalling pathway. We also found functions relating to the regulation of cytokine production to be enriched in the HCA network. Cytokines are one of the early immune response indicators to infection with H. contortus larvae.3 These results show that the WGCNA approach correctly identifies key genes and biomarkers associated GIN resistance.
In the HCB network, 17 modules were detected which contained between 34 and 332 genes but only the green module (79 genes) was a disease module (correlation, r ≥ 0.70). The hub genes identified in the HCB network were found to be enriched with components of the NFκβ signalling pathway. Ingham et al.16 found that susceptible animals showed a prolonged immune response and developed a chronic inflammatory state. This was characterized by elevated expression of several members of the NFκβ signalling pathway and delayed expression of regulatory genes such as IL2RA (CD25), IL10 and TGF-β2 at the site of infection. It is possible that these patterns could be found in our sheep samples because the animals were only resistant to TC worms but not HC worms.
Protein-L-isoaspartate (D-aspartate) O-methyltransferase (or PCMT1) and defence against death (DAD1) genes were present in the green module of the HCB network and were also found to be interaction genes in the DE analysis. PCMT1 plays a role in the repair and/or degradation of damaged proteins by initiating the conversion of abnormal D-aspartyl and L-isoaspartyl residues to the normal L-aspartyl form and has been implicated in a number of neuro-degenerative and metabolic disorders (PubMed: http://www.ncbi.nlm.nih.gov/pubmed). However, its role in immune functions is unclear. DAD1 plays a role in the prevention of apoptosis in certain cell types and Hong et al.14 have observed that endogenous DAD1 levels are modulated during T cell development to reach maximal expression in mature thymocytes. DAD1 gene expression is clearly modulated in our blood samples as systemic response to HC worms.
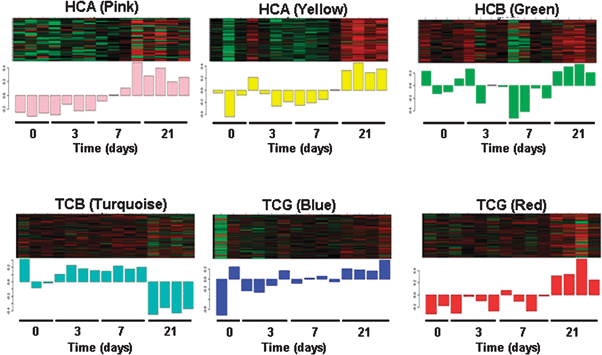 | ||
| Fig. 5 Gene expression signatures in disease gene modules across GIN infection time course in resistant sheep. | ||
Common features of all the biomarker genes were that they were involved in pathways that related to T and B cell differentiation and production of CD+ T-cells, predominantly from HCA samples. These findings are supported by reports of Balic et al.4 who found that the abomasal lymph nodes, following challenge with HC larvae, have undergone gene expression changes. These changes were characterized by an increase in the relative percentage of gamma delta-TCR+ T cells and B cells and an increase in the proportion of CD4(+) T cells co-expressing the activation markers MHC class II and CD25. In the abomasal mucosa, they also found an increase in the number of infiltrating CD4(+) and gamma delta-TCR+ T cells and B cells 3 or 5 days post-infection.
Biomarker heritabilities and expression EBVs
Although, in the biological context, it would be interesting to explore heritabilities for the entire transcriptome or for thousands of genes in disease modules, such results cannot be used in the sheep industry for targeted (bio)marker assisted breeding. Sheep geneticists and breeders are often interested in only a few (5–10) genes that could be used in marker assisted or expression assisted selection of animals21 to improve disease resistance in populations. The response to selection on a biomarker or a gene depends on its additive effects which is quantified by heritability. Hence, instead of estimating heritabilities for all genes in the disease modules or all genes in a network, we restricted the analyses to only biomarkers that we identified as being useful and relevant for the industry. Heritabilities (h2) were estimated for the e-traits of 33 biomarkers. These 33 biomarkers were a subset of the 58 biomarker genes described in Table 1 which had functional annotations and a gene name (see also workflow in Fig. 1). Of these 33 biomarkers, 33% (11 genes) had statistically significant (p-value ≤ 0.05) non-zero h2 ranging from 0.92 for CAT (se 0.52) to 0.02 for LOC51557 (se 0.02). Moderate to high h2 estimates were found for CAT, ARF4, COL18A1, IGFBP7, DDHD2 and RARS2. We estimated the expression breeding values (eEBVs) for 6 biomarkers with heritabilities >0.15. It should be noted that for each gene (and its e-trait), the estimation of h2 is based on stringent statistical tests of significance on variance components and are independent of an estimated h2 for other e-traits (see Methods section). File 12 (ESI†) shows the distribution of the calculated h2 and eEBVs. These eEBVs are conveyed as deviations from the population mean of expression of a given gene across all sire progeny groups and represent a sire's ability to transmit mRNA abundance to progeny generations. There is significant additive genetic variation for the expression of these genes between sires. By linking the relative functional importance of differential regulation of genes to disease resistance (as presented before), and with help of eEBVs, one may be able to determine which sire is an ideal selection candidate to breed animals that might be genetically more resistant to GIN infestation. For instance, overexpression of CAT was associated with an increase in the frequency, rate or extent of activity of the transcription factor NFκβ which is involved in mounting response to parasites. In this case, sires 5543 and 7072 seem to be ideal selection candidates. Hence, these results could be used in expression assisted selection in animal breeding programs.21Methods
Experimental design
Animals used in this study were descendants of the Trichostrongylus Selection Flock (TSF), a line of sheep developed by selection and assortative matings over the last 30 years46 to be resistant to T. colubriformis.Details of the GIN challenge experiment, from which samples were obtained, are described by Menzies et al.31 Briefly, sheep from the TSF were given a single oral challenge of either H. contortus (HC) or T. colubriformis (TC) nematodes. For the HC challenge, abomasal tissue (primary site of infection) and blood (systemic response) were taken. For the TC challenge, jejunum tissue (primary site of infection) and blood (systemic response) were taken. For both HC and TC challenge, samples were taken at 0, 3, 7 and 21 days post-challenge. There were 4 biological replicates for each sample at each time point (64 arrays in total). Table S1 (in file 12, ESI†) illustrates the experimental design showing microarray samples across days post-infection and three tissues. This experiment protocol was approved and conducted under the guidelines established by the F. D. McMaster Animal Ethics Committee, Livestock Industries, Commonwealth Scientific and Industrial Research Organisation (CSIRO), Australia (AEC Approval No. 0558).
RNA extraction
Total RNA from WBC pellets, jejunal scrapings or abomasal scrapings were isolated using the RNeasy purification (Qiagen, USA) kit with an on-column DNase digestion step. The quality and quantity of the isolated total RNA was monitored by 1% TAE agarose gel electrophoresis and A260/A280 spectrophotometry. All RNA preparations used for microarray analysis had a RNA integrity number of greater than or equal to 7 (Agilent Bioanalyser, USA). Purified total RNA was archived at −80 °C until required for microarray analysis.Microarray transcript profiling
The GeneChip® Bovine Genome Array (Affymetrix, Santa Clara, CA) containing 24![[thin space (1/6-em)]](https://www.rsc.org/images/entities/char_2009.gif) 072 probe sets measuring approximately 23000 transcripts was employed for transcript profiling samples. The target labelling, hybridisations, fluidics and chip scanning were performed by the Ramiciotti Centre at the University of New South Wales, Australia.
072 probe sets measuring approximately 23000 transcripts was employed for transcript profiling samples. The target labelling, hybridisations, fluidics and chip scanning were performed by the Ramiciotti Centre at the University of New South Wales, Australia.
Microarray data quality control
All statistical analyses were performed in the R statistical programming environment using the Bioconductor open source package (http://bioconductor.org/). Several quality control steps were used to ensure there were no gross anomalies with the technical aspects of hybridisation. The R package, affyPLM, was used to fit a probe level model (PLM) to the arrays and to generate pseudo array images of the weights. Visual inspection of these images showed only very minor hybridisation artefacts and thus did not warrant the removal of any arrays from the analysis.13RNA degradation plots were inspected and no samples were identified as outliers.
Gene expression values were generated using the median polish summarisation method following GC-RMA background correction of perfect match (PM) probes and quantile normalisation. Probe sets that had ‘Absent or Marginal’ MAS 5 detection calls ≥60 out of the 64 arrays were removed as their expression level is at or below the threshold of detection or probably not different from zero. This resulted in 16936 transcripts being used for differential gene expression analyses.
Differential gene expression analyses
Differential gene expression analyses were performed on the 16936 normalised probe sets using the Limma (v.2.10.5) package42 to identify differentially expressed (DE) genes. The Benjamini & Hochberg (BH) method was used to calculate p-values adjusted for multiple testing with a control of false discovery rate (FDR) with thresholds 5%.5 Unless stated otherwise, DE genes reported are also ≥2 fold different.
Several contrasts were possible given all the samples are available. However, the WBC tissues were the only samples for which we had data for both HC and TC challenged animals. Therefore, we focused our analyses on the WBC tissues where we included parasite:infection length interaction terms with L0 as the intercept (no infection versus different times after infection). In fact, this is the most interesting contrast as it determines which genes respond differently in the HC relative to TC for the same time contrasts and sheds light on nematode-specific gene responses. To demonstrate how interaction genes are behaving across experimental groups, we provide heatplots generated from these interaction genes (Fig. 2). Heatplots were generated using the made4 R package.27Genes (rows) in a heatplot are clustered using average linkage hierarchical clustering of normalised expression values across samples involved in the interaction contrast. Genes from major clusters were summarised, and plotted, using the mean and 95% confidence intervals calculated across each of the 4 experimental groups involved in an interaction contrast.
Weighted gene co-expression network analyses (WGCNA)
The details of WGCNA method and algorithms are thoroughly discussed in the original paper of Zhang and Horvath;49 the WGCNA method has, ever since its first publication, been refined, standardized and now widely used in the construction of co-expression gene networks in many different species, as evidenced by several publications (e.g.ref. 6, 12, 24, 25, 40). Hence, we only briefly describe the method and point to specific parameters that we used. We use the absolute value of the Pearson correlation coefficient as the gene co-expression similarity measure. An adjacency matrix (network) was generated by applying a power function (see below) to the absolute Pearson correlation coefficient matrices. We define connectivity (k) of the ith gene (ki) as the sum of the connection strengths (weights or adjacencies) between the ith gene and all other genes in the network. Rather than applying a “hard” threshold to the similarity measure matrix in order to define an unweighted adjacency matrix (network), we maintain the continuous nature of the similarity measure using “soft” thresholding. Soft thresholding is achieved by applying the power adjacency function to the similarity measure,6 thereby defining a weighted adjacency matrix (network). The value of the power function exponent (β) was chosen using the scale-free topology criterion, which is biologically motivated.49 Zhang and Horvath49 indicated that scale-free networks are resistant to random perturbations but sensitive to targeted removal of highly connected nodes and can be used to determine β. A high β transforms high similarity measures into high adjacencies and pushes lower similarity measures towards zero. A linear regression model fitting index R2 between log10p(k) and log10(k), where k is the measure of connectivity, as shown in Fig. 3 was used to determine how well a network fits the scale-free topology. There is a trade-off between maximizing model fit (R2) and maintaining a high mean number of connections. We chose β in the interval [2,15] which maximised the scale-free topology fit (R2) while maintaining a high level of mean connectivity. A major advantage of weighted networks is that they are highly robust with regard to the choice of β.49Four networks were created for HCA (abomasums samples from HC challenged animals), HCB (blood samples from HC challenged animals), TCB (blood samples from TC challenged animals) and TCG (gut samples from TC challenged animals). Of the 24072 probe sets on the microarray, 7136 had absent or marginal MAS5 flag calls in more than 60 out of 64 arrays and thus excluded for the purpose of building networks. For computational reasons, the top 3600 most highly connected genes (ranked by connectivity, k) from the remaining 16936 probe sets were used for constructing each network. The coefficient of β used for the HCA, HCB, TCG and TCB networks were 6, 7, 7 and 6 respectively. In each network, the topological overlap measure (TOM) was used to detect clusters of highly interconnected genes (modules).
Genes were clustered by average linkage hierarchical clustering of 1-TOM and modules defined as branches in the resulting clustering tree by the static tree cutting algorithm implemented in the cutreeStaticColor() function of the WGCNA R package.24,26
Functional enrichment analysis
Functional enrichment of GO terms among DE probes and biomarkers was performed using Database for Annotation, Visualization and Integrated Discovery or DAVID9 and Gene Ontology Enrichment Analysis Software Toolkit or GOEAST50 using genes on the entire microarray as a statistical background. In DAVID (http://david.abcc.ncifcrf.gov/summary.jsp), an over representation of a term is defined as an EASE score (the modified Fishers exact p-value) ≤0.1 with an adjustment for multiple tests using Benjamini method. In GOEAST, log-odds ratio ≥3 and a Bonferroni corrected p-value ≤0.01 were used to define an enriched GO term.Biomarker heritabilities and expression EBVs
As justified in the results section, it is not our aim to study global transcriptome-wide heritability distributions for thousands of genes but rather to address the sheep industry's need for expression assisted selection based on only a few biomarker profiles. Hence, a subset of 33 biomarkers was selected from a total of 58 biomarkers based on the availability of gene symbol information being available in the bovine annotation package of bioconductor. The characteristics of expression dataset with respect to distribution of the number of animal records on e-traits, tissues sampled and time of sampling for each sire group are given in file 13, ESI.† We apply typical quantitative genetics analysis usually used for estimating heritability and breeding values for macro traits such as body type and size, growth, disease episodes and reproduction,19,22 but to quantitative gene expression traits (e-traits, as described for instance in Kadarmideen)17 using a sire model. Mixed models were fitted to expression phenotypes that included fixed (treatment) effects for tissue, flock and random sire (genetic) effects. Heritabilities (h2) were computed using estimated variances. Expression EBVs (eEBVs) are sire solutions obtained from mixed models analyses for each animal which is essentially the basis for estimating genetic variance amongst sires. Full details of sire models and methods to predict breeding values in animal populations can be found in33 or as applications in cattle.19,22Conclusions
We studied the transcritpomic profiles of the primary response of resistant sheep, challenged with a single bolus oral dose of either of the two worms H. contortus or T. colubriformis. We conducted standard differential gene expression analyses and weighted gene co-expression network analyses to identify interaction genes that are highly differentially expressed (DE) between two parasites and biomarkers associated with resistance to GIN. These DE genes and biomarkers were subjected to functional analyses to attach biological relevance, in addition to the statistical relevance already obtained. The differential expression analysis of data from white blood cell (WBC) tissues provided evidence of 2-way interaction genes at day 7 (156 genes) and day 21 (39 genes). The interaction genes include MRPL51, SMEK2, ING4, PDHX, CREM, TOX4, UBE2W, ZNF326, LOC ILF3, HBP1, RASSF4, CAT, MAPK1IP1 and SLC25A20A. A weighted gene co-expression network analysis approach identified 58 biomarkers across six disease modules (from 4 networks); they include CAT, FBX033, COL15A1, AQP11, IGFBP7, FBLN1, MAGED1, TNC, IgCgamma and PSAP. In general, they were highly enriched in functions related to cell-mediated and humoral immunological response and resistance to GIN. The biomarkers we found in HCA and HCB networks were significantly associated with functions such as T-cell and B-cell regulations, TNF-alpha, interleukin and cytokine production. In TCG and TCB networks, biomarkers were significantly associated with functions such as protein catabolic process, heat shock protein binding, protein targeting and localization, cytokine receptor binding, TNF receptor binding, apoptosis and IGF binding. These functional enrichment analyses provide greater insights into novel molecular and genetic mechanisms underlying responses to GIN, not only in sheep but also in other closely related species. Detection of the expression levels of these 58 biomarker genes may contribute to development of diagnostic tools indicative of a parasite resistant phenotype in sheep and possibly other livestock species. However, we emphasise that these are 58 potentialbiomarkers and hence a further experimental validation is needed to confirm the transcription and translation levels using other quantitative methods such as real-time PCR and western blotting before these markers are widely adapted for practical use. This is the first study to apply the concept of estimating breeding values of animals to gene expression traits and reveals 11 heritable candidate biomarkers (with heritabilities in the range of 0.05 to 0.92). These 11 biomarkers could be used in selection of animals for nematode resistance within an expression assisted selection (EAS) framework if a desirable association between key hub/biomarker genes and resistance is validated through further targeted functional studies.Abbreviations and glossary of terms
| Biomarker | A hub gene which is also highly correlated with phenotype or experimental parameter |
| CE | Co-expressed or genes that have highly correlated expression profiles |
| DE | Differentially expressed or genes that have different expression profiles |
| eEBV | expression Estimated Breeding Values quantifying genetic ability of animals to transmit gene expression levels at specific conditions to their progeny generation |
| e-trait | expression trait which denotes mRNA abundance of a given gene transcript observed in a given cell type or tissue |
| Expression Assisted Selection (EAS) | Selection of animals (or plants) for breeding purposes based on genetic merit or expression breeding values for a given e-trait |
| GIN | Gastrointestinal nematodes |
| HC | Haemonchus contortus |
| HCA | Abomasal sample from sheep infected with H. contortus |
| HCB | White blood cell sample from sheep infected with H. contortus |
| Hub gene | A highly connected gene within a gene module or a gene highly connected to all other genes in a (sub)network that it has some essential functions in a biological context. |
| L0, L3, L7, L21 | Length of infection time, 0, 3, 7 and 21 days, respectively, after infection by a parasite |
| ME | Module eigengene corresponds to the first principal component of a given gene module. It can be considered as pseudo-gene representative of the gene expression for the whole module |
| Module | A cluster of highly inter-connected genes or a sub-network within co-expression networks. |
| Scale-free topology | Gene networks are characterized by specific topological features (e.g. high degree of clustering and fat tailed shapes in the distribution of their connectivities). Most of them are known to exhibit the so-called scale-free property and feature a power-law distribution P(k) ≈ k–γ in the node connectivity k (degree). |
| TC | Trichostrongylus colubriformis |
| TCB | White blood cell samples from sheep infected with T. colubriformis |
| TCG | Gut sample from sheep infected with T. colubriformis |
| Topological Overlap Measure | A measure of inter-connectedness between two genes. |
| WGCNA | Weighted gene co-expression network analysis, a connectivity based method that detects clusters of highly inter-connected genes based on soft thresholding using power function and scale-free topology |
| WBC | Peripheral white blood cells. |
Competing interests
The authors declare that they have no competing interests.Authors' contributions
HNK conceived and developed this systems genetics project, conducted all the analyses, interpreted the results and wrote this article. NA conducted the sheep challenge experiment and collected data. NWH contributed to DE analyses and the writing of the manuscript. All authors read, commented and approved the manuscript.Acknowledgements
The experiment was financially supported by SheepGenomics, an initiative of Australian Wool Innovation Limited and Meat and Livestock Australia.References
- N. Andronicos, P. Hunt and R. Windon, Int. J. Parasitol., 2010, 40, 417–429 CrossRef CAS.
- D. Artis, S. Shapira, N. Mason, K. Speirs, M. Goldschmidt, J. Caamańo, H. Liou, C. Hunter and P. Scott, J. Immunol., 2002, 169, 4481–4487 CAS.
- A. Balic, V. M. Bowles and E. N. T. Meeusen, Vet. Immunol. Immunopathol., 2000, 75, 109–120 CrossRef CAS.
- A. Balic, V. M. Bowles and E. N. T. Meeusen, Parasite Immunol., 2002, 24, 39–46 CrossRef CAS.
- Y. Benjamini and Y. Hochberg, J. R. Stat. Soc. Ser. B (Methodol.), 1995, 57, 289–300 Search PubMed.
- M. R. J. Carlson, B. Zhang, Z. X. Fang, P. S. Mischel, S. Horvath and S. F. Nelson, BMC Genomics, 2006, 7, 40 CrossRef.
- L. J. Cliffe, C. S. Potten, C. E. Booth and R. K. Grencis, Infect. Immun., 2007, 75, 1556–1564 CrossRef CAS.
- H. J. S. Dawkins, R. G. Windon and G. K. Eagleson, Int. J. Parasitol., 1989, 19, 199–205 CrossRef CAS.
- G. Dennis Jr, B. T. Sherman, D. A. Hosack, J. Yang, W. Gao, H. C. Lane and R. A. Lempicki, GenomeBiology, 2003, 4, P3 CrossRef.
- C. Diez-Tascon, O. M. Keane, T. Wilson, A. Zadissa, D. L. Hyndman, D. B. Baird, J. C. Mcewan and A. M. Crawford, Physiol. Genomics, 2005, 21, 59–69 Search PubMed.
- V. D. Dixit and D. D. Taub, Exp. Gerontol., 2005, 40, 900–910 CrossRef CAS.
- T. F. Fuller, A. Ghazalpour, J. E. Aten, T. A. Drake, A. J. Lusis and S. Horvath, Mamm. Genome, 2007, 18, 463–472 CrossRef.
- L. Gautier, L. Cope, B. M. Bolstad and R. A. Irizarry, Bioinformatics, 2004, 20, 307–315 CrossRef CAS.
- N. Hong, N. Kabra, S. Hsieh, D. Cado and A. Winoto, J. Immunol., 1999, 163, 1888–1893 CAS.
- N. J. Hudson, A. Reverter, Y. H. Wang, P. L. Greenwood and B. P. Dalrymple, PLoS One, 2009, 4(10), e7249 CrossRef.
- A. Ingham, A. Reverter, R. Windon, P. Hunt and M. Menzies, Int. J. Parasitol., 2008, 38, 431–442 CrossRef CAS.
- H. N. Kadarmideen, IET Syst. Biol., 2008, 2, 423–441 Search PubMed.
- H. N. Kadarmideen, Y. J. Li and L. L. G. Janss, Genet. Res., 2006, 88, 119–131 CrossRef CAS.
- H. N. Kadarmideen, R. Rekaya and D. Gianola, Anim. Sci., 2001, 73, 229–240 Search PubMed.
- H. N. Kadarmideen and A. Reverter, CAB Rev., 2007, 2, 16 Search PubMed.
- H. N. Kadarmideen, P. Von Rohr and L. L. G. Janss, Mamm. Genome, 2006, 17, 548–564 CrossRef CAS.
- H. N. Kadarmideen and S. Wegmann, J. Dairy Sci., 2003, 86, 3685–3693 CrossRef CAS.
- A. Krawczyk and E. Slota, Helminthologia, 2009, 46, 3–8 CrossRef CAS.
- P. Langfelder and S. Horvath, BMC Bioinf., 2008, 9, 559 CrossRef.
- P. Langfelder, M. Mehrablan, E. E. Schadt, A. J. Lusis and S. Horvath, Circulation, 2008, 118(18), S327.
- P. Langfelder, B. Zhang and S. Horvath, Bioinformatics, 2008, 24, 719–720 CrossRef CAS.
- D. MacGlashan Jr., L. M. Lichtenstein, J. McKenzie-White, K. Chichester, A. J. Henry, B. J. Sutton and H. J. Gould, J. Allergy Clin. Immunol., 1999, 104, 492–498 CrossRef CAS.
- R. M. Maizels and A. Balic, J. Infect. Dis., 2004, 190, 427–429 CrossRef CAS.
- F. J. Malveaux, M. C. Conroy, N. F. Adkinson and L. M. Lichtenstein Jr., J. Clin. Invest., 1978, 62, 176–181 CrossRef CAS.
- M. J. Mason, G. P. Fan, K. Plath, Q. Zhou and S. Horvath, BMC Genomics, 2009, 10, 327 CrossRef.
- M. Menzies, A. Reverter, N. Andronicos, P. Hunt, R. Windon and A. Ingham, Parasite Immunol., 2010, 32, 36–46 CrossRef CAS.
- J. Moore, Hum. Hered., 2003, 56, 73–82 CrossRef.
- R. A. Mrode, Linear models for the prediction of animal breeding values, CAB International, Wallingford Oxon, UK, 2nd edn, 2005, 344pp Search PubMed.
- J. M. Mugambi, J. O. Audho, S. Njomo and R. L. Baker, Vet. Parasitol., 2005, 127, 263–275 CrossRef CAS.
- Y. Okamatsu, K. Matsuda, I. Hiramoto, H. Tani, K. Kimura, Y. Yada, T. Kakuma, S. Higuchi, M. Kojima and T. Matsuishi, Pediatr. Int. (Richmond, Aust.), 2009, 51, 9–13 Search PubMed.
- C. Pereira, E. Bachli and G. Schoedon, Curr. Atheroscler. Rep., 2009, 11, 236–242 Search PubMed.
- J. G. Perrigoue, S. A. Saenz, M. C. Siracusa, E. J. Allenspach, B. C. Taylor, P. R. Giacomin, M. G. Nair, Y. Du, C. Zaph, N. van Rooijen, M. R. Comeau, E. J. Pearce, T. M. Laufer and D. Artis, Nat. Immunol., 2009, 10, 697–705 CrossRef CAS.
- E. Ravasz, A. L. Somera, D. A. Mongru, Z. N. Oltvai and A. L. Barabasi, Science, 2002, 297, 1551–1555 CrossRef CAS.
- M. H. Roos, Drug Resistance in the Sheep Nematode Parasite Haemonchus contortus, Mechanisms and Clinical Perspectives, inAntimicrobial Drug Resistance: Clinical and Epidemiological Aspects, ed. David L. Paterson, ch. 4, 2009 Search PubMed.
- C. G. J. Saris, S. Horvath, P. W. J. Van Vught, M. A. Van Es, H. M. Blauw, T. F. Fuller, P. Langfelder, J. Deyoung, J. H. J. Wokke, J. H. Veldink, L. H. Van Den Berg and R. A. Ophoff, BMC Genomics, 2009, 10, 405 CrossRef.
- B. S. Sihra, O. M. Kon, J. A. Grant and A. B. Kay, J. Allergy Clin. Immunol., 1997, 99, 699–706 CrossRef CAS.
- G. K. Smyth, Stat. Appl. Genet. Mol. Biol., 2004, 3, 3 Search PubMed.
- C. L. Sokol, N. Q. Chu, S. Yu, S. A. Nish, T. M. Laufer and R. Medzhitov, Nat. Immunol., 10, 713–720 Search PubMed.
- L. Wang, H. Tang, V. Thayanithy, S. Subramanian, A. L. Oberg, J. M. Cunningham, J. R. Cerhan, C. J. Steer and S. N. Thibodeau, Cancer Res., 2009, 69, 9490–9497 CrossRef CAS.
- N. S. Watson-Haigh, H. N. Kadarmideen and A. Reverter, Bioinformatics, 2010, 26, 411–413 CrossRef CAS.
- R. G. Windon, Vet. Immunol. Immunopathol., 1996, 54(1–4), 245–254 CrossRef CAS.
- X. Yang, J. J. Letterio, R. J. Lechleider, L. Chen, R. Hayman, H. Gu, A. B. Roberts and C. Deng, EMBO J., 1999, 18, 1280–1291 CrossRef CAS.
- J. A. T. Young and A. Dillin, Proc. Nat. Acad. Sci. U. S. A., 2004, 101, 12781–12782 CrossRef CAS.
- B. Zhang and S. Horvath, Stat. Appl. Genet. Mol. Biol., 2005, 4, 17 Search PubMed.
- Q. Zheng and X. Wang, Nucleic Acids Res., 2008, 36(suppl 2), W358–W363 CrossRef CAS.
Footnote |
| † Electronic supplementary information (ESI) available: Files 1–13. See DOI: 10.1039/c0mb00190b |
| This journal is © The Royal Society of Chemistry 2011 |