Synthetic lethal hubs associated with vincristine resistant neuroblastoma
Raul
Fechete
a,
Susanne
Barth
b,
Tsviya
Olender
c,
Andreea
Munteanu
d,
Andreas
Bernthaler
a,
Aron
Inger
c,
Paul
Perco
a,
Arno
Lukas
a,
Doron
Lancet
c,
Jindrich
Cinatl Jr.
e,
Martin
Michaelis
e and
Bernd
Mayer
*af
aemergentec biodevelopment GmbH, Gersthofer Strasse 29-31, 1180 Vienna, Austria. Fax: +43 1 403 49 66 19; Tel: +43 1 403 49 66
bblue-drugs GmbH, Komturstrasse 3A, 60528 Frankfurt am Main, Germany
cDepartment of Molecular Genetics and the Crown Human Genome Center, Weizmann Institute of Science, Rehovot 76100, Israel
dICREA-GRIB Complex Systems Lab, UPF, Parc de Recerca Biomedica Barcelona Dr. Aiguader 88, E-08003 Barcelona, Spain
eInstitut für Medizinische Virologie, Klinikum der J.W. Goethe-Universität, Paul Ehrlich-Str. 40, 60596 Frankfurt am Main, Germany
fInstitute for Theoretical Chemistry, University of Vienna, Währingerstrasse 17, 1090 Vienna, Austria. E-mail: bernd.mayer@univie.ac.at
First published on 28th October 2010
Abstract
Chemotherapy of cancer experiences a number of shortcomings including development of drug resistance. This fact also holds true for neuroblastoma utilizing chemotherapeutics as vincristine. We performed a comparative analysis of molecular and cellular mechanisms associated with vincristine resistance utilizing cell line as well as human tissue data. Differential gene expression analysis revealed molecular features, processes and pathways afflicted with drug resistance mechanisms in general, and specifically with vincristine significantly involving actin associated features. However, specific mode of resistance as well as underlying genotype of parental, vincristine sensitive cells apparently exhibited significant heterogeneity. No consensus profile for vincristine resistance could be derived, but resistance-associated changes on the level of individual neuroblastoma cell lines as well as individual patient profiles became clearly evident. Based on these prerequisites we utilized the concept of synthetic lethality aimed at identifying hub proteins which when inhibited promise to induce cell death due to a synthetic lethal interaction with down-regulated, chemoresistance associated features. Our screening procedure identified synthetic lethal hub proteins afflicted with actin associated processes holding synthetic lethal interactions to down-regulated features individually found in all chemoresistant cell lines tested, therefore promising an improved therapeutic window. Verification of such synthetic lethal hub candidates in human neuroblastoma tissue expression profiles indicated the feasibility of this screening approach for addressing vincristine resistance in neuroblastoma.
Introduction
Neuroblastoma is a tumor of the peripheral nervous system and the most common extracranial solid tumor of childhood.1,2 This disease is one of the few malignancies where spontaneous regression is reported, however, depending on stage and biological characteristics (e.g. MYCN amplification) chemotherapy is indicated.3,4Drugs shown to have substantial efficacy include anthracyclines (doxorubicin), platinum compounds (carboplatin), etoposide, vincristine, and alkylating agents as cyclophosphamide.1 One of the major clinical issues in chemotherapy is drug resistance.5 Resistance to a specific drug is either intrinsic,6 where the patient does not respond to therapy in the first place, or acquired, where the patient becomes non-responsive in the course of treatment.7 Molecular mechanisms responsible for resistance are manifold including drug transport, compensatory processes leading to increased drug metabolism, or elimination/modification of the drug target, among others.8,9Vinca alkaloids such as vincristine act as mitotic inhibitors by binding to tubulin and halting polymerization, consequently hampering microtubule assembly resulting in cell cycle arrest in the mitosis metaphase.10 One phenomenological representation of vincristine resistance is changes in the cytoskeleton structure.11,12 Neuroblastoma is susceptible to developing drug resistance involving various specific mechanisms such as loss of p53 function,13 down-regulation of ERK1/2 phosphorylation,14 or up-regulation of p-glycoprotein (ABCB1).15 The clinical implications of drug resistance are further augmented by an increased invasiveness of the chemoresistant tumor cells. The particular aggressiveness of chemoresistant tumor cells has been described both in the context of neuroblastoma and vincristine,16 as well as in a more general context.17
Mechanisms triggering intrinsic as well as acquired vincristine resistance are coupled to the genomic state of the parent tumor cell, and as for other tumors, neuroblastoma shows considerable heterogeneity impacting clinical outcome. Factors of relevance include copy number variation, chromosome gains, and changes in differential gene expression.18–20 Options for tackling chemoresistant neuroblastoma in clinical practice are limited; various drugs such as bortezomib,21 artesunate22 or 131I-metaiodobenzylguanidine23 have been evaluated in vitro as well as in vivo. One strategy is usage of drugs whose mode of action differs fundamentally from vincristine, thereby increasing the change for circumventing given vincristine resistance mechanisms.
Heterogeneity in solid tumors regarding genomic status, associated expression profile and eventual routes towards developing resistance under selective pressure of chemotherapeutics certainly impose a general problem for virtually any targeted therapy in cancer. In this context, the application of the concept of synthetic lethality has been proposed. Synthetic lethality describes a cellular condition in which two (or more) non-allelic and non-essential mutations being not lethal on their own become lethal when present within the same cell.24 Each single mutation may show synthetic sickness, but the effect of the double mutation is synergistic and not merely additive.25,26 Systematic analysis has been performed in yeast and Caenorhabditis elegans to determine synthetically lethal gene pairs.27–31
Synthetic lethality has been pursued substantially in cancer research,32–35 as this approach promises increased sensitivity for cancer cells while at the same time providing a broader therapeutic window. Only cells showing a particular mutation are specifically affected when applying a drug addressing a single lethal partner to this mutated entity. One of the most prominent examples resting on synthetic lethal interactions is PARP (poly(adenosine diphosphate-ribose) polymerase) inhibitors coupled with BRCA1 or BRCA2 mutation, all acting compensatory in repair of ssDNA breaks. Clinical trials utilizing PARP inhibitors in BRCA associated cancers as e.g. done for ovarian cancer indeed reported decreased adverse effects and at the same time anti-tumoral activity.36 On the basis of population-based case-control studies, the estimated risk of being diagnosed with ovarian cancer increases by a factor of about 15 when carrying a BRCA1 mutation.37 However, the prevalence of BRCA1 mutations in subjects diagnosed with ovarian cancer is estimated to be only about 5%,38 indicating a successful therapy based on BRCA1-associated synthetic lethality only for a fraction of patients. We delineate from this example that drugs implicating a synthetic lethal mode of action may offer less side effect prone therapy with improved specificity, but still being hampered in broad efficacy (which we in the following denote as ‘coverage’): only patients whose tumor is characterized by a specific mutation (as for BRCA) are amenable by a drug addressing a synthetic lethal partner, all other tumors are not covered.
To tackle the issue of coverage of e.g. neuroblastoma in general, independent of the genomic state found in individual patients, the concept of protein hubs may be of value.39Protein interaction networks show a scale free topology, i.e. the degree distribution (where the degree indicates the number of interactions per protein node) follows a power law. This general principle appears also to be true for networks of synthetic lethal interactions:40 most genes may have none or a single synthetic lethal partner, whereas a small set of hubs may have many such interactions. If a synthetic lethal hub is hampered in its function, all cells where at least one out of the n synthetic lethal partners of a specific hub is mutated will be affected. Utilizing this principle may increase the coverage of cancerous genotypes, as schematically depicted in Fig. 1.
![Scheme for exemplifying the concept of profile specific synthetic lethality in target identification. Top layer: start situation is a reference cell population (normal, drug sensitive) and various cell populations (1, 2, …, n) being malignant (or drug resistant). Middle layer: for each cell population specific gene expression is given for the features A1, A2, B, … An. Bottom layer: down-regulation of features in the different cell populations. Down-regulation of (non-essential) B only has no effect on cell viability of the reference cell population. Joint down-regulation of [B, A1], [B, A2] or [B, An] results in synthetic lethality for the cell populations 1, 2 and n.](/image/article/2011/MB/c0mb00082e/c0mb00082e-f1.gif) | ||
| Fig. 1 Scheme for exemplifying the concept of profile specific synthetic lethality in target identification. Top layer: start situation is a reference cell population (normal, drug sensitive) and various cell populations (1, 2, …, n) being malignant (or drug resistant). Middle layer: for each cell population specific gene expression is given for the features A1, A2, B, … An. Bottom layer: down-regulation of features in the different cell populations. Down-regulation of (non-essential) B only has no effect on cell viability of the reference cell population. Joint down-regulation of [B, A1], [B, A2] or [B, An] results in synthetic lethality for the cell populations 1, 2 and n. | ||
A general setup for this concept includes a reference cell population holding as phenotype e.g. ‘healthy’ or ‘chemosensitive’ and n tumor cell populations holding as phenotype ‘cancerous’ or ‘chemoresistant’. This setting refers to the assumption of a stable reference genotype, but numerous different cancer genotypes. We assume that each of these tumor cell populations holds at least one mutation of a non-essential gene (in the following denoted as feature), A1, A2, An. If we now identify and functionally interfere with a non-essential feature B being synthetic lethal for all combinations of mutated features Ai (B–A1, B–A2, B–An) synthetic lethality will result for all cancerous (or chemoresistant) cell populations, but at the same time leaving the reference cell population unharmed (as functionally hampered B on its own is non-essential). We denote such a feature B as a synthetic lethal hub.
This concept may now be expanded to a clinical setting with a reference gene expression profile characterizing features for the healthy (or chemosensitive) state, and individual gene expression profiles of tumors from individual patients. Having such profiles in hand allows identification of synthetic lethal hubs B according to the scheme given in Fig. 1. Features B are to be not differentially regulated when comparing reference and tumor samples, and have to be in a synthetic lethal interaction with partners A, where within the total set of features A at least one feature A′ is down-regulated in each single patient expression profile. If such a feature B could be identified, maximum coverage (efficacy with respect to the heterogeneous tumor cell populations) of a drug directed against the feature B would be achieved, as synthetic lethality would be induced for each individual cancer entity (patient specific tumor).
We in the following exemplify this concept for vincristine resistant neuroblastoma utilizing gene expression profiles from vincristine sensitive and resistant cell lines, and expand our findings of synthetic lethal hub candidates B to gene expression profiles derived from human neuroblastoma tissue samples.
Results
Features and processes involved in vincristine resistance
Analysis of the gene expression data sets available for vincristine sensitive and resistant neuroblastoma cell lines provided 43 features being significantly differentially regulated when comparing the six cell lines in their vincristine sensitive and resistant phenotype (in the following denoted as ‘cell line consensus’), and 834 features showing a fold change of at least five in at least one out of the six cell lines when comparing the sensitive and resistant status for each individual cell line (in the following denoted as ‘cell line fold change’). Furthermore, 2001 features were identified in human tumor tissue when comparing samples from patients with disease free survival and samples from patients experiencing tumor recurrence (in the following referred to as ‘human tissue feature set’). Genes associated with actin biology are present in all feature sets, specifically 3 features were found in the cell line consensus, 35 in the cell line fold change, and 112 in the human tissue feature set.Certainly, both the in vitro as well as in vivo case-control studies resemble only approximations of vincristine resistance in the clinical setting. The cell lines explicitly address changes associated with adaption to vincristine; however, the changes do not necessarily mirror resistance mechanisms also found in the in vivo situation. In vivo data on the other hand do not explicitly reflect the development of resistance as endpoint, but the finding of disease progression is used as a surrogate marker for the potential development of resistance in these patients. In light of these considerations the validity of the given expression profiles with respect to chemoresistance as well as the relevance of the cell line models with respect to neuroblastoma in the human (clinical) setting needs to be addressed in the first place.
For assessing the comparability of cell line and human tissue data the overlap of identified features on the level of NCBI gene symbols was retrieved as presented in Table 1.
| Data sets | Up | Down | Total | |
|---|---|---|---|---|
| C | 21 | 22 | 43 | |
| B | 437 | 397 | 834 | |
| A | 471 | 1530 | 2001 |
| B, C | A, C | A, B | A, B, C | |
|---|---|---|---|---|
| Top panel summarizes the number of features being up- or down-regulated in the cell line consensus (C), fold change (B), and human tissue (A). Bottom panel shows the number of overlapping features when comparing the three feature lists A, B, C. | ||||
| Feature overlap, up-regulation | 3 | 0 | 12 | 0 |
| Feature overlap, down-regulation | 8 | 3 | 50 | 1 |
One feature, namely PTBP2 (polypyrimidine tract binding protein 2) was identified in all feature lists. PTBP2 plays a role in pre-mRNA splicing and in the regulation of translation, and is primarily expressed in brain. Various reports indicate the relevance of PTBP2 in mesothelioma, glioblastoma and other tumors of the central nervous system, also linked to tumor cell dissemination, metastasis and chemoresistance. Additional 62 features were found differentially regulated in both patient and cell line data.
Various meta-studies aimed at comparing the direct overlap of features identified in independent gene expression studies for a given cancer were published, frequently identifying only minor overlap,41,42 but still the same molecular processes and pathways appeared as populated by identified features. Analysis of significant enrichment of features in particular pathways (Gene Set Enrichment Analysis, GSEA)43 using cell line and human tissue data was assessed by using a Chi2 test comparing the number of differentially regulated features located in a specific pathway and the total number of genes assigned to this pathway. Enrichment analysis utilizing cell line and human tissue data on the level of KEGG pathways provided two cancer pathways and axon guidance as significantly enriched by features from both sample sources. Furthermore, distinct sets of pathways were identified as enriched by either only the human tissue (including cell cycle and replication) and/or the cell line features (like adhesion processes), respectively. The complete list of significantly affected pathways is presented in Table 2.
| Data set | KEGG code | Pathway name | Total # features | Found features | p-Value |
|---|---|---|---|---|---|
| KEGG pathways being significantly affected in vincristine resistance. Given is the data set (A for human tissue, B for the fold change list derived from cell lines), the KEGG pathway code, the pathway name, the total number of features given for the pathway (total # of features), the number of features being differentially regulated in this pathway (found features), and the p-value of a Chi2 test comparing the number of present and the number of affected features for a specific pathway. | |||||
| A, B | hsa05200 | Pathways in cancer | 329 | 92/27 | <0.0001/0.0010 |
| A, B | hsa05212 | Pancreatic cancer | 72 | 22/8 | 0.0049/0.0296 |
| A, B | hsa04360 | Axon guidance | 129 | 31/14 | 0.0282/0.0026 |
| A | hsa04110 | Cell cycle | 113 | 44 | <0.001 |
| A | hsa03030 | DNA replication | 36 | 18 | <0.001 |
| A | hsa05222 | Small cell lung cancer | 86 | 30 | <0.001 |
| A | hsa05016 | Huntington's disease | 181 | 51 | <0.001 |
| A | hsa03420 | Nucleotide excision repair | 44 | 19 | <0.001 |
| B | hsa04512 | ECM-receptor interaction | 84 | 14 | <0.001 |
| B | hsa04510 | Focal adhesion | 201 | 17 | 0.009 |
| B | hsa05218 | Melanoma | 71 | 8 | 0.028 |
| B | hsa04514 | Cell adhesion molecules (CAMs) | 131 | 11 | 0.046 |
| B | hsa00565 | Ether lipid metabolism | 33 | 5 | 0.047 |
For the consensus expression set holding features being differentially regulated when comparing all six sensitive with the six resistant counterparts only 43 features were identified. In GSEA only one pathway came close to significance using this consensus data set, namely ‘ABC transporters’ with a p-value of 0.07.
Also on the level of pathways the involvement of actin associated mechanisms became evident. Fig. 2 provides a schematic view of the intersection of the KEGG pathways ‘focal adhesion’ (KEGG identifier hsa04510) and ‘pathways in cancer’ (KEGG identifier hsa05200). Features identified as differentially regulated for sensitive and resistant cell lines affected ECM– and chemokine–chemokine receptor interactions leading, for both pathways, to the activation of the protein tyrosine kinase 2 (FAK) as well as the phosphoinositide-3-kinase (PI3K). Via paxilin the former can lead to the regulation of the actin cytoskeleton, while the latter leads to cell survival and proliferation via the p21 protein (Cdc42/Rac)-activated kinase 4 (PAK). Strong indications for the involvement of differentially regulated features in cell survival are provided by v-akt murine thymoma viral oncogene homolog 2 (PKB/AKT2) which together with the cyclin-dependent kinase inhibitor 1A and B (P21/P27), as well as p53 were found affected in their expression levels.
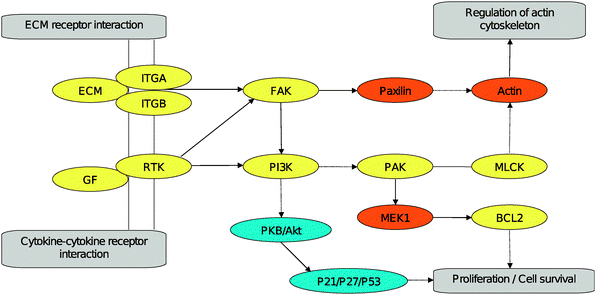 | ||
| Fig. 2 Reconstruction of pathway segments (utilizing the KEGG pathways ‘focal adhesion’ and ‘pathways in cancer’) including features identified in the gene expression experiments comparing sensitive and resistant cell lines. Features being differentially regulated and actin associated are marked in yellow, actin associated features not differentially regulated are marked in orange, features being differentially regulated but not actin associated are marked in blue. | ||
Next to identifying the overlap of cell line and human tissue data on the level of individual features and molecular pathways, the specific involvement of given features in chemoresistance and neuroblastoma may support the relevance of the data sets in the context of neuroblastoma vincristine resistance in the clinical setting.
To address this issue, each feature was queried in NCBI PubMed together with the MeSH terms “drug resistance, neoplasm” and “neuroblastoma” for deriving already reported association of the features with these terms. The number of citations of a certain gene in the context of drug resistance and neuroblastoma was retrieved by invoking the ESearch tool provided by the NCBI Entrez Programming Utilities tool set (http://eutils.ncbi.nlm.nih.gov/corehtml/query/static/esearch_help.html). Results are presented in Table 3.
| Cell lines | Human tumor tissue | ||||||
|---|---|---|---|---|---|---|---|
| Gene symbol | DR & NB | DR | NB | Gene symbol | DR & NB | DR | NB |
| Features (only the top hits are listed) being differentially regulated in the cell lines (left) and in human tumor tissue (right) and assigned to drug resistance and/or neuroblastoma. Given are the gene symbol and the number of reports in PubMed associated with a given gene based on the search terms ‘drug resistance, neoplasm and neuroblastoma’ (DR & NB), ‘drug resistance, neoplasm’ (DR), and ‘neuroblastoma’ (NB). Features identified in both data sets are given in bold. Numbers holding an asterisk are computed as statistically significant for a given category. | |||||||
| ABCB1 | 27 | 87* | 2505* | MYC | 20 | 1152* | 191* |
| JUN | 1 | 132* | 149* | MYCN | 23 | 755* | 23 |
| KIT | 1 | 52 | 201* | CA2 | 0 | 697* | 39* |
| CDKN1A | 3 | 57* | 163* | TNF | 3 | 131* | 417* |
| TNFRSF10B | 2 | 23 | 147* | BAX | 5 | 156* | 379* |
| VIP | 0 | 96* | 6 | ERBB2 | 1 | 23 | 436* |
| BID | 1 | 21 | 78* | ACHE | 1 | 271* | 146* |
| HTR3A | 0 | 96* | 0 | CASP8 | 8 | 118* | 269* |
| RET | 0 | 67* | 8 | CASP9 | 8 | 107* | 197* |
| CDKN2A | 0 | 31 | 38* | JUN | 1 | 132* | 149* |
| PDGFRA | 0 | 9 | 60* | BCL2L1 | 2 | 54* | 205* |
| ANXA5 | 0 | 28 | 38* | KITLG | 2 | 99* | 158* |
| NMB | 0 | 42* | 9 | KIT | 1 | 52 | 201* |
| GEM | 0 | 4 | 38* | SRC | 0 | 88* | 160* |
| GAL | 0 | 31 | 10 | DES | 0 | 135* | 96* |
| ATM | 0 | 11 | 29 | BID | 1 | 21 | 78* |
| CXCR4 | 1 | 20 | 19 | RET | 0 | 67* | 8 |
| LYN | 0 | 3 | 35 | CDKN2A | 0 | 31 | 38* |
| ABCC4 | 1 | 1 | 32 | GAL | 0 | 31 | 10 |
| ALK | 0 | 24 | 8 | ABCC4 | 1 | 1 | 32 |
Joint occurrence of resistance-associated features involved in both cell line and human tissue is given among others for JUN, KIT, BID, RET, CDKN2A, GAL and ABCC4. Features well known in resistance such as ABCB1 (N-glycoprotein, described as a major active transport mechanism for drug resistance)44,45 or MYC (where patients with amplified MYCN are known to have a poorer prognosis)46 were only identified for either cell line or human system.
For further evaluating the significance of these findings, the PubMed database was queried for drug resistance and neuroblastoma association for all 15![[thin space (1/6-em)]](https://www.rsc.org/images/entities/char_2009.gif) 547 genes assigned in PubMed, resulting in 2004 genes with at least one reference to “drug resistance” and 1987 genes with at least one reference to “neuroblastoma”.
547 genes assigned in PubMed, resulting in 2004 genes with at least one reference to “drug resistance” and 1987 genes with at least one reference to “neuroblastoma”.
From the double standard deviation retrieved from the distribution of feature-to-term assignments as computed for the reference genes, all features from the cell line and human tissue lists with at least 36 references for neuroblastoma or at least 53 references for drug resistance can be considered significant in the respective category (see Table 3).
To evaluate the enrichment of the terms “neuroblastoma” and “resistance” for the cell line and human data feature sets a Fisher's exact test was performed. Each of the three feature lists was split into groups holding either genes with no reference or genes with at least one reference in the respective MeSH category. The number of genes assigned to these groups was tested against the respective number of features per group derived for the reference set of 15547 genes. All three gene sets showed statistically significant enrichment (p < 0.05) in both neuroblastoma and drug resistance.
Analysis results from feature comparison, gene set enrichment and literature association indicated the validity of the expression data sets in the context of neuroblastoma chemoresistance. Nevertheless, the substantial heterogeneity and complexity of the cell line and human profiles also became evident. This is true on both levels, namely genotype (associated expression profiles of analyzed tumor cells and tissue samples) as well as processes responsible for embedding vincristine resistance. This aspect also becomes clear when analyzing the cell line expression profiles. Fig. 3 provides the result of hierarchical clustering of the expression profiles derived from six sensitive and six resistant cell lines.
 | ||
| Fig. 3 Hierarchical clustering of cell line expression profiles applying complete linkage and Pearson correlation as distance measure. The expression profiles for six sensitive and six resistant cell lines, each in triplicate, are shown. | ||
The cell lines, although on the phenotype level clearly assignable to being vincristine sensitive or resistant, cluster by cell type. The difference in expression status of the individual sensitive cell lines exceeded changes introduced by rendering the cell resistant to vincristine. This finding is in line with the comparably low number of features (43) identified as differentially regulated in the cell line consensus compared to the 834 features being significantly affected in at least one cell line when comparing sensitive and resistant phenotype. For these 834 features only 15% were found affected in two, and only 1% in three cell lines. One single feature was found up-regulated in all six cell lines (ABCB1), consequently also being a member of the consensus feature list.
These results support the arguments in favor of a synthetic lethality approach as an attempt to target different features in different samples for reflecting this heterogeneity rather than targeting specific features resting on a putative “consensus” over all samples.
Identification of synthetic lethal hubs
Gene expression profiles for six vincristine sensitive cell lines and the corresponding resistant phenotypes including 25123 features associated to 21012 genes were available as start point. Each expression value was given in triplicate, and the average was calculated for each feature and each cell line with a given resistance phenotype. For each feature and cell line the fold change comparing the sensitive and resistant phenotype was computed. Fold change values x found below 1.0 were re-computed as −1/x. Genes being represented on the array by more than one probe were consolidated on this fold change level by calculating the median fold change over all probes.
One important criterion for identifying synthetic lethal hubs was their ‘validity’ in all six cell lines (see Fig. 1). To be valid, the fold changes of a potential synthetic lethal hub (B) had to be above a specific fold change threshold in each of the six cell lines. Ideally, this fold change should be positive for all cell lines (i.e. a feature B is up-regulated in the resistant cell line). We selected a minimum fold change of −2.0 as valid cutoff for respecting some variability of the array signals as identified by the triplicate measurements, but still assuring that a given B is present (a natural requirement for enabling a subsequent knock-down of a feature B).
As second criterion, a partner for a given B was considered as valid from the fold change perspective if this partner A showed a fold change below −3.0 in at least one resistant cell line, i.e. being substantially down-regulated in the resistant situation for at least one cell line. Next to these specific fold change requirements, a third constraint was imposed on the selection of A and B features, namely A and B had to be a synthetic lethal pair as determined on the basis of the yeast-to-human matching of synthetic lethal partners identified in Saccharomyces cerevisiae.
Applying these criteria on the six cell lines resulted in the selection of 83 features (synthetic lethal hub genes B) having down-regulated synthetic lethal partners A assigned in all six cell lines, consequently providing 100% cell line coverage. For each selected B, there was at least one A for each cell line which (i) was down-regulated in the resistant phenotype in at least one (or more) cell lines and (ii) B and A were assigned as synthetic lethal partners following the yeast data.
Due to the evident importance of actin associated features in the context of vincristine resistance, only synthetic lethal hubs functionally assigned to this category were further considered. Among the 83 features 13 were also present in the actin feature list (Table 4).
| Gene symbol | Name | min FC | max FC | avg FC | # of A's |
|---|---|---|---|---|---|
| The list of actin associated synthetic lethal hubs covering all six cell lines. Given are gene symbol and name, the minimum (min FC), maximum (max FC) and average fold change (avg FC) when comparing sensitive and resistant cell lines, as well as the number of synthetic lethal partners A (# of A's). | |||||
| ACTA1 | Actin, alpha 1, skeletal muscle | −1.71 | 1.96 | 0.07 | 37 |
| ACTB | Actin, beta | −1.73 | 1.96 | 0.09 | 37 |
| ACTG1 | Actin, gamma 1 | −1.72 | 1.24 | −0.24 | 37 |
| ACTR1B | Arp1 actin-related protein 1 homolog b, centractin beta | −1.15 | 1.47 | −0.26 | 18 |
| ARPC2 | Actin related protein 2/3 complex, subunit 2, 34 kDa | −1.78 | 1.22 | −0.07 | 21 |
| ARPC5 | Actin related protein 2/3 complex, subunit 5, 16 kDa | −1.44 | 1.39 | 0.39 | 19 |
| ARPC5L | Actin related protein 2/3 complex, subunit 5-like | −1.22 | 1.45 | −0.31 | 19 |
| FMN1 | Formin 1 | −1.38 | 1.16 | −0.04 | 12 |
| FMN2 | Formin 2 | −1.72 | 2.25 | 0.45 | 12 |
| MAP2K1 | Mitogen-activated protein kinase kinase 1 | −1.28 | 1.52 | 0.46 | 19 |
| MAP2K2 | Mitogen-activated protein kinase kinase 2 | −1.42 | 2.06 | 0.08 | 19 |
| PKN1 | Protein kinase N1 | −1.59 | 2.57 | 0.17 | 20 |
| PPP1CA | Protein phosphatase 1, catalytic subunit, alpha isoform | −1.34 | 1.66 | 0.48 | 19 |
For these 13 hub features, 94 synthetic lethal partners (A's) were identified, the majority of which was found to be associated with several hub features. Further details for the synthetic lethal partners A are listed in Table 5. Eight of the 94 genes are also found to be actin associated. For further characterizing the set of 94 partners, GSEA was performed on the level of Gene Ontology (GO) terms47 as depicted in Table 6.
| Gene symbol | max FC | avg FC | # of CL | # of B's | Gene | max FC | avg FC | # of CL | # of B's |
|---|---|---|---|---|---|---|---|---|---|
| Gene symbol and name of the synthetic lethal partners, as well as their maximum down-regulation (max FC) in a particular cell line comparing sensitive versus resistant phenotype, the average fold change (avg FC) over all six cell lines, the number of cell lines where the feature is down-regulated in the resistant cell line (# of CL) by a fold change of at least −3.0, and the number of synthetic lethal hubs B (# of B's) associated with each feature A. Actin associated genes are given in bold. | |||||||||
| ABCC4 | −3.98 | −1.83 | 1 | 1 | OSBPL1A | −3.59 | 0.12 | 1 | 3 |
| ACSS1 | −20.20 | −3.96 | 1 | 3 | PCCA | −4.11 | −0.83 | 1 | 3 |
| ACSS2 | −4.93 | −0.48 | 1 | 3 | PEX5 | −3.59 | −1.24 | 1 | 3 |
| ADA | −4.23 | −0.86 | 1 | 3 | PEX5L | −3.13 | −0.80 | 1 | 3 |
| AGPAT3 | −4.73 | −0.49 | 1 | 1 | PLEKHG2 | −5.22 | −0.21 | 1 | 1 |
| AP1S3 | −3.56 | −0.99 | 1 | 1 | PPAN | −3.14 | −0.37 | 1 | 4 |
| AQP10 | −12.03 | −2.34 | 1 | 5 | PPEF1 | −3.97 | 1.71 | 1 | 3 |
| ARHGAP29 | −7.00 | −2.45 | 3 | 11 | PSAT1 | −11.00 | −2.23 | 2 | 1 |
| ARHGEF4 | −3.43 | −1.99 | 2 | 1 | PSPH | −4.14 | 0.21 | 1 | 1 |
| C12ORF5 | −12.40 | −1.54 | 1 | 5 | RAB25 | −26.11 | −4.33 | 1 | 1 |
| C8ORF30A | −4.65 | −2.00 | 1 | 1 | RAB35 | −3.76 | −0.78 | 1 | 1 |
| CLPB | −4.38 | −0.46 | 1 | 1 | RAB6B | −3.42 | −1.36 | 1 | 3 |
| CORO1C | −4.43 | −0.06 | 1 | 7 | RER1 | −3.25 | −0.05 | 1 | 5 |
| CORO6 | −10.71 | −1.99 | 1 | 7 | RPS4Y1 | −4.27 | 36.88 | 1 | 3 |
| CPVL | −3.72 | −0.91 | 1 | 3 | SC5DL | −3.34 | −0.85 | 1 | 5 |
| CSTF2T | −3.46 | 0.31 | 1 | 2 | SCPEP1 | −4.39 | −0.54 | 1 | 3 |
| DAPK1 | −26.50 | −4.82 | 1 | 1 | SDHB | −3.07 | 0.05 | 1 | 3 |
| DBNL | −6.56 | −0.59 | 1 | 7 | SELI | −3.59 | −1.64 | 1 | 2 |
| DCTN1 | −4.47 | −0.08 | 1 | 5 | SLC25A29 | −3.52 | −0.76 | 1 | 1 |
| DMXL1 | −5.62 | 0.45 | 1 | 1 | SLC26A8 | −3.64 | 0.08 | 1 | 2 |
| DNM1L | −3.30 | −1.47 | 1 | 5 | SLC2A10 | −5.20 | −1.28 | 1 | 1 |
| DPH2 | −3.38 | −0.57 | 1 | 2 | SNX10 | −9.47 | 1.33 | 2 | 1 |
| EPS15 | −4.09 | 0.08 | 1 | 2 | SNX12 | −4.77 | −0.97 | 1 | 1 |
| EPS15L1 | −3.11 | 0.25 | 1 | 2 | SNX13 | −3.26 | −0.13 | 1 | 1 |
| FOXB1 | −3.20 | 0.18 | 1 | 1 | SORCS1 | −3.59 | 0.32 | 1 | 2 |
| FOXJ1 | −3.91 | −0.93 | 1 | 3 | SPAG1 | −3.05 | −0.96 | 1 | 2 |
| FOXK2 | −3.78 | −0.25 | 1 | 1 | SRCAP | −3.49 | 0.42 | 1 | 4 |
| MTOR | −3.01 | 0.41 | 1 | 5 | STX7 | −26.21 | −4.15 | 1 | 2 |
| FYCO1 | −3.12 | −0.69 | 1 | 1 | TCEA1 | −3.16 | −0.30 | 1 | 3 |
| GPT2 | −4.11 | −0.01 | 1 | 6 | TCEA3 | −3.74 | −0.90 | 1 | 3 |
| GRAMD1A | −3.02 | −0.66 | 1 | 3 | TEAD2 | −43.23 | −10.57 | 2 | 5 |
| HCLS1 | −72.05 | −11.43 | 1 | 7 | TKTL1 | −21.91 | 2.60 | 1 | 5 |
| HHAT | −3.64 | −0.55 | 1 | 3 | TMLHE | −3.64 | −1.34 | 1 | 1 |
| HIST1H2AI | −3.38 | −1.90 | 1 | 3 | TPM2 | −22.79 | −3.21 | 1 | 4 |
| HK2 | −3.41 | −0.52 | 1 | 2 | TSSK4 | −3.25 | −1.14 | 1 | 5 |
| HSPH1 | −3.64 | −1.08 | 1 | 3 | TTL | −4.26 | −1.11 | 1 | 2 |
| IER3IP1 | −3.64 | −0.20 | 1 | 2 | UBB | −731.34 | −120.92 | 1 | 6 |
| LOC147804 | −3.15 | −0.17 | 1 | 4 | UBE4B | −3.11 | 0.25 | 1 | 2 |
| LY6G5B | −5.98 | −0.28 | 1 | 6 | ULK2 | −10.31 | −2.01 | 1 | 4 |
| MAPK4 | −9.20 | −0.52 | 1 | 9 | USP27X | −3.81 | −1.16 | 1 | 4 |
| MAPRE2 | −3.16 | −0.04 | 2 | 2 | VAC14 | −3.13 | −0.17 | 1 | 3 |
| MYO1C | −3.17 | −0.60 | 1 | 6 | VAMP5 | −7.55 | 0.04 | 1 | 6 |
| MYO5A | −4.66 | −1.42 | 1 | 3 | VAMP8 | −3.44 | −1.18 | 1 | 6 |
| NOTCH2 | −8.45 | −1.29 | 1 | 2 | VPS13D | −4.19 | −0.63 | 1 | 1 |
| NUAK1 | −7.03 | −2.73 | 2 | 1 | WIPI1 | −41.69 | −6.88 | 1 | 1 |
| NUAK2 | −9.46 | −2.46 | 1 | 1 | YARS | −3.09 | 0.29 | 1 | 1 |
| ONECUT1 | −5.80 | −0.94 | 1 | 2 | ZNF22 | −66.09 | −10.51 | 1 | 6 |
| Term ID | Term name | # of genes in term | # of query genes in term | Fisher p-value | Fisher p-value (corrected) |
|---|---|---|---|---|---|
| The GO terms associated with the synthetic lethal hubs. For each significant term the GO identifier (term id), name, and the total number of genes in that particular term as well as the number of hubs for the particular term are given. Additionally the raw p-value of the Fisher's exact test, as well as the values after correction for multiple testing (Benjamini and Hochberg) are given for comparing the total number of genes per term and genes affected in a specific term. | |||||
| GO:0016043 | Cellular component organization | 2229 | 7 | 0.008 | 0.039 |
| GO:0006996 | Organelle organization | 1184 | 6 | 0.002 | 0.019 |
| GO:0030036 | Actin cytoskeleton organization | 217 | 5 | <0.001 | 0.001 |
| GO:0030029 | Actin filament-based process | 232 | 5 | <0.001 | 0.001 |
| GO:0007010 | Cytoskeleton organization | 386 | 5 | <0.001 | 0.002 |
| GO:0006928 | Cell component movement | 420 | 5 | <0.001 | 0.002 |
| GO:0032268 | Regulation of cellular protein metabolic process | 458 | 4 | 0.001 | 0.017 |
| GO:0051246 | Regulation of protein metabolic process | 531 | 4 | 0.002 | 0.020 |
| GO:0006796 | Phosphate metabolic process | 848 | 4 | 0.010 | 0.039 |
| GO:0006793 | Phosphorus metabolic process | 848 | 4 | 0.010 | 0.039 |
| GO:0030833 | Regulation of actin filament polymerization | 49 | 3 | <0.001 | 0.001 |
| GO:0008064 | Regulation of actin polymerization or depolymerization | 56 | 3 | <0.001 | 0.001 |
| GO:0032271 | Regulation of protein polymerization | 57 | 3 | <0.001 | 0.001 |
| GO:0030832 | regulation of actin filament length | 58 | 3 | <0.001 | 0.001 |
| GO:0043254 | Regulation of protein complex assembly | 78 | 3 | <0.001 | 0.002 |
| GO:0032535 | Regulation of cellular component size | 79 | 3 | <0.001 | 0.002 |
| GO:0032956 | Regulation of actin cytoskeleton organization | 81 | 3 | <0.001 | 0.002 |
| GO:0032970 | Regulation of actin filament-based process | 84 | 3 | <0.001 | 0.002 |
| GO:0090066 | Regulation of anatomical structure size | 117 | 3 | <0.001 | 0.004 |
| GO:0051493 | Regulation of cytoskeleton organization | 118 | 3 | <0.001 | 0.004 |
| GO:0044087 | Regulation of cellular component biogenesis | 123 | 3 | <0.001 | 0.004 |
| GO:0033043 | Regulation of organelle organization | 200 | 3 | 0.001 | 0.016 |
| GO:0051128 | Regulation of cellular component organization | 429 | 3 | 0.008 | 0.039 |
| GO:0051656 | Establishment of organelle localization | 42 | 2 | 0.001 | 0.013 |
| GO:0000187 | Activation of MAPK activity | 77 | 2 | 0.002 | 0.020 |
| GO:0043406 | Positive regulation of MAP kinase activity | 96 | 2 | 0.004 | 0.025 |
| GO:0007265 | Ras protein signal transduction | 99 | 2 | 0.004 | 0.026 |
| GO:0048812 | Neuron projection morphogenesis | 103 | 2 | 0.004 | 0.028 |
| GO:0048858 | Cell projection morphogenesis | 110 | 2 | 0.005 | 0.030 |
| GO:0032990 | Cell part morphogenesis | 119 | 2 | 0.006 | 0.033 |
| GO:0010038 | Response to metal ion | 126 | 2 | 0.006 | 0.035 |
| GO:0043405 | Regulation of MAP kinase activity | 134 | 2 | 0.007 | 0.037 |
| GO:0010035 | Response to inorganic substance | 145 | 2 | 0.008 | 0.039 |
| GO:0048545 | Response to steroid hormone stimulus | 179 | 2 | 0.012 | 0.047 |
| GO:0032989 | Cellular component morphogenesis | 182 | 2 | 0.013 | 0.047 |
In this procedure, each GO term was analyzed for the ratio of the number of A's found in the term with respect to the total number of genes assigned to the term. A Fisher's exact test was used to calculate the significance of enrichment using Benjamini and Hochberg correction for multiple testing, further eliminating all terms with a corrected p-value above 0.05. Next, all enriched terms holding only one single hub feature were removed leading to the selection of 35 significant ontology concepts as listed in Table 6. Next to actin associated terms (which were expected due to the biased selection of B features), an enrichment of terms related to cell motion, metabolism and regulation of MAP kinase activity was found.
For further analyzing the relation between synthetic lethal hubs and synthetic lethal partners, the connection between the two GO concept lists, one for the hubs and one for their partners, was studied. The first group held terms enriched by the hub gene list for which the uncorrected p-value of Fisher's exact test was below 0.05 and which had at least 3 hub genes. The second group referred to terms enriched by the partner gene list for which the uncorrected p-value of Fisher's exact test was below 0.05 and which held at least 5 partner genes.
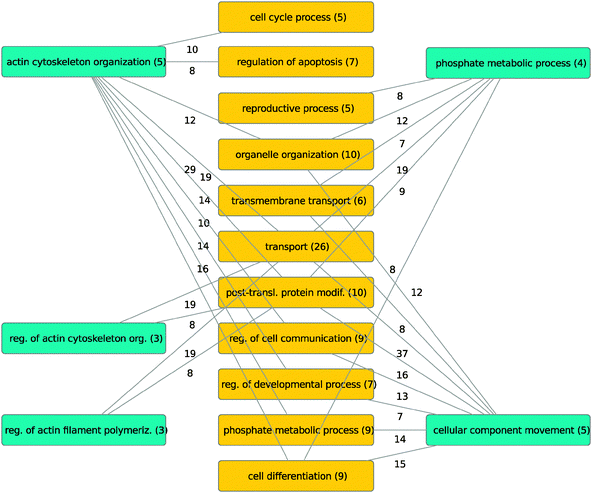
Term selection was done by considering the ontology as a directed acyclic graph and walking its structure bottom-up (in the direction of the “is a” relationship up to the root concept) beginning in each of the 27 (hub B) and 54 (partner A) significant terms. All concepts reached and edges used during this walk in the acyclic graph were selected. The resulting graph is presented in a hierarchical layout in Fig. 4.
 | ||
| Fig. 4 Section of the Gene Ontology populated by synthetic lethal hubs B (blue), synthetic lethal partners A (red), and terms populated by both (green). The main term groups are: (1) regulation of actin cytoskeleton organization, (2) regulation of actin filament polymerization, (3) positive and negative regulation of apoptosis, (4) establishment of localization and (vesicle mediated) transport, (5) apoptosis, (6) various cellular processes (cycle, development, etc.), (7) post-translational modifications/phosphorylation and (8) various metabolic processes (lipid, organic acid, ketone, alcohol, etc.). | ||
This approach allowed identification of terms being strongly affected by the synthetic lethal pairs including, among others, cytoskeleton organization and actin filament polymerization for the synthetic lethal hubs (B), apoptosis and the regulation thereof, transport and various metabolic processes for the partners (A), and post-translational modifications and phosphorylation for both (B and A features).
This ontology analysis clearly showed disjoint areas regarding hubs and partners. Synthetic lethal interactions were mostly found between different ontology terms rather than term-internal. Relevant between-term interactions and their weight (i.e. number of synthetic lethal pairs associated with the terms) are shown in Fig. 5.
 | ||
| Fig. 5 Reconstruction of dependencies between lethal hubs B (blue) and their partners A (orange) on the level of GO processes. The number of synthetic lethal links between terms associated with synthetic lethal hubs and partners are given. | ||
Particularly strong interactions were found between hub-associated terms and the terms transport, organelle organization, post-translational modifications and regulation of cell communication.
Relevance of hubs in human tumor tissue
For assessing the relevance of synthetic lethal hubs B delineated from the cell line data, a respective coverage analysis was performed using the expression data characterizing human tissue. The study by Oberthür et al.48 provided 251 gene expression profiles. Based on the given clinical data on outcome, 180 arrays were assigned as “good outcome” controls and 71 arrays as “bad outcome” cases (34 samples with tumor relapse and 37 samples with death).Equivalently to the procedure applied for cell line data, the expression values of genes being represented on the arrays by more than one probe were consolidated computing the median over all probes. This reduced the 10163 probes (with 10156 features holding a gene symbol) to 9878 genes. In contrast to the cell line data, the human data set was composed of two groups of samples based on clinical outcome instead of having a sensitive and a resistant phenotype for each individual sample. For respecting this situation the median expression value for each gene including the 180 controls (“good outcome”) was computed, and for each individual case (“bad outcome”) the fold change for each gene was computed with respect to the median value derived from the 180 control expression values. Again the rationale is that a hub feature B ideally had to be present in all cases and controls, whereas a particular partner A had to be down-regulated in one (or many, ideally all) cases. In this setting, down-regulation of a feature A was expressed as fold change of A in a particular case with respect to the median of A as determined from the controls. This setup allowed the computation of the coverage of hub features B in analogy to the cell line procedure presented above.
Fold change threshold values were adjusted for allowing comparability to the cell line selection procedures. Specifically, cutoff values were selected such that the same percentage of presence (B features) and down-regulation (A features) were available in both cell line and human tissue experiments: a fold change cutoff of −3.0 (down-regulation for A features) for the cell line data resulted in selecting 2.285% of down-regulated features on the cell line level.
For reaching the same number of features for the human tissue samples a corresponding fold change of −1.7696 was computed. A fold change constraint of at least −2.0 (presence) on the cell line data, selected as minimum fold change for B features, yielded 92.5% features, corresponding to a cutoff of −1.3667 in the patient data.
Based on these cutoff values, the coverage of the 13 hub features B identified on the cell line level was tested on the human tissue data by first identifying partners A fulfilling the fold change criterion, and then selecting B–A pairs reported as being synthetic lethal as derived from the yeast data set.
This procedure could be applied for only 6 out of the 13 hub genes, as the remaining seven features were not represented on the arrays used for analyzing the human samples. Characteristics on coverage, minimum, maximum and average fold changes, and the number of associated synthetically lethal partners for the six hubs are presented in Table 7.
| Gene symbol | Coverage (%) | min FC | max FC | avg FC | # of A's |
|---|---|---|---|---|---|
| The list of actin associated synthetic lethal hubs B also found in the human tumor tissue data set. The table lists gene symbol, coverage of human samples considered, minimum (min FC), maximum (max FC) and average fold change (avg FC) when comparing the case expression values to the median control expression value, as well as the number of synthetic lethal partners A. Genes identified as statistically significant regarding their coverage are given in bold. | |||||
| ACTA1 | 59.15 | −1.53 | 6.63 | −0.43 | 25 |
| ACTG1 | 57.75 | −2.37 | 1.9 | 0.34 | 25 |
| ACTB | 56.34 | −1.55 | 1.46 | −0.07 | 25 |
| MAP2K2 | 52.11 | −1.74 | 1.45 | 0.5 | 21 |
| ACTR1B | 38.03 | −1.74 | 1.61 | −0.12 | 15 |
| ARPC5 | 35.21 | −1.44 | 1.77 | −0.07 | 15 |
For the six synthetic lethal hubs the best coverage is reached by ACTA1 (59.15%) and the lowest by ARPC5 (35.21%). For evaluating the significance of these findings, a reference distribution of coverage was computed for all 733 genes from the yeast synthetic lethality data set which were successfully mapped from yeast to human and which were also present on the custom array used. Based on this distribution of coverage, a mean, single and double standard deviation was computed, and the coverage reached by the six hub features derived from the cell line data was analyzed in the context of these distribution descriptors. The result is shown in Fig. 6.
 | ||
| Fig. 6 Synthetic lethal hub validation in human tumor tissue data. The histogram of the case coverage of all available synthetic lethal features as derived from the yeast data set forms the distribution given by the bars, showing the number of features (number) with a specific coverage. Characteristics of the distribution are provided (mean, single (1 × SD) and double (2 × SD) standard deviation). Coverage of selected synthetic lethal hubs as derived from the cell lines and their gene symbol are provided. | ||
Four of the lethal hubs (namely ACTA1, ACTG1, ACTB and MAP2K2) were found to be highly significant with respect to coverage, i.e. outside the double standard deviation of the underlying reference distribution. The remaining two (ACTR1B and ARPC5) were significant being outside the single standard deviation.
Discussion
Models for chemoresistance in neuroblastoma
We explored two model systems for characterizing vincristine resistance in neuroblastoma. The cell line model explicitly addressed vincristine resistance by comparing six sensitive (parental) cell lines and their counterparts rendered resistant. The human tissue samples on the other hand only serve as surrogate for drug resistant neuroblastoma in the in vivo situation. Disease progression certainly rests on various reasons, with resistance to chemotherapy just being one (also highly prevalent) cause.Analysis of differentially regulated features and affected molecular processes shed some light on the relevance of the two model systems used. Direct overlap of features being differentially regulated when comparing cell line and human data with respect to resistance was found minor (Table 1), including 62 features. Of further notice in this context is the low number of features found consistently differentially regulated on the cell line level when comparing sensitive and resistant phenotype, i.e. only 43 features. However, gene expression meta-studies done for other tumor entities also reported little feature overlap,41,42 and it was postulated that on a functional level (molecular processes and pathways) the factual overlap becomes more evident.
Identified pathways significantly populated by both differentially regulated cell line and human tissue features included pathways in cancer as well as a process linked to the tissue type under analysis (axon guidance) (Table 2). Pathways prominently enriched in the in vivo situation included cell cycle, DNA replication and repair, in line with mechanisms linked to expanding tumor mass. The in vitro data on the other hand predominantly showed extracellular matrix and adhesion processes as being affected, presumably indicating the specific situation of the cell cultures.
Analyzing the 62 features identified as differentially regulated in both cell line and human tissue again provided “pathways in cancer” as significantly affected, next to “endocytosis”. The latter functional entity has been associated with vincristine since its introduction to the field,49,50 and recently has been associated with increase in lysosomal volume and leakage and sensitization of cells to lysosomal membrane permeabilization.51 Screening for vincristine resistance associated features e.g. in gastric cancer also revealed the involvement of endocytosis.52
Clear reference to actin-associated features is found for both model systems, in line with the assumption of the pivotal role of cytoskeleton and transport in vincristine resistance. For features derived from cell lines 35 genes, and for the human tissue 112 genes were represented in the actin list holding in total 724 genes. Specific features were also identified in ECM receptor interaction leading to regulation of actin cytoskeleton as well as cell proliferation (Fig. 2). Cytoskeletal involvement was broadly discussed in the context of invasive migration of neoplastic cells53–56 clearly linking the development of resistance and the clinical finding of increased aggressiveness. Interestingly, these reports pinpoint the relevance of focal adhesion, cell adhesion molecules and extracellular matrix/ECM interactions, being in line with pathways found to be enriched by features differentiating drug sensitive and resistant cell lines.
Further evidence supporting the relevance of the given feature lists with respect to drug resistance mechanisms was derived from mining literature (Table 3). Association analysis of the approx. 15000 genes assigned in PubMed resulted in a significant enrichment of drug resistance associated features for both cell line as well as human data. Interestingly, ABCB1 (p-glycoprotein), a well known transporter associated with drug resistance,57 was found differentially regulated only in the cell lines and not in patient profiles. Another gene highly ranked in the literature annotation but not differentially regulated in either the patient or the cell lines is caspase 3 (CASP3). Contrary to ABCB1, CASP3 is not a direct target for triggering drug resistance but a downstream element, as the activation of caspases plays a central role in apoptosis.
In summary, the given feature lists as well as enriched pathways populated by these grasp major elements associated with drug resistance. However, also substantial heterogeneity becomes evident, not only when comparing cell line and human tissue data, but also when analyzing the cell line data as such. Clustering the expression profiles characterizing the six chemosensitive and resistant cell lines provided a closer linkage on the level of cell type than on the level of sensitive versus resistant phenotype (Fig. 3). Apparently no set of features (or single feature) could be identified as target for tackling vincristine resistance. ABCB1 has been considered as such a target based on its diverse involvement in drug resistance,58 and L-type calcium channel blockers such as verapamil were shown to increase chemosensitivity.59,60 A recent study reported the reversal of docetaxel- and vincristine-induced multidrug resistance also independent of ABCB1 expression in human lung cancer cell lines.61
For addressing the heterogeneity of drug escape routes which appear fundamentally grounded on the heterogeneity of primary neuroblastoma, we utilized the concept of synthetic lethality. In theory, this approach promises improved specificity for targeting cancer cells, exhibiting at the same time an improved safety profile.
Synthetic lethal hubs and vincristine resistant neuroblastoma
Extended data regarding genetic interactions were published recently on S. cerevisiae, showing a dense network of interactions involving both enhancement as well as synthetic sickness/lethality. Conservation of such genetic interactions, and consequently the validity of traversing data on synthetic lethality between species is heavily discussed62 with first comparative studies ongoing involving S. cerevisiae, Schizosaccharomyces pombe, and C. elegans.63 In the presented example, about 150000 synthetic lethal interactions were derived for human genes utilizing available data from S. cerevisiae.
This interaction data set was then integrated with expression data given for the six individual cell lines. Primary selection rationale was the identification of a feature B which is present (i.e. expressed) in all sensitive as well as resistant cell lines, and interacts with one or more features A which are absent (weakly expressed or absent) in resistant cell lines. A coverage of 100% is reached by a feature B if there is at least one particular A in each individual resistant cell line. If B is non-essential, then a knock-down/knock-out of B in all cell lines would result in no (or minor) change of viability for sensitive, but in synthetic lethality for resistant cells (Fig. 1). In line with this approach a mutation (as found in the definition of the concept of synthetic lethality) is set equivalent to down-regulation of a feature as both mutation as well as down-regulation are assumed to result in decreased effective activity of a feature.
Thresholds of fold changes have to be introduced for implementing this approach for defining at what level a feature is considered as “present” and as “absent”. Instead of using fixed cutoff values and imposing the constraint of presence for all B features (as applied in this work) a dynamic procedure could be applied by searching optimal presence of B and maximum down-regulation of respective features A. Such alternative approach would also allow selection of suboptimal B features with respect to presence in all samples, but still providing better coverage by selecting alternative A features.
For our data set on vincristine resistance, 83 synthetic lethal hubs could be identified interacting with partners A in all six resistant cell lines (thus providing 100% coverage). 13 out of these 83 features are found to be actin associated (Table 4), and GSEA of these 83 hubs identified “regulation of actin cytoskeleton” as significantly enriched. This pathway bias is solely coming from the gene expression data, again indicating the important role of actin associated processes in vincristine resistance. The hubs showed an average fold change of zero when comparing sensitive and resistant phenotype, and a substantial number of synthetic lethal partners A, ranging from 12 to 37. The 13 hub features are in total associated with 94 A features, of which 87 are down-regulated (mutated) in only one cell line (Table 5), six in two, and one in three cell lines (Rho-type GTPase-activating protein, ARHGAP29). Of importance is the redundancy in interactions, where each A is in most cases linked to more than one B, for features as ARHGAP29 even 11 out of the 13 hubs interact. Of further interest is the mean fold change of features A, being in many cases around zero (as also given for B features, see Table 4), but showing substantial down-regulation for individual cell lines. Apparently, gain in resistance severely impacts specific features depending on the genotype of the parental, sensitive cell.
One mechanism causing synthetic lethal association between two features is (functional) paralogs, i.e. one feature compensates the loss of the second feature. PARP and BRCA may serve as example. However, redundancy is frequently encoded by more complex mechanisms spanning functional categories.27 Next to actin-associated terms coming from the synthetic lethal hubs (Table 6) transport, apoptosis, cell cycle and development, and metabolic processes are found for the combined set of hubs and interacting partners (Fig. 4). The five major functional terms given for the synthetic lethal hubs couple with 11 major functional terms found for partner features A. The functional interaction scheme given in Fig. 5 clearly indicates degeneracy, i.e. distributed robustness64 as major mechanism for the proposed synthetic lethal interactions and not functional compensation on the basis of redundancy.
Of the 13 synthetic lethal hub features discussed above, 6 were present on a custom array used for profiling of neuroblastoma tissue from 251 patients. Among these, 180 showed stable disease or regression, whereas 71 experienced relapse or died in a mean follow up of 40 months. Based on this group specification we performed a verification of the six valid synthetic lethal hubs as identified on the level of cell lines. Equivalent criteria as selected for the cell lines were applied for the human tissue data. All six synthetic lethal hub candidates showed in the mean a fold change around zero, and utilizing the synthetic lethal partners for the given hub proteins showed a coverage between 35% and 59% (Table 7). Specifically, the increased coverage realized by the hubs ACTA1, ACTG1, ACTB and MAP2K2 is significant with respect to a reference distribution of coverage (Fig. 6). ACTA1 (actin alpha 1), specifically expressed in skeletal muscle, is one of the six different actin isoforms also including ACTG1 (cytoplasmic actin found in non-muscle cells) and beta-actin (ACTB). MAP2K2 is a protein kinase known to play a critical role in mitogen growth factor signal transduction, also involved in stress induced apoptosis and actin reorganization.
Certainly, synthetic lethal hub candidates as derived by the screening procedure described in this work may fail in experimental verification due to various reasons: one fundamental issue is the assumption of stable genetic association across species. To what extent traversing genetic interactions from yeast to human provides valid interactions still needs to be clarified. Here, the specificity of mapping yeast sequences to the human genome has also to be considered. Next, for genes successfully mapped a bias towards essentiality may be given, and naturally synthetic lethal hubs must not be essential as a knock-down of these would also impact the viability of cells not carrying the mutated (down-regulated) partner. Based on a data set on single lethality, five of the 13 actin-associated hubs, namely ACTA1, ACTB, FMN1, MAP2K1 and MAP2K2 are indicated as essential, presumably not being valid candidates. However, cross-species evaluation of essentiality carries the same restrictions as given for mapping genetic interactions. For other hub candidates derived by the screening routine explicit disease annotation is provided (e.g. for mutation in ACTG1).65
Significant redundancy is suspected in genetic interaction networks, to a large extent based on more complex interactions than explicit implementation of redundancy.27 The procedure proposed in this work is centrally focusing on coverage, resulting in hubs exhibiting a large number of interaction partners, as this fact per se increases the likelihood of identifying a set of down-regulated partners in given expression profiles. The node degree distribution of the entire synthetic lethality network showed that genes with the highest coverage given for the validation utilizing patient tissue expression data, namely ACTA1, ACTB and ACTG1, are situated well outside the double standard deviation of the degree distribution. Here, the risk of side effects increases, as tissue specific gene expression may show absence of one (or many) of such partners, resulting in significant off-target effects. On the other hand a fraction of synthetic lethal pairs may be embedded in a higher order redundancy, i.e. the effect of a double mutant may still be buffered by a third entity or alternative mechanism.
From these considerations various aspects impacting false positive as well as false negative findings on synthetic lethal hubs become clear, alluding the relevance of extended experimental verification. Here, the development of high throughput RNA interference screening66 has become a perfect complement, allowing large scale verification of synthetic lethal hub candidates as derived by screening procedures exemplarily outlined in this work.
Experimental
Gene expression data sets
Transcriptomics data sets characterizing vincristine sensitive and resistant cell lines and data sets derived from neuroblastoma patient samples were used for analyzing vincristine resistance mechanisms and for delineating synthetic lethal hub proteins. Cell line data were retrieved for UKF-NB2 (isolated by the Interdisciplinary Laboratory for Tumour and Virus Research),16,67,68UKF-NB3 (isolated by the Interdisciplinary Laboratory for Tumour and Virus Research),16,21,69UKF-NB6 (isolated at the Interdisciplinary Laboratory for Tumor and Virus Research, Klinikum der J. W. Goethe-Universität Frankfurt), SMS-KAN (received from CP Reynolds, Children's Hospital Los Angeles),70,71 SMS-KCN (received from CP Reynolds, Children's Hospital Los Angeles),70–72 and IMR-32 (received from the American Type Culture Collection ATCC).73 For each cell line, a vincristine sensitive and a vincristine resistant phenotype was available for expression profiling. Adaption of the vincristine sensitive cell lines towards rendering them resistant was done as described in ref. 74.The expression profile for each sensitive and resistant cell line was determined in triplicate using Applied Biosystems 1700 chemoluminescence microarrays (Applied Biosystems, Foster City, USA) holding 32878 probes, with 25123 probes associated to 21012 gene symbols. Data preprocessing included removal of flagged features according to the manufacturer specifications, triplicates were averaged, and quantile–quantile normalization was performed. Identification of differentially regulated features was done using the ABarray package (Microarray QA and statistical data analysis for Applied Biosystems Genome Survey Microarray (AB1700) gene expression data) from R/bioconductor applying a FDR of 5%.
Two sets of features were derived and considered as relevant for characterizing resistance on the level of cell lines. The first set included genes being significantly differentially regulated in a group comparison of the six sensitive and six resistant cell lines, resulting in 43 genes (21 up- and 22 down-regulated). The second set included features showing a fold change of at least five in at least one particular cell line when comparing sensitive and resistant phenotype for each cell line separately. The number of features retrieved by this second procedure was 834, with 437 genes being down-regulated and 397 features being up-regulated in at least one out of the six cell lines.
Expression data on neuroblastoma retrieved from patient tumor tissue were drawn from the ArrayExpress database (www.ebi.ac.uk/microarray-as/ae)75 selecting the study E-TABM-38.48 This data set included 251 neuroblastoma patient profiles generated by using a customized array (A-MEXP-255) holding 10707 probes corresponding to 9878 genes. Next to the expression data, ArrayExpress provided clinical data on outcome for the 251 patients, allowing an assignment of 180 samples to “good outcome” defined as “no relapse, no death” in a follow up of in the mean 60 months, and 71 samples to “bad outcome” with either relapse or death in a follow up time period of in the mean 40 months. Based on this group definition, significance of differential regulation was derived using a Student's t-test with Benjamini and Hochberg correction for multiple testing, yielding in total 2001 genes (471 up-regulated and 1530 down-regulated) as differentially expressed when comparing “good outcome” and “bad outcome”.
Synthetic lethal interactions
Synthetic lethal interaction data in S. cerevisiae were derived from DryGin.31 DryGin provides data on genetic interactions for 1712 query genes tested against 3885 array genes resulting in interaction data for more than 6 million pairs. For each pair, an ε-value describing the difference between the measured and the expected double mutant population fitness is provided. A negative ε-value indicates synthetic sickness/lethality whereas a positive value indicates synthetic enhancement. DryGin also provides thresholds for statistical significance of sickness/enhancement based on the false positives/false negative rates, suggesting |ε| > 0.8 at a given significance level of p < 0.05 for relevant interactions, among which interactions with negative ε-value were in the following considered as synthetic lethal.Applying these thresholds provided 121391 pairs showing significant synthetic lethality in S. cerevisiae, involving in total 4358 unique yeast genes. For this set of unique yeast genes, a mapping to human genes was performed for deriving orthologs. This was achieved using the GeneCards (www.genecards.org) list of human-yeast orthologs76 as generated by integrating SGD (www.yeastgenome.org) and homologene (www.ncbi.nlm.nih.gov/homologene). Applying this procedure allowed a mapping of 2052 yeast genes out of the 4358 genes represented in the synthetic lethality data set to 3130 human orthologs (one-to-many cardinality of the yeast to human matching for a certain number of genes). For this set of human genes a total of 150877 synthetic lethal interactions were derived and subsequently used.
Data on gene essentiality were obtained from the Mouse Genome Database (MGD)77 by querying the phenotype text codes of the genes possessing a human ortholog for the word “lethal”. This procedure yielded a set of 2214 human genes considered as single lethal.
Features associated with actin, cytoskeleton and transport
For analyzing the involvement of proteins associated with actin, and more specifically with cytoskeleton and transport in vincristine mode of action and resistance mechanisms the totality of genes associated with these categories was derived. The GeneCards database was queried for “actin” in the “pathways”, “function” and “summaries” section of the database resulting in 724 genes holding NCBI gene symbols. Of these actin associated features, 119 were specifically associated with cytoskeleton and 57 with transport.Conclusions
Heterogeneity and adaptability impose major shortcomings in cancer therapy, and targeted approaches either hamper in coverage of cancer cell populations or see development of resistance. Additionally, cancer rendered resistant to chemotherapy frequently exhibits an even more aggressive phenotype.On these grounds the concept of synthetic lethality, and here specifically of synthetic lethal hubs, may offer an alternative approach for drug target screening. Certainly various assumptions underlie the presented concept, spanning from cross-species stability of genetic interactions to single feature essentiality. Nevertheless, from a conceptual perspective advantages in reaching coverage thereby increasing drug efficacy are apparent, and the combination of growing data sets on synthetic lethal interactions with large scale RNAi studies may provide novel opportunities in cancer drug screening.
Acknowledgements
This work was financially supported by the European Union in FP6 (project acronym ‘SYNLET’, project number 043312).Notes and references
- N. F. Schor, Pharmacol. Ther., 2009, 122, 44–55 CrossRef CAS.
- S. Ootsuka, S. Asami, T. Sasaki, Y. Yoshida, N. Nemoto, H. Shichino, M. Chin, H. Mugishima and T. Suzuki, Biol. Pharm. Bull., 2007, 30, 2294–2299 CrossRef CAS.
- J. Hirsch, JAMA, J. Am. Med. Assoc., 2006, 296, 1518–1520 Search PubMed.
- H. Joensuu, Lancet Oncol., 2008, 9, 304 CrossRef.
- A. Naing and R. Kurzrock, Clin. Colorectal Cancer, 2010, 9, E1–E4 Search PubMed.
- X. Li, M. T. Lewis, J. Huang, C. Gutierrez, C. K. Osborne, M. F. Wu, S. G. Hilsenbeck, A. Pavlick, X. Zhang, G. C. Chamness, H. Wong, J. Rosen and J. C. Chang, J. Natl. Cancer Inst., 2008, 100, 672–679 CrossRef CAS.
- W. C. Huang and M. C. Hung, J. Formosan Med. Assoc., 2009, 108, 180–194 Search PubMed.
- M. M. Gottesman, Annu. Rev. Med., 2002, 53, 615–627 CrossRef CAS.
- D. S. Tan, M. Gerlinger, B. T. Teh and C. Swanton, Eur. J. Cancer, 2010, 46, 2166–2177 CrossRef CAS.
- G. Kuruvilla, S. Perry, B. Wilson and H. El-Hakim, Arch. Otolaryngol., Head Neck Surg., 2009, 135, 101–105 CrossRef.
- M. W. Chan, C. D. Chiang, E. J. Song and V. C. Yang, Cancer Biochem. Biophys., 1998, 16, 347–363 Search PubMed.
- V. Ong, N. L. Liem, M. A. Schmid, N. M. Verrills, R. A. Papa, G. M. Marshall, K. L. Mackenzie, M. Kavallaris and R. B. Lock, J. Pharmacol. Exp. Ther., 2008, 324, 434–442 CAS.
- N. Keshelava, E. Davicioni, Z. Wan, L. Ji, R. Sposto, T. J. Triche and C. P. Reynolds, J. Natl. Cancer Inst., 2007, 99, 1107–1119 CrossRef CAS.
- R. A. Blaheta, M. Michaelis, I. Natsheh, C. Hasenberg, E. Weich, B. Relja, D. Jonas, H. W. Doerr and J. Cinatl, Jr., Br. J. Cancer, 2007, 96, 1699–1706 CrossRef CAS.
- R. Huang, D. J. Murry, D. Kolwankar, S. D. Hall and D. R. Foster, Biochem. Pharmacol., 2006, 71, 1695–1704 CrossRef CAS.
- R. A. Blaheta, F. H. Daher, M. Michaelis, C. Hasenberg, E. M. Weich, D. Jonas, R. Kotchetkov, H. W. Doerr and J. Cinatl, Jr., BMC Cancer, 2006, 6, 294 CrossRef.
- Y. Liang, S. McDonnell and M. Clynes, Curr. Cancer Drug Targets, 2002, 2, 257–277 Search PubMed.
- E. Hiyama, K. Hiyama, M. Nishiyama, C. P. Reynolds, J. W. Shay and T. Yokoyama, J. Pediatr. Surg., 2003, 38, 1730–1734 CrossRef.
- L. McArdle, M. McDermott, R. Purcell, D. Grehan, A. O'Meara, F. Breatnach, D. Catchpoole, A. C. Culhane, I. Jeffery, W. M. Gallagher and R. L. Stallings, Carcinogenesis, 2004, 25, 1599–1609 CrossRef CAS.
- A. Oberthuer, P. Warnat, Y. Kahlert, F. Westermann, R. Spitz, B. Brors, B. Hero, R. Eils, M. Schwab, F. Berthold and M. Fischer, Cancer Lett., 2007, 250, 250–267 CrossRef CAS.
- M. Michaelis, I. Fichtner, D. Behrens, W. Haider, F. Rothweiler, A. Mack, J. Cinatl, H. W. Doerr and J. Cinatl, Jr., Int. J. Oncol., 2006, 28, 439–446 CAS.
- M. Michaelis, M. C. Kleinschmidt, S. Barth, F. Rothweiler, J. Geiler, R. Breitling, B. Mayer, H. Deubzer, O. Witt, J. Kreuter, H. W. Doerr, J. Cinatl and J. Cinatl, Jr., Biochem. Pharmacol., 2010, 79, 130–136 CrossRef CAS.
- A. Garaventa, O. Bellagamba, M. S. Lo Piccolo, C. Milanaccio, E. Lanino, L. Bertolazzi, G. P. Villavecchia, M. Cabria, G. Scopinaro, F. Claudiani and B. De Bernardi, Br. J. Cancer, 1999, 81, 1378–1384 CrossRef CAS.
- D. Canaani, Br. J. Cancer, 2009, 100, 1213–1218 CrossRef CAS.
- N. Le Meur and R. Gentleman, GenomeBiology, 2008, 9, R135 CrossRef.
- P. F. Suthers, A. Zomorrodi and C. D. Maranas, Mol. Syst. Biol., 2009, 5, 301.
- A. H. Tong, G. Lesage, G. D. Bader, H. Ding, H. Xu, X. Xin, J. Young, G. F. Berriz, R. L. Brost, M. Chang, Y. Chen, X. Cheng, G. Chua, H. Friesen, D. S. Goldberg, J. Haynes, C. Humphries, G. He, S. Hussein, L. Ke, N. Krogan, Z. Li, J. N. Levinson, H. Lu, P. Menard, C. Munyana, A. B. Parsons, O. Ryan, R. Tonikian, T. Roberts, A. M. Sdicu, J. Shapiro, B. Sheikh, B. Suter, S. L. Wong, L. V. Zhang, H. Zhu, C. G. Burd, S. Munro, C. Sander, J. Rine, J. Greenblatt, M. Peter, A. Bretscher, G. Bell, F. P. Roth, G. W. Brown, B. Andrews, H. Bussey and C. Boone, Science, 2004, 303, 808–813 CrossRef CAS.
- C. Boone, H. Bussey and B. J. Andrews, Nat. Rev. Genet., 2007, 8, 437–449 CrossRef CAS.
- S. J. Dixon, B. J. Andrews and C. Boone, Commun. Integr. Biol., 2009, 2, 78–81 Search PubMed.
- S. J. Dixon, M. Costanzo, A. Baryshnikova, B. Andrews and C. Boone, Annu. Rev. Genet., 2009, 43, 601–625 CrossRef CAS.
- M. Costanzo, A. Baryshnikova, J. Bellay, Y. Kim, E. D. Spear, C. S. Sevier, H. Ding, J. L. Koh, K. Toufighi, S. Mostafavi, J. Prinz, R. P. St Onge, B. VanderSluis, T. Makhnevych, F. J. Vizeacoumar, S. Alizadeh, S. Bahr, R. L. Brost, Y. Chen, M. Cokol, R. Deshpande, Z. Li, Z. Y. Lin, W. Liang, M. Marback, J. Paw, B. J. San Luis, E. Shuteriqi, A. H. Tong, N. van Dyk, I. M. Wallace, J. A. Whitney, M. T. Weirauch, G. Zhong, H. Zhu, W. A. Houry, M. Brudno, S. Ragibizadeh, B. Papp, C. Pal, F. P. Roth, G. Giaever, C. Nislow, O. G. Troyanskaya, H. Bussey, G. D. Bader, A. C. Gingras, Q. D. Morris, P. M. Kim, C. A. Kaiser, C. L. Myers, B. J. Andrews and C. Boone, Science, 2010, 327, 425–431 CrossRef CAS.
- D. A. Chan and A. J. Giaccia, Cell Cycle, 2008, 7, 2987–2990 Search PubMed.
- N. Conde-Pueyo, A. Munteanu, R. V. Sole and C. Rodriguez-Caso, BMC Syst. Biol., 2009, 3, 116 CrossRef.
- H. C. Reinhardt, H. Jiang, M. T. Hemann and M. B. Yaffe, Cell Cycle, 2009, 8, 3112–3119 Search PubMed.
- J. D. Iglehart and D. P. Silver, N. Engl. J. Med., 2009, 361, 189–191 CrossRef CAS.
- P. C. Fong, D. S. Boss, T. A. Yap, A. Tutt, P. Wu, M. Mergui-Roelvink, P. Mortimer, H. Swaisland, A. Lau, M. J. O'Connor, A. Ashworth, J. Carmichael, S. B. Kaye, J. H. Schellens and J. S. de Bono, N. Engl. J. Med., 2009, 361, 123–134 CrossRef CAS.
- A. S. Whittemore, G. Gong and J. Itnyre, Am. J. Hum. Genet., 1997, 60, 496–504 CAS.
- J. F. Stratton, S. A. Gayther, P. Russell, J. Dearden, M. Gore, P. Blake, D. Easton and B. A. Ponder, N. Engl. J. Med., 1997, 336, 1125–1130 CrossRef CAS.
- A. Platzer, P. Perco, A. Lukas and B. Mayer, BMC Bioinformatics, 2007, 8, 224 CrossRef.
- R. Albert, J. Cell Sci., 2005, 118, 4947–4957 CrossRef CAS.
- A. Bernthaler, I. Muhlberger, R. Fechete, P. Perco, A. Lukas and B. Mayer, Mol. BioSyst., 2009, 5, 1720–1731 RSC.
- R. Rapberger, P. Perco, C. Sax, T. Pangerl, C. Siehs, D. Pils, A. Bernthaler, A. Lukas, B. Mayer and M. Krainer, BMC Syst. Biol., 2008, 2, 2 CrossRef.
- A. Subramanian, P. Tamayo, V. K. Mootha, S. Mukherjee, B. L. Ebert, M. A. Gillette, A. Paulovich, S. L. Pomeroy, T. R. Golub, E. S. Lander and J. P. Mesirov, Proc. Natl. Acad. Sci. U. S. A., 2005, 102, 15545–15550 CrossRef CAS.
- E. Crowley and R. Callaghan, FEBS J., 2010, 3, 530–539 CrossRef.
- M. D. Hall, M. D. Handley and M. M. Gottesman, Trends Pharmacol. Sci., 2009, 30, 546–556 CrossRef CAS.
- E. Bell, L. Chen, T. Liu, G. M. Marshall, J. Lunec and D. A. Tweddle, Cancer Lett., 2010, 293, 144–157 CrossRef CAS.
- M. Ashburner, C. A. Ball, J. A. Blake, D. Botstein, H. Butler, J. M. Cherry, A. P. Davis, K. Dolinski, S. S. Dwight, J. T. Eppig, M. A. Harris, D. P. Hill, L. Issel-Tarver, A. Kasarskis, S. Lewis, J. C. Matese, J. E. Richardson, M. Ringwald, G. M. Rubin and G. Sherlock, Nat. Genet., 2000, 25, 25–29 CrossRef CAS.
- A. Oberthür, F. Berthold, P. Warnat, B. Hero, Y. Kahlert, R. Spitz, K. Ernestus, R. Konig, S. Haas, R. Eils, M. Schwab, B. Brors, F. Westermann and M. Fischer, J. Clin. Oncol., 2006, 24, 5070–5078 CrossRef.
- M. Sehested, T. Skovsgaard, B. van Deurs and H. Winther-Nielsen, J. Natl. Cancer Inst., 1987, 78, 171–179 CAS.
- G. M. Galbraith and R. M. Galbraith, Clin. Exp. Immunol., 1980, 42, 285–293 CAS.
- L. Groth-Pedersen, M. S. Ostenfeld, M. Hoyer-Hansen, J. Nylandsted and M. Jaattela, Cancer Res., 2007, 67, 2217–2225 CrossRef CAS.
- X. Wang, M. Lan, Y. Q. Shi, J. Lu, Y. X. Zhong, H. P. Wu, H. H. Zai, J. Ding, K. C. Wu, B. R. Pan, J. P. Jin and D. M. Fan, World J. Gastroenterol., 2002, 8, 54–59 Search PubMed.
- D. H. Geho, R. W. Bandle, T. Clair and L. A. Liotta, Physiology (Bethesda), 2005, 20, 194–200 Search PubMed.
- J. M. Vasiliev, Int. J. Dev. Biol., 2004, 48, 425–439 CrossRef CAS.
- P. Friedl and K. Wolf, Nat. Rev. Cancer, 2003, 3, 362–374 CrossRef CAS.
- G. Bozzuto, P. Ruggieri and A. Molinari, Ann. Ist. Super. Sanita, 2010, 46, 66–80 Search PubMed.
- H. M. Coley, Methods Mol. Biol., 2010, 596, 341–358 CAS.
- K. Reed, S. L. Hembruff, J. A. Sprowl and A. M. Parissenti, Pharmacogenomics J., 2010 DOI:10.1038/tpj.2010.1.
- W. G. Simpson, Cell Calcium, 1985, 6, 449–467 CrossRef CAS.
- A. M. Rogan, T. C. Hamilton, R. C. Young, R. W. Klecker, Jr. and R. F. Ozols, Science, 1984, 224, 994–996 CrossRef CAS.
- L. Y. Chiu, J. L. Ko, Y. J. Lee, T. Y. Yang, Y. T. Tee and G. T. Sheu, Toxicol. Lett., 192, 408–418 Search PubMed.
- S. J. Dixon, Y. Fedyshyn, J. L. Koh, T. S. Prasad, C. Chahwan, G. Chua, K. Toufighi, A. Baryshnikova, J. Hayles, K. L. Hoe, D. U. Kim, H. O. Park, C. L. Myers, A. Pandey, D. Durocher, B. J. Andrews and C. Boone, Proc. Natl. Acad. Sci. U. S. A., 2008, 105, 16653–16658 CrossRef CAS.
- B. Lehner, C. Crombie, J. Tischler, A. Fortunato and A. G. Fraser, Nat. Genet., 2006, 38, 896–903 CrossRef CAS.
- J. Macia and R. V. Sole, J. R. Soc. Interface, 2009, 6, 393–400.
- E. van Wijk, E. Krieger, M. H. Kemperman, E. M. De Leenheer, P. L. Huygen, C. W. Cremers, F. P. Cremers and H. Kremer, J. Med. Genet., 2003, 40, 879–884 CrossRef CAS.
- J. Mullenders, A. W. Fabius, M. Madiredjo, R. Bernards and R. L. Beijersbergen, PLoS One, 2009, 4, e4798 CrossRef.
- R. Kotchetkov, J. Cinatl, R. Blaheta, J. U. Vogel, J. Karaskova, J. Squire, P. Hernaiz Driever, T. Klingebiel and J. Cinatl, Jr., Int. J. Cancer, 2003, 104, 36–43 CrossRef CAS.
- M. Michaelis, J. Cinatl, P. Anand, F. Rothweiler, R. Kotchetkov, A. von Deimling, H. W. Doerr, K. Shogen and J. Cinatl, Jr., Cancer Lett., 2007, 250, 107–116 CrossRef CAS.
- R. Kotchetkov, P. H. Driever, J. Cinatl, M. Michaelis, J. Karaskova, R. Blaheta, J. A. Squire, A. Von Deimling, J. Moog and J. Cinatl, Jr., Int. J. Oncol., 2005, 27, 1029–1037 CAS.
- N. Keshelava, R. C. Seeger, S. Groshen and C. P. Reynolds, Cancer Res., 1998, 58, 5396–5405 CAS.
- N. Keshelava, D. Tsao-Wei and C. P. Reynolds, Clin. Cancer Res., 2003, 9, 3492–3502 CAS.
- N. Rosen, C. P. Reynolds, C. J. Thiele, J. L. Biedler and M. A. Israel, Cancer Res., 1986, 46, 4139–4142 CAS.
- J. J. Tumilowicz, W. W. Nichols, J. J. Cholon and A. E. Greene, Cancer Res., 1970, 30, 2110–2118 CAS.
- M. Michaelis, D. Klassert, S. Barth, T. Suhan, R. Breitling, B. Mayer, N. Hinsch, H. W. Doerr, J. Cinatl and J. Cinatl, Jr., Mol. Cancer, 2009, 8, 80 CrossRef.
- H. Parkinson, U. Sarkans, M. Shojatalab, N. Abeygunawardena, S. Contrino, R. Coulson, A. Farne, G. G. Lara, E. Holloway, M. Kapushesky, P. Lilja, G. Mukherjee, A. Oezcimen, T. Rayner, P. Rocca-Serra, A. Sharma, S. Sansone and A. Brazma, Nucleic Acids Res., 2005, 33, D553–D555 CAS.
- M. Safran, V. Chalifa-Caspi, O. Shmueli, T. Olender, M. Lapidot, N. Rosen, M. Shmoish, Y. Peter, G. Glusman, E. Feldmesser, A. Adato, I. Peter, M. Khen, T. Atarot, Y. Groner and D. Lancet, Nucleic Acids Res., 2003, 31, 142–146 CrossRef CAS.
- C. J. Bult, J. T. Eppig, J. A. Kadin, J. E. Richardson and J. A. Blake, Nucleic Acids Res., 2008, 36, D724–D728 CAS.
| This journal is © The Royal Society of Chemistry 2011 |