DOI:
10.1039/C0LC00037J
(Paper)
Lab Chip, 2011,
11, 132-138
A micro surface tension pump (MISPU) in a glass microchip†
Received
19th May 2010
, Accepted 14th September 2010
First published on 19th October 2010
Abstract
A non-membrane micro surface tension pump (MISPU) was fabricated on a glass microchip by one-step glass etching. It needs no material other than glass and is driven by digital gas pressure. The MISPU can be seen working like a piston pump inside the glass microchip under a microscope. The design of the valves (MISVA) and pistons (MISTON) was based on the surface tension theory of the micro surface tension alveolus (MISTA). The digital gas pressure controls the moving gas–liquid interface to open or close the input and output MISVAs to refill or drive the MISTON for pumping a liquid. Without any moving parts, a MISPU is a kind of long-lasting micro pump for micro chips that does not lose its water pumping efficiency over a 20-day period. The volumetric pump output varied from 0 to 10 nl s−1 when the pump cycle time decreased from 5 min to 15 s. The pump head pressure was 1 kPa.
1. Introduction
A micro pump is a key device for microfluidic chips. An ideal micro pump for a microfluidic chip should be small enough to fit on the minuscule area of a microchip, strong enough to overcome resistance when the liquid flows, precise enough for pump output control, clean enough for preventing chemical contamination, simple enough for easy fabrication at low cost, and durable enough for lengthy experiments. Moreover, an ideal pump should be digitally controllable for easy automation. Finally, a pump will be more practical if it is transparent for monitoring the working state.
1.1 Background
The flow in a microchip channel requires hydrostatic pressure, which can be controlled simply by adjusting the liquid level in different reservoirs (a gravity pump) or by applying negative pressure in the outlet (a micro vacuum air pump). The pressure differential can also be achieved by droplets on the entrance and the exit of a channel1 or by a gas driven bubble pump.2 The pumping rate of these passive pumps is not easily controlled,3 and other large external pumps such as syringe pumps,4 miniature pumps,5HPLC pumps,6 peristaltic pumps,7 osmosis-based pumps,8 piezo-driven pumps,9 biomimetic pumps,10 or even cell-based pumps11 are also applied on microchips. For example, the electroosmotic flow pump12–14 is one kind of internal pump, but its high voltage is not suitable for most liquid medium systems, especially for cell culture media. An electrochemical pump15 is another kind of micro pump that uses direct electrical voltage. Diaphragm pumps are also well developed for microchips.16–19 These pumps require membrane materials such as PDMS20 (polydimethylsiloxane) as a diaphragm actuator although the polymer can disturb biological or chemical systems.21 Effervescent reaction micropumps,22water-activated pumps,23 plastic pumps24 and magnet PDMS pumps25 use multiple layers of secondary materials such as PDMS. Additionally, mercury pumps26 use mercury, and ferrofluid pumps27 use ferrofluids. Still, despite these various pumping options, an ideal internal pump built in a pure glass chip would be beneficial. The pump should be a non-toxic, active (not passive) pump—for better computerisation and integration—and should have excellent optical properties.
1.2 Valves and piston
The gas pressure or hydrostatic pressure can directly drive the micro flow but can not be precisely controlled. Only when internal micro valves and micro pumps are easily fabricated inside the microchip, can an internal and active microfluidic network or integrated system be established. The simplest conventional pump consists of two valves and one piston. The piston provides the pressure, and the input or output valve prevents backward flow and bears the backward pressure. A diaphragm pump16–19 makes use of flexible membrane materials, for both the valves and the piston. Valves based on the material's flexibility can also make use of volumetric changes due to temperature (thermoresponsive valves)28 or light.29 A pneumatic valve30 is a fast valve (on the order of hundreds of milliseconds) but still needs a polymer like PDMS. Capillary valves31 or valves based on surface energy or surface tension32,33 are useful for some special systems (e.g., a spinning compact disk or CD) but are actually passive valves. The ferrofluid pump27 uses a ferrofluid piston and valves, but needs small magnets to move the ferrofluid liquid. Complex multilayer structures, secondary polymers or other complex materials may interfere in chemical or biological systems and are not ideal for integration and automation. To simplify the valve–piston system, we considered building a one-layer pump by simple one-step etching. By this method, we directly used the gas pressure without any moving parts or membranes—just the controllable gas–liquid interface called a MISTA34 (micro surface tension alveolus).
1.3 Micro surface tension devices
Our previous works have demonstrated that in a glass chip, a stable gas–liquid interface can be formed in a micro surface tension alveolus (MISTA). This controllable gas–liquid interface can serve as a micro valve because a MISTA actually interrupts the liquid connection through the micro hole. Based on this concept, a series of micro devices for the pump can be designed. Fig. 1 shows the concept of the design of a sensor, a valve and a piston. The gas–water interfaces shown in Fig. 1 are controlled by the gas pressure. The contact angle of the interface-to-glass surface forms a sharper curvature in narrower channels and generates a stronger capillary force to resist the gas pressure. Thus, a higher gas pressure pushes the gas–water interface deeper into the contracting micro channel (see the sensor in Fig. 1a–c) and stops at the MISTA (Fig. 1c). This contracting micro channel is called a micro surface tension pressure sensor (MISEN). Similarly, if two other channels connect a MISEN with two MISTAs, it is called a micro surface tension valve (MISVA). The pressure driven gas–liquid interface deep inside a MISVA disrupts the liquid connections of other channels (Fig. 1d–f). Therefore, a MISVA is actually a pressure control valve. When the gas pressure is low, the valve is open; when the gas pressure is high, the valve is closed. Fig. 1g–i shows how a micro surface tension piston (MISTON) works. A high pressure drives the gas–liquid interface and the liquid in the channel into another channel behind the MISTA, and a low pressure allows the capillary force to refill the MISTON channel with liquid for the next pumping. MISTAs in these micro devices are elements used to stabilise the function of gas pressure control because they stop the gas–liquid interfaces in a certain range of pressure.
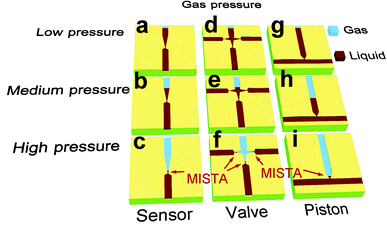 |
| | Fig. 1 The working principle of a micro surface tension sensor (MISEN), valve (MISVA) and piston (MISTON). Micro channels filled with gas (blue) or liquid (red) on each glass chip are connected by sharp narrow channels or small holes that form a micro surface tension alveolus (MISTA) to separate gas and liquid and to stop the movement of the gas–liquid interface under high gas pressure. This figure shows how gas–liquid interfaces move to function as a pressure sensor, valve and piston in the MISEN, MISVA and MISTON, respectively. | |
1.4 Micro surface tension pump
With two MISVAs and one MISTON, just like a conventional HPLC pump, a micro surface tension pump (MISPU) can be assembled (Fig. 2). In the pump loading process, the entry valve (valve 1 in Fig. 2) is open, and the exit valve (valve 2 in Fig. 2) is closed. When the piston pressure is set to be low, the surface tension or capillary force leads the liquid from valve 1 (Fig. 1a). After the piston is full of liquid, a high pressure closes valve 1 and a low pressure opens valve 2. Then a high pressure on the piston pushes the liquid in the piston to the valve 2 (Fig. 2b).
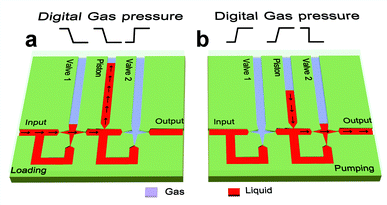 |
| | Fig. 2 The working principle of a micro surface tension pump (MISPU). A MISPU consists of two valves (MISVA) and one piston (MISTON). The black arrows along the channels indicate the loading flow when the gas pressures on valve 1 and the piston change to low (see the red zigzag line), the pumping flow when the gas pressures on valve 1 and the piston change to high and when gas pressure on valve 2 changes to low (see the red zigzag line). | |
2. Materials and methods
2.1 Microchip fabrication
One-step photolithographic and wet chemical etching techniques were used to fabricate a MISTA, MISEN, MISVA, MISTON and MISPU on a 1.6 mm thick, 60 × 60 mm2 square glass substrate (with chromium and S-1805 photoresist). The etching depth was controlled by inspection under a microscope.34 Steel clamps were used to bond the cover glass (with holes) to the base glass (see ESI†).
2.2 Microchip designs
The MISTA was a key structure of the MISEN, MISVA, MISTON and MISPU because it was an integral, connective mechanism in these devices (see ESI† for images of the MISTA). To obtain a 40 μm glass etching depth, we designed two channels separated by 75 μm (one channel's sharp end was pointing at the other channel). The photolithographic and wet chemical etching process eventually expands the design to make the two channels touch to form a MISTA for a MISEN, MISVA, MISTON or MISPU.
2.3 Optical setup
The experiments on the MISEN and MISVA were conducted under an inverted microscope. The images were captured by a CCD camera. Wide-field MISPU experiments were conducted under a metallurgical microscope (1× objective, coaxial LED white light source through the same objective) with a CCD camera. The long-term robotic experiments were monitored by a SONY video camera (see ESI†).
2.4 Digital gas pressure control
A cylinder of N2 with a pressure regulator provided the basic gas pressure (20–40 kPa). The pressure was transferred (Anthone Elec. Ltd., Xiamen, China) to digital pressures (e.g., 2 kPa and 4 kPa) for three outputs (for valve 1, the piston and valve 2). These digital pressure outputs were controlled by a computer. A program (see ESI†) set the time of each pump step of the pump cycle and sent the command sequences via a PC COM port (serial communication, Anthone Elec. Ltd., Xiamen, China) to execute the digital gas pressure driven pumping cycle.
2.5 Image processing
The images presented here (including the ESI video†) are original CCD captures, except for Fig. 5. The red colour (labelling water in the experiments by red ink) in Fig. 5 was enhanced for better differentiation of the water phase from the gas phase.
2.6 Leakage measurements
The fluidic leakage of a MISVA was measured by polystyrene beads (2.0–2.9 μm). A CCD captured 16 microscopic images every second with an exposure time of 1 ms. The velocities of the micro flow leakage in the channels were calculated by tracing the same beads in the channels and measuring the moving distance frame by frame (see ESI†).
2.7
Pump output measurements
In the long-term pump output test, the water from the MISTA on a microchip was directed into a plastic tube (0.7 mm in diameter). The filling length was measured to determine the water volume for the pump output calculation. When the tube is set upright, this length represents the height of the water column, which was also under static pressure (see ESI†).
3. Results and discussion
All key devices of a MISPU, including the MISVA and MISTON, were simply fabricated by one-step glass etching (see section 2 Materials and methods or ESI†). The etching time was controlled to achieve a narrow channel connection for MISTA formation.34 The performances of the MISEN, MISVA, MISTON and MISPU were examined through detailed tests.
3.1 Pressure effects on the MISEN and MISVA
Fig. 3a shows a microscopic image of a MISVA. It is actually a MISEN (a V-shaped channel with a channel, M, at the tip connected by a MISTA) with two MISTAs connecting two channels (L and R) on its shoulders. Channel M can be connected to channel L or R. The middle V-shaped channel was first filled with water, with a continuous liquid flow from the left channel (channel L) to the right channel (channel R). As the N2 pressure increased from 3.01 kPa to 3.20 kPa (see figures at the top of Fig. 3a), water in the V-shaped channel was pushed into channel M, the gas–water interface passed the two side channels (channel L and channel R), and the two MISTAs formed and interrupted the connection between channels L and R. At 4.00 kPa, all of the water in the V-shaped channel was pushed into channel M, and the MISTA on channel M prevented the gas in the V-shaped channel from entering channel M. Channel M allowed for the rapid exit of the liquid in the middle V-shaped channel (in the MISEN). If there was no channel M, the gas–liquid interface would not be driven far and quickly from the two side-channel (channel L and R) MISTAs, and the interruption would not have been as rapidly successful. In this way, the three MISTAs functioned as three controllable tiny gas bubbles used to block the liquid flows under pressure. When the MISVAs were closed, the three tiny bubbles were part of the large bubble in the whole MISEN (the V-shaped channel) and could be withdrawn to reopen the valve. This reopening process is shown in Fig. 3a when the N2 pressure decreases from 4.00 kPa to 2.31 kPa. When the pressure returned to 2.31 kPa, the gas–water interface returned to its original position, and the MISEN was again filled with water from channel M. More importantly, all flow-obstructing bubbles in the three MISTAs were withdrawn without delay because the tiny bubble in the MISTAs was shaped like a hemisphere and easily receded, forming the large bubble in the MISEN when the gas pressure decreases.
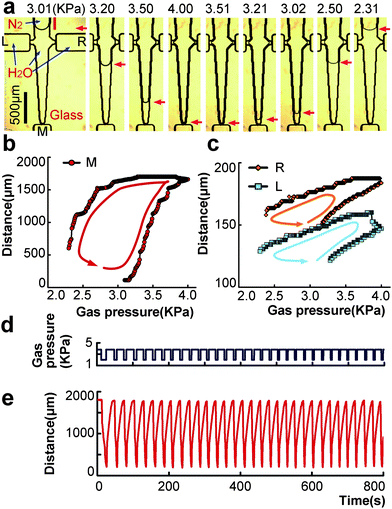 |
| | Fig. 3 A MISVA's response to gas pressure. The gas–liquid interface moves along the channel (indicated by the red arrows in a) when the gas pressure (from the top of a) over a MISVA increases and decreases. The moving distances of the gas–liquid interface from channel M and channel L or R are depicted in b and c. When the gas pressure cycles many times (d), the gas–liquid interface moves to and fro (e) to open or close the liquid connection between channels L and R. The red bar represents the measurement methods used in b, similar to the measurements displayed in c. The arrows in b and c depict the changing direction of the pump cycle. The time scales in d and e are the same. | |
The gas–liquid interface in a MISTA, MISVA or MISEN reacts not only to the gas pressure but also to the Laplace pressure affected by the surface tension. Our previous data34 showed how the surface tension affected the gas–liquid interface in a MISTA. Liquid media of different surface tension constant, including 5 mM SDS (CH3(CH2)10CH2SO3Na), DMEM (Dulbecco's modified Eagle's medium, Gibco, USA), water and a saturated sucrose solution, were applied to the test on a MISTA. Results showed that the MISTA's stable ranges were 2.5 to 6.5 kPa for SDS solution (lowest surface tension) and DMEM, 4.5 to 10 kPa for pure water and sucrose solution (highest surface tension). The MISTA's wide stable range ensures stable performance under different surface tension conditions. If the substances dissolved into water do not change the surface tension very much, the pressure effects on the MISEN and MISVA are not strong enough to affect the performance of the MISVA or MISPU which is controlled by digital pressure (see section 3.6). In extreme cases, when the surface tension is too high or too low, the adjustment on the value of the digital pressure can help the MISVA or MISPU find the new stable range for stable performance. In our experiments, the surface tension of the ink was different from that of the pure water. When the ink entered the MISPU to replace the pure water, the MISPU's performance was not affected and continued to work (see ESI†).
3.2 The working patterns of the MISEN and MISVA
A MISEN or MISVA works by moving the position of the gas–liquid interface inside the V-shaped channel. Fig. 3b and c show the relative moving distances of the interface from the hollow V-shaped channel. A single oscillatory cycle of low-high-low gas pressure leads to closed distance–pressure cycle patterns (see a, b and c). These patterns were not to-and-fro tracks, but rather rings because the friction force on the gas–liquid interface changed its direction to react to the movement of the interface.34 In the controlling process of a MISEN or a MISVA, this friction delays the reaction of the gas–liquid interface to the gas pressure. To operate the valve function of the MISVA, the working pressure was set slightly higher than the pressure scope of the cycle rings in Fig. 3a and b, normally 2.0 kPa to 4.0 kPa.
3.3 Multi cycle and long term tests of a MISVA
The cycle patterns in Fig. 3b and c are stable and repeatable. Fig. 3e shows a 32-cycle distance measurement controlled by a 32-cycle gas pressure driver (Fig. 3d). The high pressure was set to 3.8 kPa, and the low pressure was set to 2.2 kPa. In an automated long term test, the high pressure was set to 4.0 kPa and the low pressure was set to 2.0 kPa. The high pressure difference drives the MISVA faster than a low pressure difference. An ESI movie clip (see ESI†) shows an experiment of a MISVA working for 2000 cycles in 1000 s (500 ms per cycle). This 2000 cycle test did not debase the MISVA's function, and there was no sign of fatigue or a limiting factor on the MISVA's life span. Due to the surface tension design, the MISVA consisted of only a hollow space with special geometry, with no moving parts and no other materials except pure glass.
3.4 The working principle of a MISTON
Just as Fig. 3a shows, the water in the V-shaped channel was pushed into channel M by high gas pressure, and the V-shaped channel was refilled with water when the gas pressure was low. The working principle of a MISTON is just like that of the V-shaped channel (see Fig. 1g–i). Channels L and R were removed and the V-shaped channel was changed to an even width channel for even pump out control. A MISTA was preserved to prevent any bubbles from entering the liquid output channel.
3.5 The leakage of a MISVA under pressure
Each kind of pump has a pressure head, i.e., the pressure difference between the output and the input. This pressure difference should be withstood by the input valve or the output valve. The MISVA's leakage experiments were therefore designed to determine the maximum pressure that a MISVA can withstand. Fig. 4 shows the details of the tests. The leakage current could not be directly measured with a microscope. We labelled the current with polystyrene beads (2.0–2.9 μm) in water (see ESI†). The measured velocities of the moving beads represented the velocities of the leakage current from the valve. Leakage occurs when the gas–liquid interface is too close to the two channels to connect (see the inserts in Fig. 4b and d). The tests were started when the valve was closed by a 3.9 kPa gas pressure. As the pressure PR (from channel R, see Fig. 4a) rose from 0 to 0.6 kPa, the gas–liquid interface did not show any obvious movement (see Fig. 4b) due to the MISTA effect (the curvature of the interface in the MISTA changed under pressure, but the interface remained in the MISTA). At this stage, there was not any leakage. When the pressure rose from 0.6 kPa to 1.7 kPa, the interface moved out of the MISTA and into the V-shaped channel (to about 100 μm) but did not touch the opposite channel. When the pressure PR reached 1.75 kPa, the interface eventually connected the other two channels, leading to the valve's leakage. As shown in Fig. 4a, the non-leakage pressure PR can be as high as 2.02 kPa because the surface tension of pure water is higher than that of the bead solution (1.75 kPa, as discussed before). The pressures PL (from channel L) and PM (from channel M, which connected to channel L) gave similar results (Fig. 4c and d). The non-leakage pressures PL and PM were about 1.3 kPa because the interface moving from channel M was closer to channel R than the interface from channel L. At 1.4 kPa, the arc interface was nearly in contact with channel R by a thin liquid membrane, and leakage from channel M to channel R occurred. The pressure continued to increase, and the interface eventually connected channel L and channel R. Liquid from channel L flushed directly into channel R. This channel L to channel R flow released the pressure on channel M, and the leakage from channel M decreased until the pressure rose up to 1.65 kPa. Channel M's connection to channel L caused an asymmetry of the MISVA. Channel R could withstand higher pressure than channel L in connecting to channel M. In conclusion, both sides of a MISVA could withstand 1.3 kPa.
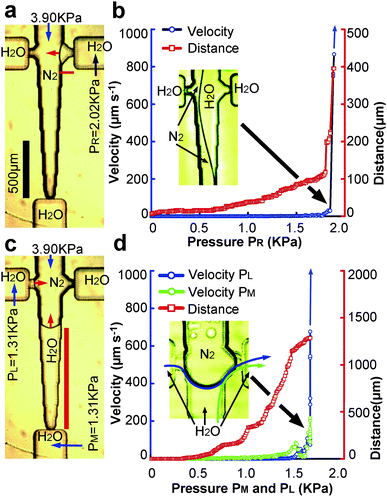 |
| | Fig. 4 The leakage tests of a MISVA. Under counter pressure (PR in a) from the output channel or high loading pressure from the input channel (PL and PM in c), the gas–liquid interface recedes (red arrows in a and c). If the receding distances are too high, leakage occurs (b and d). The leakage flows of the MISVA were measured by suspending polystyrene beads (2.0–2.9 μm) in the channels (flow velocity of b in channel R and flow velocity of d in channels M and L). The red bars (in a and c) show the distance measurement methods. The blue arrows (in b and d) show velocities too high to be measured. The insert in b shows the gas–liquid interface from channel R about to touch channel L. The insert in d shows the leakage flow (from channel L and channel M, indicated by blue and green arrows, respectively). | |
3.6
MISPU controlled by digital pressure
The gas pressure driving the MISVA or MISTON was digitalised, 1 for 4 kPa and 0 for 2 kPa. This digitalisation is necessary for high density integration of micro devices and easy computer control. A MISPU consists of two MISVAs and one MISTON (see Fig. 5 for valve 1, the piston and valve 2). The MISVA was not symmetric, and the stronger side (the side without channel M, see the previous section) of both valves pointed to the output for the maximal pump pressure head. Fig. 5 shows three sequences of digital gas pressure for valve 1, the piston and valve 2, respectively. These sequences commanded the valves and piston to open, to close and to load or to pump, resulting in a pump cycle. The pump started when valve 1 was open and liquid from the input channel filled valve 1 immediately (see the image at 2.2 s). At 5 s, the piston was set to 0, and the liquid moved through valve 1 and filled the piston channel (see the image at 9.2 s). After a 10 s loading period, valve 1 was closed, and the piston held its cargo (red liquid in the piston channel) until valve 2 was opened at 20 s (see the image at 24.7 s). The piston pressure was then set to 1 to push the cargo into the output channel through valve 2 at 25 s. As we placed a zigzag micro channel to test the pump head (see ESI†), the reaction resistance force from the output channel obstructed all liquid escaping into the output channel, and most of the pumped liquid flushed into the channel of valve 2 (see image at 27.6 s). At 30 s, the last and slowest step, i.e., the real pumping power step, started with the pressure on valve 2 was set to 1, and all liquid previously filling the piston was pumped into the output channel (see ESI† for experimental details).
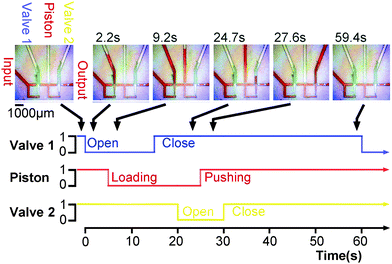 |
| | Fig. 5 Digital gas pressure controls on a MISPU. The gas pressures on the two MISVAs and the MISTON are digitalised, 1 for 4 kPa and 0 for 2 kPa. Three sequences of digital commands in one minute drive a one-minute pumping cycle. The key images of the MISPU are shown with passing time. The red colour in the images is red ink in the micro channels. A reversed sequence would reverse the MISPU. | |
3.7 The pump head pressure and the volumetric pump output
To investigate how the head pressure was affected by each step of the pumping process, we used a segment of air in the output channel to trace the pumping processes and to measure the pump output (see ESI†). A 10000 μm long air bubble in the 200 μm wide channel blocked any micro flow from the MISPU. The pump power had to push the long bubble ahead by its pump pressure head. The movement of the air–water interface of the bubble was measured to determine the pressure pulses from the pump (Fig. 6a). The operations of valve 2 and the piston generated slight pressure pulses (see Fig. 6a). During the last step of closing valve 2, a continuous pump pressure head pushed the bubble forward. The friction of the channel wall on the bubble increased the variability in the measurements of the pump output, but the average pump outputs of each single pump cycle remained unchanged (see Fig. 6a).
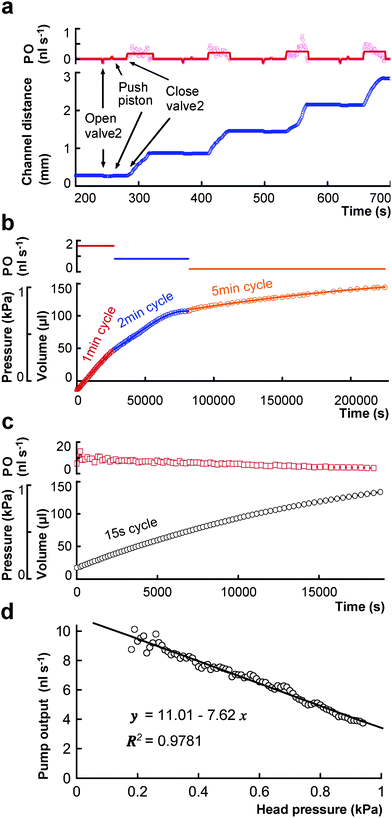 |
| | Fig. 6 The pump head pressure and the volumetric pump output. With a segment of air in the output channel, the pump outflow is measured under a microscope (see ESI†). The moving distance of the bubble in the channel is calculated to the pump output (four pump cycles in a). For longer duration tests, the pump output is directed into an upright plastic tube (0.7 mm) to measure the volumetric pump output and the pump head pressure, simultaneously (b and c). The cycle time is set to 1 min, 2 min, 5 min (b) or 15 s (c). The relationship between the volumetric pump output and the pump head pressure is shown in d. The equations in d are the linear regression results. PO: pump output. | |
We noted that there were durations of time in which nothing occurred, which could be eliminated to minimise the overall cycle time (for example, the wasted time between the two steps mentioned above). So, the volumetric pump output could be increased by saving this spare time. When the different cycle time was set to save this spare time (see Fig. 6b), the MISPU's average pump output was controlled. The channel was not blocked by bubbles, and the pump output rose to about 1.8 nl s−1. As the cycle time increased, the pump output decreased. However, if the pump faces too high of a resistance, a longer cycle time helps to finish the pumping process. If there is no such high resistance, a short pump cycle provides high pump output. Fig. 6c shows the results of a 15 s cycle pumping. The volumetric pump output was 10 nl s−1 at the start. When the counter pressure gradually increased to 1 kPa, the pump output gradually decreased to 4 nl s−1. Fig. 6d shows the linear relationship between the head pressure and the pump output. This linear relationship with a negative slope indicates that the counter pressure or resistant pressure linearly decreases the piston's working efficiency by slowing the moving speed of the gas–liquid interface. To design an efficient micro fluidic network, Fig. 6d provide a valuable equation to estimate the micro flow driven by one or more MISPUs in a resistance predictable micro fluidic network on a glass micro chip.
3.8 A long-term (20 day) test of a MISPU
All experiments regarding the MISPU were done on only one microchip. The sum of the total working time of the MISPU on a glass chip over 20 days is shown in Fig. 5 and Fig. 6. Another pure water pumping test (from a cup to 5 cm higher and back to the cup) proved a 7 day non-stop working capability (see ESI†).
4. Conclusions
The MISPU technique makes use of only the surface tension. The volumetric pump output increased from 0 to 10 nl s−1 as the pump cycle time decreased from 5 min to 15 s. The pump head pressure was 1 kPa. The linear relationship between the head pressure and the volumetric pump output is helpful for quantitatively predicting the micro fluidic flow. This long-lasting one-layer reversible micro pump works like a conventional piston pump but is only several millimetres in size. Based on this technique, a smaller MISPU can be manufactured. When the size of the MISVA, MITON or MISTA is smaller, the surface tension effect is amplified, and the MISPU can produce a high pressure head. Moreover, the MISPU requires no special materials or high-tech equipment. The important technique of stopping a flow in a channel with a MISTA can be applied not only on transparent glass but also on other organic or inorganic materials to make valves. With these valves, we may even be able to use negative pressure instead of surface tension to draw liquid. Finally, using digital pressure control, a one-step glass etching process integrated a number of various kinds of surface tension devices (MISVA, MISEN, MISTON, MISTA, and MISPU) on a glass micro chip. This long-lasting, inexpensive, transparent glass microchip is ready to be routinely applied to chemical or biological research.
Acknowledgements
This work was supported by the National Natural Science Foundation of China (40776082) and Anthone Elec. Ltd. (Xiamen, China). We thank LQ Wu for glass etching, data extraction and LH Peng for data extraction.
Notes and references
- G. M. Walker and D. J. Beebe, Lab Chip, 2002, 2, 131–134 RSC.
- N. R. Tas, J. W. Berenschot, T. S. J. Lammerink, M. Elwenspoek and A. van den Berg, Anal. Chem., 2002, 74, 2224–2227 CrossRef CAS.
- I. J. Chen, E. C. Eckstein and E. Lindner, Lab Chip, 2009, 9, 107–114 RSC.
- M. C. Peoples and H. T. Karnes, Anal. Chem., 2008, 80, 3853–3858 CrossRef CAS.
- J. Fiering, M. J. Mescher, E. E. L. Swan, M. E. Holmboe, B. A. Murphy, Z. Chen, M. Peppi, W. F. Sewell, M. J. McKenna, S. G. Kujawa and J. T. Borenstein, Biomed. Microdevices, 2009, 11, 571–578 CrossRef CAS.
- P. Kuban and P. C. Hauser, J. Chromatogr., A, 2007, 1176, 185–191 CrossRef CAS.
- C. Koch, V. Remcho and J. Ingle, Sens. Actuators, B, 2009, 135, 664–670 CrossRef.
- Z. R. Xu, C. G. Yang, C. H. Liu, Z. Zhou, J. Fang and J. H. Wang, Talanta, 2010, 80, 1088–1093 CrossRef CAS.
- S. M. Ford, B. Kar, S. McWhorter, J. Davies, S. A. Soper, M. Klopf, G. Calderon and V. Saile, J. Microcolumn Sep., 1998, 10, 413–422 CrossRef CAS.
- S. Ramirez-Garcia, M. Baeza, M. O'Toole, Y. Z. Wu, J. Lalor, G. G. Wallace and D. Diamond, Talanta, 2008, 77, 463–467 CrossRef CAS.
- Y. Tanaka, K. Sato, T. Shimizu, M. Yamato, T. Okano and T. Kitamori, Lab Chip, 2007, 7, 207–212 RSC.
- Q. Lu and G. E. Collins, Lab Chip, 2009, 9, 954–960 RSC.
- C. T. Culbertson, R. S. Ramsey and J. M. Ramsey, Anal. Chem., 2000, 72, 2285–2291 CrossRef.
- B. J. Kirby and E. F. Hasselbrink, Electrophoresis, 2004, 25, 187–202 CrossRef CAS.
- B. S. Gallardo, V. K. Gupta, F. D. Eagerton, L. I. Jong, V. S. Craig, R. R. Shah and N. L. Abbott, Science, 1999, 283, 57–60 CrossRef CAS.
- W. H. Zhang, S. C. Lin, C. M. Wang, J. Hu, C. Li, Z. X. Zhuang, Y. L. Zhou, R. A. Mathies and C. Y. J. Yang, Lab Chip, 2009, 9, 3088–3094 RSC.
- C. Guillo, J. M. Karlinsey and J. P. Landers, Lab Chip, 2007, 7, 112–118 RSC.
- J. M. Karlinsey, J. Monahan, D. J. Marchiarullo, J. P. Ferrance and J. P. Landers, Anal. Chem., 2005, 77, 3637–3643 CrossRef CAS.
- W. H. Grover, A. M. Skelley, C. N. Liu, E. T. Lagally and R. A. Mathies, Sens. Actuators, B, 2003, 89, 315–323 CrossRef.
- T. Vestad, D. W. M. Marr and J. Oakey, J. Micromech. Microeng., 2004, 14, 1503–1506 CrossRef.
- L. J. Millet, M. E. Stewart, J. V. Sweedler, R. G. Nuzzo and M. U. Gillette, Lab Chip, 2007, 7, 987–994 RSC.
- B. T. Good, C. N. Bowman and R. H. Davis, Lab Chip, 2006, 6, 659–666 RSC.
- B. T. Good, C. N. Bowman and R. H. Davis, J. Colloid Interface Sci., 2007, 305, 239–249 CrossRef CAS.
- S. Bohm, W. Olthuis and P. Bergveld, Sens. Actuators, A, 1999, 77, 223–228 CrossRef.
- M. Khoo and C. Liu, Sens. Actuators, A, 2001, 89, 259–266 CrossRef.
- J. Ni, C. J. Zhong, S. J. Coldiron and M. D. Porter, Anal. Chem., 2001, 73, 103–110 CrossRef CAS.
- H. Hartshorne, C. J. Backhouse and W. E. Lee, Sens. Actuators, B, 2004, 99, 592–600 CrossRef.
- Y. Zhang, S. Kato and T. Anazawa, Sens. Actuators, B, 2008, 129, 481–486 CrossRef.
- G. F. Chen, F. Svec and D. R. Knapp, Lab Chip, 2008, 8, 1198–1204 RSC.
- M. W. Li, B. H. Huynh, M. K. Hulvey, S. M. Lunte and R. S. Martin, Anal. Chem., 2006, 78, 1042–1051 CrossRef CAS.
- J. Siegrist, R. Gorkin, M. Bastien, G. Stewart, R. Peytavi, H. Kido, M. Bergeron and M. Madou, Lab Chip, 2010, 10, 363–371 RSC.
- H. Nagai, T. Irie, J. Takahashi and S. Wakida, Biosens. Bioelectron., 2007, 22, 1968–1973 CrossRef CAS.
- D. S. Reichmuth, T. J. Shepodd and B. J. Kirby, Anal. Chem., 2005, 77, 2997–3000 CrossRef CAS.
- X. Y. Peng, L. Q. Wu, N. Zhang, L. D. Hu, Y. Li, W. J. Li, D. H. Li, P. Huang and Y. L. Zhou, Lab Chip, 2009, 9, 3251–3254 RSC.
Footnote |
| † Electronic supplementary information (ESI) available: Detailed experimental and results in text with figures and eight movies. See DOI: 10.1039/c0lc00037j |
|
| This journal is © The Royal Society of Chemistry 2011 |
Click here to see how this site uses Cookies. View our privacy policy here. 


