Quantitative determination of intact free cisplatin in cell models by LC-ICP-MS†‡
T.
Falta
a,
P.
Heffeter
b,
A.
Mohamed
b,
W.
Berger
b,
S.
Hann
a and
G.
Koellensperger
*a
aDivision of Analytical Chemistry, Department of Chemistry, University of Natural Resources and Life Sciences, Muthgasse 18, A-1190, Vienna, Austria. E-mail: gunda.koellensperger@boku.ac.at; Fax: +43-1-47654-6059; Tel: +43-1-47654-6087
bInstitute of Cancer Research, Department of Medicine I, Medical University Vienna, Borschkegasse 8a, 1090, Vienna, Austria
First published on 14th October 2010
Abstract
For the first time cellular uptake studies of cisplatin were addressed by elemental speciation analysis at biological relevant concentration levels, i.e. drug exposure concentration ranging at 5 µM. The quantification of intact, free cisplatin in cell models was investigated by two complementary LC-ICP-MS methods, using chromatographic separations based on pentafluorophenylpropyl siloxane bonded stationary phases (Discovery HS F5) and on porous graphitized carbon (Hypercarb). Limits of detection for cisplatin were 0.013 and 0.11 µg L−1 (given as total drug), respectively. Cisplatin—once entering the cancer cell—is known to undergo reactions with proteins and peptides in the cytosol by forming adducts. Hence, due to the limited selectivity of one-dimensional LC separation, efficient protein removal was a prerequisite for accurate quantification in such complex biological matrix as cell lysate. Centrifugal filtration (cut-off of 10 kDa) was the method of choice. Exposure of two different cell models to 5 µM cisplatin for 24 hours resulted in cisplatin concentration levels ranging between 0.2 and 1.5 µg g−1 protein. Despite the poor recovery of the columns regarding total Pt in filtrated samples, the accuracy of cisplatin quantification was given, which was shown via species specific IDMS and standard addition. Using the HS F5 column, the selection of the cut-off filter was crucial, otherwise cytosolic samples upon 24 hours of drug exposure contained Pt species which could not be separated from cisplatin.
Introduction
Speciation analysis shows promising potential for preclinical and clinical studies of metallodrugs.1,2 Up to date, the knowledge on the intracellular inorganic chemistry of metal(loid)-containing drugs in general (even for clinically used drugs) is still fragmentary.3 In recent years, the mechanisms of metallodrug-induced cell death were extensively studied using biological/biochemical methods, i.e. addressing the involvement in biochemical processes and signaling pathways in preclinical (cell models) and clinical samples.4 As a drawback, these biochemical methods do not allow to characterize drug biotransformation products at molecular level. Thus, complementary to that the mechanism of action was/is studied by addressing reactivity towards relevant nucleophiles in vitro by spectroscopy.5,6 Hence, most cellular targets were postulated using high concentration in aqueous solutions mimicking biological matrices, since spectroscopic methods lack in sensitivity and selectivity in order to analyze metal species in complex biological matrices. Therefore, even simple parameters, such as the half-life of the clinically established well-studied cisplatin, are still under debate.6Only in 2009, Gibson et al.3,6 mentioned the lack of a suitable methodology for studying the metallodrugs in cell models at biological relevant concentration levels (e.g. the IC50 value for cisplatin ranges at low µM in most cell models, only a minor fraction is taken up, hence expected Pt concentration levels in cell lysates are in the low ng g−1 range).
Speciation analysis offers required sensitivity, however, so far surprisingly few groups aimed at the investigation of intracellular metabolism of metallodrugs in this context.7 In the past, preclinical studies implementing ICP-MS based analytical methods, focused primarily on cellular drug uptake and intracellular distribution.2,8,9 Reliable sample preparation protocols were implemented for drug quantification in cell models. In clinical samples, the distribution of drug among blood compartments was assessed. Moreover, drug–protein association was studied on a quantitative basis (1) in cell models by size exclusion chromatography (SEC)-ICP-MS9 and (2) in vivo using two-dimensional chromatographic separation in combination with ICP-MS.10–12
A major obstacle for metabolism studies by elemental speciation analysis is to find a suitable separation method as intact metallodrugs are small polar uncharged species and their metabolites often are charged hydrophilic species. In the past, the quantification of free metallodrugs and their hydrolysis/biotransformation products was pursued in biological samples employing LC separations on graphitized carbon phases13 and on pentafluorophenyl phases.14 Carboplatin and oxaliplatin could be separated using reversed phase chromatography.15,16 Recently, hydrophilic interaction chromatography (HILIC)-ICP-MS method was introduced for quantification of cisplatin and its monohydrolyzed metabolite in cell models.17 HILIC-ICP-MS was also employed for the quantification of the clinical established drugs in human plasma samples.18 As a drawback the sensitivity of HILIC-ICP-MS methods was limited due to the fact that ICP-MS performance is impaired by the use of high amounts of organic eluents. The limits of detection (LOD) of both reported methods were in the µg L−1 range.
In this work, we performed cellular uptake studies in cancer cell models exposed to 5 and 50 µM cisplatin. The methodology was validated for quantification of free intact cisplatin using different separation methods for LC-ICP-MS in combination with a clean up step by centrifugal filtration. Mass balances over the whole analytical process were obtained. Species specific isotope dilution by LC-ICP-MS was employed for the first time in a cellular drug uptake study. Moreover, for the first time quantification of free and intact cisplatin was validated using preclinical relevant concentration levels. In the past mass spectrometric approaches implementing shotgun proteomics19 or elemental speciation analysis involved cell experiments using mM drug concentrations (200 µM in the case of LC-ICP-MS17). At these concentration levels the cytotoxicity of the metallodrug is very high, that either not sensitive cell models had to be used (e.g. yeast19) for a cellular uptake study or very short incubation times were implemented. Both experimental settings compromise the preclinical study aiming at a close representation of a mode of action of the drug in the living cell.
Experimental
Reagents and standards
A reagent I grade water (>10 MΩ cm−1 resistance according to ISO 3696 water specifications) purification system (Ultra Clear basic Reinstwassersystem, SG Wasseraufbereitung und Regenerierstation GmbH, Barsbüttel, Germany) was used to obtain purified water, which was further purified in a quartz sub-boiling system (Milestone-MLS GmbH, Leutkirch, Germany). Formic acid (98–100%), sodium hydroxide and sodium chloride (99.99%) were purchased from Merck KGaA, Darmstadt, Germany in Suprapur® quality. Ammonium hydroxide (28%, NH3 in water, purified by double-distillation) and cisplatin were obtained from Sigma Aldrich, St Louis, MO, USA. Methanol (Fisher Scientific, Loughborough, Leicestershire, UK) was of LC-MS grade. The eluent for size exclusion chromatography was prepared from sodium hydroxide (pure pellets, Acros organics, Geel, Belgium), hydrochloric acid (p.a. Merck, Darmstadt, Germany) and tris(hydroxymethyl)aminomethane (p.a. Merck). Isotopically enriched cisplatin was synthesized from 194PtI2(NH3)216 according to a procedure given by Dullin et al.20 For this purpose, isotopically enriched metallic Pt (194Pt 87.34%, 195Pt 10.6%, and 196Pt 1.5%) was purchased from Chemotrade (Duesseldorf, Germany).Cell culture
The cervical carcinoma-derived human cell line KB-3-1 was generously donated by D. W. Shen (Bethesda, MD).21 The mesothelioma cell model P31 has been generously donated by K. Grankvist (Umeå University, Sweden).22 KB-3-1 cells were grown in RMPI 1640 medium, while for the P31 cell model Eagle's minimal essential medium was used. All media were supplemented with 10% fetal calf serum without antibiotics. Cultures were regularly checked for Mycoplasma contamination.Preparation of cytosolic fractions
Cells (1 × 10⁶) were seeded in a T150 cm2 culture flask and allowed to attach for 24 h. Drugs were added in 20 mL of fresh growth medium. After 24 h drug incubation, cells were collected by scratching, and washed twice with ice-cold PBS. For lysis, cell pellets were resuspended in lysis buffer (4 °C) containing 15 mM NaCl and 0.5% Triton X-100. Additionally, 1 mM phenylmethylsulfonyl fluoride (PMSF) and 25 µL mL−1 “Complete” protease inhibitor mix (Roche, Mannheim, Germany) were added to the buffer immediately before use. Proper cell lysis was checked microscopically by trypan blue staining. After 5 min centrifugation (14![[thin space (1/6-em)]](https://www.rsc.org/images/entities/char_2009.gif) 000 rpm) at 4 °C supernatant (cytosolic fraction) was separated from pellet (nucleic fraction). Then the fractions were stored at −80 °C until measurement. Protein concentrations of the cytosolic fractions were determined using the Micro BCA Protein Assay Reagent Kit (Pierce Biotechnology, Rockford USA).
000 rpm) at 4 °C supernatant (cytosolic fraction) was separated from pellet (nucleic fraction). Then the fractions were stored at −80 °C until measurement. Protein concentrations of the cytosolic fractions were determined using the Micro BCA Protein Assay Reagent Kit (Pierce Biotechnology, Rockford USA).
After thawing the cytosol samples were immediately filtrated by using centrifugal filter devices equipped with a 10 kDa nominal molecular weight limit (NMWL) membrane. Three different centrifugal filter devices were tested: (1) Ultrafree-0.5 centrifugal filter & tube, 0.5 mL, 10 K NMWL Biomax® high-flux polyethersulfone membrane (Millipore Co, Billerica, MA, USA)—in the further text denoted as “Biomax-Filter”, (2) Amicon Ultra, 0.5 mL, 10 K Ultracel® 10 K molecular weight cut-off (MWCO) regenerated cellulose membrane (Millipore Co, Carrigtwohill, Co. Cork, Ireland)—in the further text denoted as “Amicon-Filter”, and (3) Vivaspin 500, 500 µL, 10 K MWCO high-flux polyethersulfone membrane (Sartorius Stedim Biotech GmbH, Goettingen, Germany)—in the further text denoted as “Vivaspin-Filter”. Centrifugation was performed in a Mini Spin plus centrifuge (Eppendorf AG, Hamburg, Germany), which was located in a cooling chamber (4 °C), for 45 min at 12.000 g for the Ultrafree-0.5 centrifugal filter devices and at 14.000 g for all other devices. The filtrate was transferred into HPLC-vials, which were placed into the cooled (5 °C) autosampler of the HPLC.
Speciation analysis using HPLC-ICP-QMS
For speciation analysis a metal-free chromatographic system consisting of an AS 50 autosampler (including a custom-made temperature-control device), an ICS-3000DP dual pump system and the Chromeleon Chromatography Management System (version 6.40)—all from Dionex (Sunnyvale, CA, USA)—was employed. Chromatographic separation was performed on a pentafluorophenylpropyl-terminated stationary phase (Discovery HS F5, 150 × 2.1 mm, Supelco, Bellefonte, PA, USA) as well as on a Thermo Hypersil–Keystone Hypercarb column (150 × 2.1 mm, Thermo Fisher Scientific Inc., Waltham, MA, USA) under the conditions listed somewhere else in detail.13,23 For both columns an injection volume of 5 µL and a column temperature of 45 °C were used. Coupling HPLC to ICP-QMS (Elan 6100 DRC II, Perkin Elmer SCIEX, Ontario, Canada) was performed by connecting the HPLC-effluent via a PFA-ST-nebulizer (Elemental Scientific Inc., Omaha, NE, USA) situated in a cyclonic spray chamber (PE-SCIEX). ICP-QMS measurements of the 195Pt signal were performed by using a plasma gas flow of 16.0 L min−1 and applying a daily tuning procedure for optimization of nebulizer gas flow, auxiliary gas flow and ICP RF-power. For IDMS 194Pt and 196Pt were additionally measured. Quantification of cisplatin via external calibration was carried out by injection of respective standards in 15 mM sodium chloride solution.A BioSuite 125 4 µm UHR SEC column (300 × 4.6 mm, flow-rate 0.35 mL min−1, injection volume 25 µL) from Waters (Milford, Massachusetts, USA) was used as stationary phase for size exclusion chromatography. The SEC eluent consisted of 75 mM NaCl and 10 mM Tris–HCl, pH 7.4. Generation and export of chromatograms were performed using ChromLink (version 2.1, Perkin Elmer SCIEX) in combination with TotalChrom (version 6.2, Perkin Elmer SCIEX). Chromeleon software (version 6.80, Dionex, Sunnyvale, CA, USA) was used for integration and evaluation of all chromatographic data.
Results and discussion
Cisplatin can enter the cell by passive diffusion across the lipid bilayer and by carrier-mediated import proteins like the copper transporter 1 (CTR1). The involvement of CTR1 in the active transport of all three platinum drugs in clinical use has been extensively investigated by several groups. Generally, it is accepted that CTR1 is of importance for the initial influx of platinum drugs when they are present at low, clinically relevant, concentrations. In which form cisplatin is bound to CTR-1, is still under discussion.24 From solution chemistry it is known that cisplatin itself is a relatively unreactive molecule.25 Only after hydrolysis reactivity drastically increases. A recent NMR study reported an intracellular half-life of cisplatin of 75 min spiking the drug on whole cell extracts.3 In this work cisplatin was quantified in proliferating living cells, which at the time of 24 hours of drug exposure continued to uptake the drug (passive diffusion should be predominant).As a matter of fact, incubation of cancer cells with preclinical relevant cisplatin concentrations results in low analyte concentrations in the cytosol samples. For analysis of the free, intact drug chromatographic separation has therefore to be combined with a sensitive and robust detection technique like ICP-MS, which provides limits of detection (LODs) for cisplatin in the sub µg L−1 level. Despite the availability of appropriate standards, accurate identification and quantification of cisplatin in cytosol samples have to be carefully considered, because of the complexity of the sample matrix as cytosol contains—in addition to the intact drug—proteins and the protein bound drug fraction. In this study, we investigated the cellular uptake into the cytosol (without nucleus, which had been separated) of two different cancer cell lines incubated with 5 or 50 µM cisplatin for 24 hours. First, the drug uptake obtained under these experimental conditions was determined as total Pt concentration related to the absolute protein amount of the cytosolic cell fraction by FI-ICP-MS. It ranged between 25 and 360 µg g−1 protein (corresponding to 0.2–0.8% of the Pt present in the incubation medium). The protein concentration in the studied cell lysates amounted on average to 3 g L−1, hence the absolute protein content of the obtained cytosolic preparation was on average 3 mg.
As a matter of fact a high fraction of cell associated cisplatin is protein bound after 24 hours of drug exposure. In Fig. 1 a size exclusion chromatogram of a cytosol sample of the cell line P31 incubated for 24 h with an initial cisplatin concentration of 5 µM is depicted. As can be readily observed only a minor fraction can be assigned to low molar mass Pt species. Generally, the drug uptake and the protein binding rate depended on the studied cell-system, the drug concentration used for incubation and the incubation time.
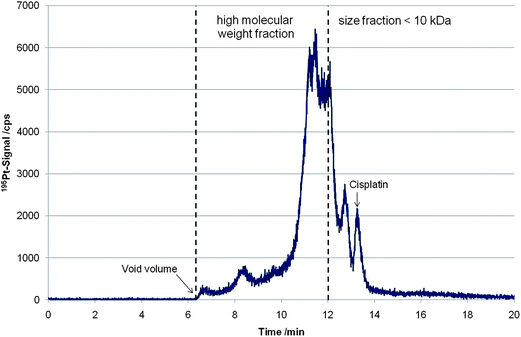 | ||
| Fig. 1 Size-exclusion chromatogram (195Pt-signal) of a cytosol sample of cell line P31 incubated for 24 h with an initial cisplatin concentration of 5 µM. The molar mass reference ladder was published elsewhere.10 | ||
Centrifugal filtration—cisplatin recovery and assessment of Pt bound to the low molar mass fraction
In order to maintain sufficient selectivity of chromatographic separation as necessary for conventional one dimensional HPLC-ICP-MS analysis, removal of the high molar mass cytosolic fraction was required. For this purpose centrifugal filtration using 10 kDa cut-off filters as clean up step was evaluated in this work. In Table 1 the filter recoveries of the tested centrifugal filter devices are listed for a cisplatin standard and for a cytosol sample (cell line P31) incubated for 24 h with an initial cisplatin concentration of 5 µM. The values were assessed by flow injection (FI)-ICP-MS of the filtrated versus the unfiltrated samples. Comparing the results obtained by the set of tested filter systems clearly shows that the recovery of the cisplatin standard was independent from the used filter system, however, in the sample matrix the Pt concentration recovered in the filtrate representing the cytosolic low molar mass fraction depended on the filter system. Hence, a quantitative value for Pt bound to either low molar mass biomolecules or proteins (determined as difference from total cytosolic Pt) assessed by cut-off filtration is a method based value.| Standards | ||
|---|---|---|
| Filter | Filter membrane | Recovery (%) |
| “Biomax” | Polyethersulfone | 97.8 ± 1.5 |
| “Amicon” | Regenerated cellulose | 99.3 ± 0.9 |
| “Vivaspin” | Polyethersulfone | 98.3 ± 1.5 |
Chromatographic separations of intact cisplatin
In this work, two complementary chromatographic separation principles in combination with ICP-MS detection were applied for quantification of intact and free cisplatin as the retention time is the only species identification parameter. Both methods, which were already established in the past in our laboratory,13,23 were applied for the first time for determination and quantification of intact cisplatin in cytosol samples of human cancer cells. In Fig. 2 chromatograms of a 25 µg L−1 cisplatin standard recorded with both methods are depicted. Stability of cisplatin standards in 15 mM NaCl solution was checked by repeated measurement of cisplatin standards (5 to 500 µg L−1 cisplatin), which were stored in the cooled autosampler at 4 °C. Relative standard deviations ranging at 5% were assessed for intact cisplatin determination by both LC-ICP-MS methods over a measurement time of 13 hours (N = 4). The LODs were 0.11 µg L−1 and 0.013 µg L−1 (corresponding to 530 fg and 65 fg absolute LODs, both given as total drug) for the separation based on the porous graphitic carbon stationary phase (Hypercarb column) and the pentafluorophenylpropyl siloxane bonded silica phase (HS F5 column), respectively. Calculation of LOD was based on three standard deviations of the blank signal quantified by peak-height calibration. The capacity factor (k′) for cisplatin was 1.11 for the Hypercarb material compared to 0.64 for the HS F5 column. Theoretical plates were determined for the cisplatin peak according to European Pharmacopeia to be on average 2500 for Hypercarb column and 4000 for HS F5 column. At this point it has to be mentioned that HILIC separations provide superior capacity factors for cisplatin,18 however, as a drawback the sensitivity and robustness of HILIC-ICP-MS are impaired by the use of high amounts of organic solvent. Compared to the LODs obtained in this work, HILIC was inferior by at least one order of magnitude and hence not applicable in this work.17,18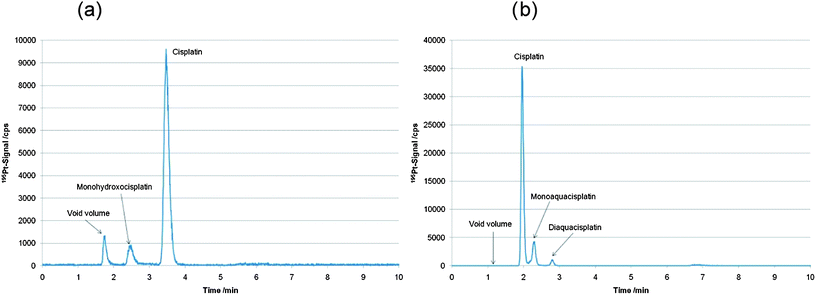 | ||
| Fig. 2 (a) LC-ICP-MS determination of a 25 µg L−1 cisplatin standard in 15 mM NaCl using the Hypercarb column.13 (b) LC-ICP-MS determination of a 25 µg L−1 cisplatin standard in 15 mM NaCl using the HS F5 column.23 | ||
Quantification of cisplatin by LC-ICP-MS based on porous graphitized carbon separations
Fig. 3 shows the LC-ICP-MS determination of a P31 cell model exposed to 5 µM cisplatin for 24 hours after cut-off filtration. To the best of our knowledge this is the first time intact and free cisplatin quantification in cell model experiments after drug incubation at biological/preclinical relevant levels (low µM) was studied. As a drawback, regarding the total Pt recovery of the filtrated cytosol samples, the Hypercarb column showed a poor performance with a recovery of only 11%, while the cisplatin standard recovery was 92.4 ± 4.6% (n = 15). The column recovery was compromised due to irreversible binding of cisplatin-biomolecule adducts not removed by centrifugal filtrations. In order to assure trueness of this method for cisplatin quantification, we applied species specific IDMS in comparison to external calibration on three cell experiments. Cisplatin enriched in 194Pt (isotopic abundance 83.7%) was spiked to filtrated cytosol samples. Table 2 summarizes the obtained values showing good agreement between IDMS and external calibration, which in turn proofed that despite the poor recovery of total Pt in the sample matrix, accuracy of cisplatin quantification by external calibration was not affected. Moreover, an additional IDMS experiment, where the spike was added prior to centrifugal filtration was carried out (see Table 2) and showed good agreement to external calibration. This experiment proofed that cisplatin could be quantitatively recovered over the whole analytical process including centrifugal filtration. Comparing different filter systems showed that all cut-off filter systems could be used in combination with this separation (see Table 3). These values were obtained from independently prepared cell experiments and are therefore given in µg g−1 protein, since otherwise number of cells of the experiment would not be considered and biological replicates could not be compared.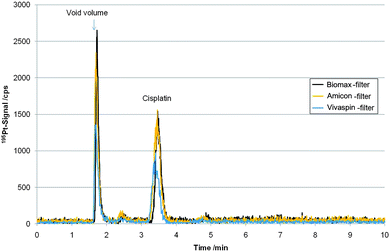 | ||
| Fig. 3 LC-ICP-MS measurements based on porous graphitic carbon separation of filtrated cytosol samples of cell line P31, incubated for 24 h with an initial cisplatin concentration of 5 µM, after filtration with “Biomax”-, “Amicon”- and “Vivaspin”-Filter, respectively. | ||
| Protein related | |||
|---|---|---|---|
| Cell-line | Initial cisplatin concentration/µM | Cisplatin concentration calculated by IDMS/µg g−1 protein | Cisplatin concentration calculated by external calibration/µg g−1 protein |
| a Spiking of sample was performed before filtration with “Vivaspin”-Filter. | |||
| KB-3-1 | 5 | 0.19 ± 0.01 | 0.20 ± 0.02 |
| P31 | 5 | 1.6 ± 0.2 (1.5 ± 0.2)a | 1.4 ± 0.09 |
| P31 | 50 | 4.6 ± 0.2 | 4.0 ± 0.4 |
Quantification by LC-ICP-MS using a chromatographic separation based on a highly fluorinated stationary phase
Next, the complementary LC separation based on a highly fluorinated stationary phase in combination with ICP-MS detection was validated for the quantification of cell associated cisplatin. Compared to the porous graphitic carbon stationary phase, the pentafluorophenylpropyl siloxane bonded silica phase showed superior column recovery rates, i.e. 100.2 ± 1.4% (N = 7) for cisplatin standards and >50% for the total cytosolic Pt species. A standard addition using filtrated cytosol samples of the cell lines KB-3-1 and P31 (initial cisplatin concentrations used for incubation: 5 and 50 µM) with a cisplatin standard (10 µg L−1 and 25 µg L−1 for samples incubated with an initial cisplatin concentration of 5 and 50 µM, respectively), revealed a recovery of 94 ± 3.0% for cisplatin. Hence, also in this case it was concluded that despite the incomplete recovery of cytosolic Pt species from this column, cisplatin could be quantitatively assessed. However, in cell models exposed to the metallodrug for long periods such as 24 hours, separation of intact drug on the fluorinated phase and consequently quantification was hampered. As can be readily seen in Fig. 4 adjacent to the cisplatin peak an unknown Pt species was detected, which could be separated from cisplatin using Biomax Filters (no base-line separation), however, could not be resolved from the intact drug using the two other investigated 10 kDa cut-off filters. This species was present in both investigated cell lines using drug exposure times of at least several hours. Accordingly, using the HS F5 column, the selection of a cut-off filter with efficient removal of proteins was a crucial step. As can be readily observed in Table 3 only the Biomax Filter delivered results which were in agreement with values obtained by the complementary LC-ICP-MS method (Hypercarb) of this work. This indicates that in contrast to the Hypercarb-column the selectivity of the pentafluorophenylpropyl siloxane bonded silica phase regarding cisplatin was only sufficient after efficient centrifugal filtration.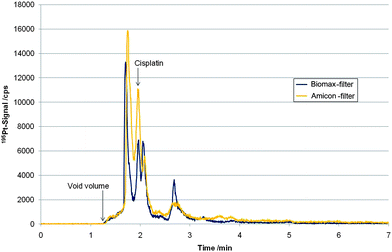 | ||
| Fig. 4 LC-ICP-MS measurements based on HS F5 separation of filtrated (“Biomax”-Filter and “Amicon”-Filter) cytosol sample of cell line P31 incubated for 24 h with an initial cisplatin concentration of 5 µM. | ||
Cell lysis
Recently, it was shown that the lysis protocol applied in cell studies had an impact on Pt speciation analysis.26 In order to exclude that the determined intact cisplatin was not generated upon cell lysis, we had selected a mild chemical cell lysis protocol avoiding trypsination of the adherent cell cultures. The average cell lysis time in this work was 40 min (including cell detachment, washing in ice-cold PBS buffer, chemical cell lysis on ice and subsequent centrifugation at 4 °C). First, the stability of cisplatin standards in lysis buffer applied in this study was assessed using the Hypercarb separation. A cisplatin standard (10 mg L−1 in 150 mM NaCl) diluted by a factor of 200 in lysis buffer could be recovered with 95 ± 5% (N = 4). Repetitive measurement over 5 hours (autosampler at 4 °C) delivered relative standard deviations of 6% (N = 6). Next, the possibility of intact cisplatin release from cisplatin–biomolecule adducts through the reactivity of lysis buffer components was addressed. For this purpose, intact cisplatin was quantified in cell culture medium samples containing 10% fetal calf serum, after 10 hours of drug incubation (5 µM) at 37 °C. Analysis was carried out using filtration with Amicon Filters in combination with the separation on graphitized carbon. The medium samples showing a large fraction of cisplatin biomolecule adducts10 were diluted by a factor of 10 either with lysis buffer or in 15 mM NaCl. While the latter samples were processed immediately after dilution, the “lysis buffer” samples were kept for 10 and 40 min at room temperature before centrifugal filtration and LC-ICP-MS analysis. This represented a worst case scenario of cell lysis. A cisplatin concentration of 394 ± 20 µg L−1 and 395 ± 20 µg L−1 was found for the 10 min and 40 min sample, respectively. These values were in good agreement with the reference value of 371 ± 22 µg L−1 (N = 5) assessed in NaCl diluted medium. As a consequence we concluded that (1) cisplatin was stable under the selected lysis conditions and (2) the actually quantified cisplatin was not released from biomolecule adducts during lysis.Biological repeatability of cellular uptake experiments
At 50 µM, a concentration level far greater than the IC50 values (for cell lines KB-3-1 and P31 IC50 values are 1.8 µM and 3.9 µM cisplatin after 72 h, respectively) of the investigated cell models, the cytotoxicity was already causing apoptosis in a significant number of exposed cells upon 24 hours of drug exposure, especially in the drug sensitive cell model KB-3-1. Very simply put, this process of programmed cell death leads to disintegration of cells, ultimately impairing the repeatability of quantification of intracellular intact cisplatin. Accordingly, the biological repeatability was extremely poor with 105% relative standard uncertainty in independently prepared KB-3-1 cytosol samples. In all other cell experiments investigated in this work a total combined uncertainty of 20% was assessed for the quantification of cell associated free intact cisplatin.Conclusion
Both applied LC-ICP-MS methods were suitable for sensitive and accurate quantification of cell associated cisplatin in cell models, after dedicated sample pretreatment by 10 kDa cut-off filtration. The selection of suitable filters, which had to be validated with respect to target analyte recovery and removal of unknown Pt species not separated from the intact cisplatin by one dimensional chromatography, resulted to be a crucial step for separations based on fluorinated phases. Generally, the column recoveries were excellent for cisplatin, but poor regarding the total Pt species present in the filtrated cytosolic samples. Via species specific isotope dilution it could be shown that the accuracy of cisplatin quantification was not impaired by this fact. Moreover, it could be shown that the assessment of protein bound Pt fraction by cut-off filtration was not an absolute number, but was method based depending on the used filter material.Acknowledgements
This work was supported by the Austrian Science Fond grant # L473. The authors acknowledge Kristof Meelich and Markus Galanski for the synthesis of enriched cisplatin.References
- B. Gammelgaard, H. R. Hansen, S. Stürup and C. Møller, Expert Opin. Drug Metab. Toxicol., 2008, 4(9), 1187–1207 Search PubMed.
- E. E. M. Brouwers, M. Tibben, H. Rosing, J. H. M. Schellens and J. H. Beijnen, Mass Spectrom. Rev., 2008, 27(2), 67–100 CrossRef CAS.
- Y. Kasherman, S. Sturup and D. Gibson, J. Med. Chem., 2009, 52, 4319–4328 CrossRef CAS.
- L. Kelland, Nat. Rev. Cancer, 2007, 7(8), 573–584 CrossRef CAS.
- J. Reedijk, Pure Appl. Chem., 1987, 59(2), 181–192 CAS.
- D. Gibson, Dalton Trans., 2009, 10681–10689 RSC.
- D. Esteban-Fernández, E. Moreno-Gordaliza, B. Cañas, M. A. Palacios and M. M. Gómez-Gómez, Metallomics, 2010, 2, 19–38 RSC.
- A. E. Egger, C. Rappel, M. A. Jakupec, C. G. Hartinger, P. Heffeter and B. K. Keppler, J. Anal. At. Spectrom., 2009, 24(1), 51–61 RSC.
- P. Heffeter, K. Böck, B. Atil, M. A. R. Hoda, W. Körner, C. Bartel, U. Jungwirth, B. K. Keppler, M. Micksche, W. Berger and G. Koellensperger, J. Biol. Inorg. Chem., 2010, 15, 737–748 CrossRef CAS.
- S. Hann, T. Falta, K. Boeck, M. Sulyok and G. Koellensperger, J. Anal. At. Spectrom., 2010, 25, 861–866 RSC.
- S. Hann, K. Boeck and G. Koellensperger, J. Anal. At. Spectrom., 2010, 25, 18–20 RSC.
- M. Sulyok, S. Hann, C. Hartinger, B. K. Keppler, G. Stingeder and G. Koellensperger, J. Anal. At. Spectrom., 2005, 20(9), 856–863 RSC.
- S. Hann, G. Koellensperger, Zs. Stefánka, G. Stingeder, M. Fuerhacker, W. Buchberger and R. M. Mader, J. Anal. At. Spectrom., 2003, 18(11), 1391–1395 RSC.
- S. Hann, Zs. Stefánka, K. Lenz and G. Stingeder, Anal. Bioanal. Chem., 2005, 381(2), 405–412 CrossRef CAS.
- G. Koellensperger and S. Hann, Anal. Bioanal. Chem., 2010, 397, 401–406 CrossRef CAS.
- G. Koellensperger, K. Meelich, M. Galanski, Zs. Stefanka, G. Stingeder and S. Hann, J. Anal. At. Spectrom., 2008, 23(1), 29–36 RSC.
- Y. Nygren, P. Hemström, C. Åstot, P. Naredi and E. Björn, J. Anal. At. Spectrom., 2008, 23, 948–954 RSC.
- T. Falta, G. Koellensperger, A. Standler, W. Buchberger, R. M. Mader and S. Hann, J. Anal. At. Spectrom., 2009, 24(10), 1336–1342 RSC.
- J. Will, W. S. Sheldrick and D. Wolters, J. Biol. Inorg. Chem., 2008, 13(3), 421–434 CrossRef CAS.
- A. Dullin, F. Dufrasne, M. Gelbcke and R. Gust, Arch. Pharm. (Weinheim, Ger.), 2004, 337, 654–667 CrossRef CAS.
- P. Heffeter, M. A. Jakupec, W. Körner, S. Wild, N. G. von Keyserlingk, L. Elbling, H. Zorbas, A. Korynevska, S. Knasmuller, H. Sutterluty, M. Micksche, B. K. Keppler and W. Berger, Biochem. Pharmacol., 2006, 71, 426–440 CrossRef CAS.
- V. Janson, B. Andersson, P. Behnam-Motlagh, K. G. Engstrom, R. Henriksson and K. Grankvist, Cell. Physiol. Biochem., 2008, 22, 45–56 CrossRef CAS.
- S. Hann, Zs. Stefánka, K. Lenz and G. Stingeder, Anal. Bioanal. Chem., 2005, 381, 405–412 CrossRef CAS.
- F. Arnesano and G. Natile, Coord. Chem. Rev., 2009, 253, 2070–2081 CrossRef CAS.
- Platinum-Based Drugs in Cancer Therapy, ed. L. R. Kelland and N. P. Farell, Humana Press, Totowa, New Jersey, 2000, ISBN 0896035999 Search PubMed.
- M. Q. T. Tran, Y. Nygren, C. Lundin, P. Naredi and E. Björn, Anal. Biochem., 2010, 396, 76–82 CrossRef.
Footnotes |
| † This article is part of a themed issue highlighting outstanding and emerging work in the area of speciation. |
| ‡ Electronic supplementary information (ESI) available: Spiking experiment: intact cisplatin standards added to cytosol of cancer cell prior to LC-ICP-MS analysis. See DOI: 10.1039/c0ja00047g |
| This journal is © The Royal Society of Chemistry 2011 |