Selenium speciation in rat colon tissues†
Marco
Roman
a,
María Luisa
Fernández Sánchez
b,
Alfredo
Sanz-Medel
b,
Héctor
González Iglesias
b,
Paolo
Cescon
ac and
Carlo
Barbante
*ac
aUniversity Ca' Foscari of Venice, Department of Environmental Sciences, Dorsoduro 2137, 30123, Venice, Italy. E-mail: barbante@unive.it; Tel: +39 041 2348942
bUniversity of Oviedo, Department of Physical and Analytical Chemistry, C/Julián Clavería 8, 33006, Oviedo, Spain
cInstitute for the Dynamics of Environmental Processes (IDPA-CNR), Dorsoduro 2137, 30123, Venice, Italy
First published on 30th November 2010
Abstract
A study of selenium (Se) speciation in rat colon tissues is presented. Four different procedures for the extraction of Se compounds were evaluated in terms of recovery and species preservation. Total Se in tissue and extracts was determined by ICP-MS and isotope dilution analysis. The selected and optimized protocol allowed an extraction of 43% of Se, while continuously bubbling nitrogen in the solution during the procedure was mandatory to prevent the oxidative degradation of selenoproteins. Speciation analysis was then performed on the extracts using size exclusion- and anion exchange-HPLC for species separation. A number of Se compounds were detected in rat colon extracts, and individually quantified by coupling HPLC-ICP-MS and species-unspecific on-line (post-column) isotope dilution analysis. Among the isolated selenospecies, the two major proteins glutathione peroxidase type 2 and thioredoxin reductase type 1 have been potentially identified by their molecular weight using MALDI-TOF-MS.
Introduction
Selenium (Se) is an essential trace element in animals and humans, due to its important role in many biological functions including oxidative stress control, thyroid hormone regulation,1insulin mimesis,2 and anticarcinogenic action.3 The biological action of Se in humans and animals is mediated by the selenoproteins, where Se is incorporated in the form of the amino acid selenocysteine. About 25 selenoproteins have been identified in human proteome4 and 24 in rat and mice proteome,5 but few of them have been fully characterized. The most interesting selenoproteins showed to carry out antioxidant action, as the glutathione peroxidases (GPxs), or cellular redox signaling, as the thioredoxin reductases (TrxRs). According to their specific function/location in the organism, such proteins can constitute promising biomarkers for global oxidative stress status as is the case for serum/plasma selenoproteins, but also may be important for organ-specific diseases. In this field the early detection and progression of cancer constitutes a major challenge. Many forms of cancer are associated with Se status,6 and among them colorectal cancer showed one of the most interesting associations.7–9 Despite the increasing need to investigate the relationship between individual selenospecies concentration/distribution and specific diseases, so far only a few analytical methodologies have been developed for Se speciation in body fluids such as plasma, serum and urine,10,11 and even fewer methodologies address tissues. Most of the published studies regarding solid samples are focused on Se speciation in foodstuff and supplements such as yeast and wheat flour,12 rice13 and fish.14–16 Therefore, accurate and precise analytical methodologies for the quantitative speciation analysis of Se in animal tissues are a necessity.In order to investigate chemical speciation studies in solid samples, the first required step is the extraction of selenospecies to a liquid phase, without any alteration of their chemical form. Many approaches have been proposed in the literature to extract Se compounds from biological samples. Leaching by aqueous solutions and aqueous-organic mixtures allows the extraction of free selenoamino acids as well as soluble and weakly-bound selenospecies from several biological matrices, but results in low recoveries.17–24 The addition of sodium dodecyl sulfate (SDS) increases the extraction efficiency for the recovery of Se-containing protein fraction.17,25,26 This reagent degrades the proteins and renders them water soluble by forming ion pairs. Proteolytic enzyme mixtures have been also widely used for the extraction of Se in a variety of solid biological matrices.17,18,22,24,26–30 In this case, quantitative recovery of Se can be obtained, but since proteases break the peptidic bonds, all of the information concerning the original selenoproteins is lost.
A system based on an HPLC coupled on-line with a Se-specific and sensitive detector such as an ICP-MS constitutes the best option for the separation and detection of selenospecies in extracts.31 Such instrument must be equipped with a collision/reaction cell since the most abundant Se isotopes are affected by spectral interferences generated in the ICP source. This solution has been successfully applied to both total Se determination and Se speciation.12,32 Quantification of Se in the chromatographic mode might be a critical issue because often commercially available standards for the detected compounds do not exist, and matrix effects can invalidate the use of other external calibrants. To overcome these drawbacks, a new powerful approach for reliable determinations in biological material speciation analysis consists of the application of species-unspecific isotope dilution techniques carried out on-line with HPLC-ICP-MS.32 This method allows accurate quantification of the heteroatom measured in the compound (in this case Se), even if its structure and composition are unknown. In this approach the species separation is performed first, and the enriched isotope is then added post-column.31 This methodology has been recently applied for Se speciation in yeast and wheat flour enzymatic extracts,12 cod muscle certified reference material33 and human serum.10
The aim of this study consists of the development of a methodology for the speciation of Se in colon tissues. Healthy rat colon samples were used as a model for humans in the first stage of the investigation, presented here. We studied different extraction procedures in order to optimize the balance between efficiency maximization and species preservation, developing a method for the separation of selenospecies based on two-dimensional (size exclusion and anion exchange) HPLC coupled on-line with ICP-MS detector. We then carried out the quantification of both total Se and individual selenospecies by isotope dilution analysis (IDA), identifying the isolated species by MALDI-TOF-MS analysis of the HPLC fractions.
Experimental
Instrumentation
Solid sample digestions were carried out with a Milestone microwave oven model Ethos-1 (Microwave Laboratory Systems, Socisole, Italy) with an EM-457(A) extractor module and an AC-100 open/close module with medium pressure PTFE vessels. Tissue extractions were carried out by using a Reax2 Stirrer (Heidolph, Kelheim, Germany), an ultrasonic bath Ultrasons (JP Selecta, Barcelona, Spain), a Sonicator up200s (Hielscher, Teltow, Germany) and an Ultra-Turrax T-8 homogenizer (Ika, Staufen, Germany). Alkaline digestion of the extraction residues was carried out in a controlled thermostatic bath Digiterm 100 (JP Selecta, Barcelona, Spain).A HPLC system Agilent 1100 series (Agilent Technologies, Tokyo, Japan) equipped with autosampler and diode array detector (DAD) was used as solvent delivery system for method development, while a Shimadzu HPLC pump (Shimadzu LC-10AD, Shimadzu Corporation, Kyoto, Japan) was used for coupling with the ICP-MS. Injections were made using a model 7725 Rheodyne valve (Rheodyne, Cotati, CA, USA) fitted with a 100 μL loop. The size-exclusion (SEC) columns were a Superdex 75 10/300 GL with MW range of 3000–70![[thin space (1/6-em)]](https://www.rsc.org/images/entities/char_2009.gif) 000 Da (Amersham Biosciences, Uppsala, Sweden); a Shodex Asahipak GS-520 HQ SEC with MW range of 10000–300000 Da (Showa Deko, Tokyo, Japan); and a Bio-Rad Bio-Sil SEC 125-5 (Bio-Rad, Richmond, California, USA) with a MW range of 5000–100000 Da. The anion-exchange (AE) column was a Mono Q™ 5/50 GL (Amersham Biosciences, Uppsala, Sweden). All the HPLC columns were connected to the ICP-MS nebulizer with PEEK® tubing (30 cm × 0.25 mm i.d.). A syringe pump model Pump 11 (Harvard Apparatus, Edenbridge, UK) was used for spike addition in on-line post-column isotope dilution analysis.
000 Da (Amersham Biosciences, Uppsala, Sweden); a Shodex Asahipak GS-520 HQ SEC with MW range of 10000–300000 Da (Showa Deko, Tokyo, Japan); and a Bio-Rad Bio-Sil SEC 125-5 (Bio-Rad, Richmond, California, USA) with a MW range of 5000–100000 Da. The anion-exchange (AE) column was a Mono Q™ 5/50 GL (Amersham Biosciences, Uppsala, Sweden). All the HPLC columns were connected to the ICP-MS nebulizer with PEEK® tubing (30 cm × 0.25 mm i.d.). A syringe pump model Pump 11 (Harvard Apparatus, Edenbridge, UK) was used for spike addition in on-line post-column isotope dilution analysis.
An inductively coupled plasma mass spectrometer (ICP-MS) equipped with a collision/reaction cell system, model 7500cx from Agilent Technologies (Agilent, Tokyo, Japan) was used for Se determinations. The instrument consists of an ICP source with plasma-shield torch, an enclosed octapole ion guide operated in the RF mode and a quadrupole mass analyser with a SEM detector. A flow of 4.0 ml min−1 of hydrogen was used to pressurise the octapole chamber. The sample introduction system consisted of a Meinhard nebuliser with double-pass glass spray chamber cooled down to 2 °C. Plasma operating conditions and acquisition parameters are presented in Table 1.
| Mass | Natural | 76Se enriched |
|---|---|---|
| a Determined after corrections for dead time, SeH+ formation, BrH+ interference and mass bias discrimination, by using natural selenium (n = 5). | ||
| 74 | 0.89 ± 0.04 | 0.170 ± 0.001 |
| 76 | 9.37 ± 0.29 | 99.599 ± 0.005 |
| 77 | 7.63 ± 0.16 | 0.177 ± 0.008 |
| 78 | 23.77 ± 0.28 | 0.026 ± 0.005 |
| 80 | 49.61 ± 0.41 | 0.022 ± 0.006 |
| 82 | 8.73 ± 0.22 | 0.006 ± 0.001 |
The selenospecies identification was carried out by a matrix assisted laser desorption ionization time-of-flight mass spectrometer (MALDI-TOF-MS) model Voyager-DE™ STR Workstation (Applied Biosystem, Langen, Germany) equipped with a nitrogen pulsed laser (337 nm) and operating in positive mode.
Reagents and materials
Ultra-pure water was obtained from a Milli-Q System (Millipore Co., Bedford, MA, USA). All reagents used were of analytical grade. Nitric acid (additionally purified by sub-boiling distillation), hydrogen chloride and hydrogen peroxide were purchased from Merk (Darmstadt, Germany). Tris(hydroxymethyl)aminomethane (TRIS) base, ammonium chloride, 25% (w/v) tetramethylammonium hydroxide (TMAH) solution in water were purchased from Sigma-Aldrich (Milan, Italy).All the TRIS-buffered solutions were prepared in ultra-pure water, and the pH was adjusted dropwise by HCl. TritonX-100 and protease inhibitor cocktails (both from Sigma-Aldrich) containing 4-(2-aminoethyl)benzenesulfonyl fluoride (AEBSF), pepstatin, E-64, bestatin, leupeptin, and aprotinin, were used for extraction buffer preparation. Protease inhibition cocktail (1% in weight) was added just before the extractions to the extraction buffer (TB) TRIS-HCl 50 mM, pH 7.4. For the preparation of extraction buffer with detergent (TBD), an aliquot of the TB solution was transferred in a plastic tube and Triton X-100 was added in 1% (v/v). All the buffers were stored at 4 °C and de-gassed immediately prior to use. Amicon Ultra centrifuge filter devices (cutoff: 30000 Da) were purchased from Millipore (Billerica, MA, USA).
Gel filtration standard mix for SEC column calibration containing the proteins: thyroglobulin (670000 Da), bovine gamma-globulin (158000 Da), chicken ovalbumin (44000 Da), equine myoglobin (17000 Da), and vitamin B12 (1350 Da), was purchased from Bio-Rad (Richmond, California, USA). Standard pure solutions of thioredoxin reductase from rat liver and glutathione peroxidase from bovine liver were purchased form Sigma-Aldrich (Milan, Italy). Peptide calibration mixture 2 containing angiotensin I, ACTH 1–17, 18–39, 7–38 clips and bovine insulin was purchased from Applied Biosystems. Sinapinic acid, α-cyano-4-hydroxycinnamic acid (HCCA) and TPCK-treated trypsin from bovin pancreas were also purchased from Sigma. A standard solution of 1000 mg L−1 of SeO32− stabilized in 2% (v/v) nitric acid Suprapur was purchased from Merck. Enriched 76Se was obtained from Cambridge Isotope Laboratories (Andover, MA, USA) as elemental powder, was dissolved in a minimum volume of sub-boiled nitric acid and diluted to volume with ultra-pure water. The concentration of this solution was determined by reverse isotope dilution analysis using a natural abundance standard. Table 1 reports the isotopic composition of natural Se and the measured isotopic composition of the enriched 76Se spike. The isotopic composition of the Se standard solution was considered to be of natural isotopic abundance, as reported by Rosman and Taylor.34
Samples
Rat colon samples (from healthy individuals) were obtained from the Animal Unit Laboratory of the University of Oviedo. The biological reference materials Bovine Liver NIST SRM 1577a, from the National Institute of Standards and Technology (Gaithersburg, MD, USA) was used as quality control for microwave digestion procedure.Procedures
:3 in water and 1.5 mL of H2O2 in a microwave oven. An appropriate amount of 76Se spike (calculated by the error magnification theory)35 was added directly into the vessels before the digestion. A previously developed program for digestion of biological samples was used.32
000 g, 4 °C for 30 min and the supernatant was transferred to a clean Eppendorf tube for immediate storage at −20 °C until analysis. For of all the sequential extractions, each step was performed by adding new 0.4 g of buffer to the residue of the previous extractions. The residues of the last sequential extraction were digested by direct addition of 5 mL of 25% TMAH solution and incubation at 60 °C for 4 h.
| SEC | |
| Columns | Bio-Rad Bio-Sil SEC 125-5 |
| Shodex Asahipak GS-520 HQ SEC | |
| Mobile phase | Tris-HCl (50 mM) pH 7.4 |
| Gradient | Isocratic |
| Flow rate | 1 mL min−1 |
| Injection volume | 100 μL |
| AE | |
| Column | Mono Q™ 5/50 |
| Mobile phases | A – Tris-HCl (25 mM) pH 8.8 |
| B – Tris-HCl (25 mM) pH 7.4 | |
| C – Tris-HCl (25 mM), CH3COONH4 (1M) pH 7.4 | |
| Flow rate | 1 mL min−1 |
| Injection volume | 100 μL |
| ICP-MS | |
| RF power | 1500 W |
| Plasma gas flow rate | 15 L min−1 |
| Auxiliary gas flow rate | 1.1 mL min−1 |
| Ion lens setting | Optimized daily for best sensitivity of 10 mg L−1Li, Co, Y and Tl, 1% (w/w) HNO3 solution |
| Reaction/collision cell H2 gas flow | 4 mL min−1 |
| Total Se determination | |
| Monitored masses | 76, 77, 78, 79, 80, 81, 82 and 83 |
| Points per peak | 3 |
| Acquisition time per point | 4 s |
| Replicates | 5 |
| HPLC coupling | |
| Monitored isotopes | 76, 77, 78 |
| Points per peak | 1 |
| Acquisition time per point | 0.5 s |
Three different SEC columns were calibrated by injecting 100 μL of the diluted calibration mixture in the mobile phase. The chromatographic profile was monitored by UV detector at 280 nm. After selection of the best column, the main SEC fraction was collected in ice, centrifuged in Amicone at 10000 g, 4 °C and washed with ∼8 mL of 25 mM TRIS-HCl buffer at pH 8.8 (previously stored at 4 °C and saturated with N2 for 10 min) until reaching a concentration two times greater than the originally injected volume.
The AE chromatographic separation was achieved by injecting 100 μL of the SEC fraction and using the operative conditions reported in Table 2. The elution sequence consists of the following steps: 1) 0–5 min 100% A; 2) 5–13 min 35% A, 65% B; 3) 13–21 min 90% B, 10% C; 4) 21–25 min 80% B, 20% C; 5) 25–30 100 % C; 6) 30–35 min 100% A.
:2 with ultra-pure water. All of the samples were directly analyzed by ICP-MS and total Se was determined by IDA. The 78Se/76Se isotopic ratio was preferred to 80Se/76Se to avoid further corrections due to the BrH+ interference on the 80Se signal.32 Signal intensities were corrected for SeH+ formation and detector dead time, and the ratio was corrected for mass bias. Plasma conditions and acquisition parameters are reported in Table 2.
000g, 4 °C) in Amicon Ultra centrifuge filters (cutoff: 30000 Da). Then, aliquots of this solution were mixed with saturated sinapinic acid, used as MALDI matrix for the determination of intact proteins MW. Linear mode was used, and external calibration of the instrument was performed daily using a bovine albumin (MW 66433 Da) standard.
The same desalted and preconcentrated fractions were also solubilized in 8 M urea, which was reduced by adding dithiothreitol to 1 mM, carboxyamidomethylated in 10 mM iodoacetamide and digested with trypsin overnight at 37 °C. The digests were mixed with saturated HCCA as MALDI matrix for peptide characterization and the reflector mode was used. External calibration of the instrument was achieved by analysing the calibration mixture 2 from Applied Biosystems.
Results and discussion
Total Se determination
Three rat colon samples collected from different healthy individuals were analyzed. The average concentration in the fresh tissue was 213 ± 48 ng g−1. For method validation, three replicates of bovine liver CRM were mixed with an appropriate amount of 76Se spike solution (at concentration of 100 ng g−1), digested in the microwave oven and analyzed for total Se in order to validate the IDA methodology. The obtained result (0.70 ± 0.01 μg g−1) was in agreement with the certified value (0.71 ± 0.07 μg g−1).Evaluation of extraction efficiency
In order to evaluate the extraction efficiency, total Se was determined in three aliquots of the pooled fresh sample, obtaining an average concentration of 169 ± 9 ng g−1. Total Se was then determined in the extracts for each investigated procedure and in the corresponding blanks and residues. The concentration was compared with the results obtained by microwave digestion of the original fresh tissue in order to calculate the extraction efficiency. The sum of total Se determined in the alkaline digested residues and Se level in the corresponding sequential extracts was compared with the total level of Se in the fresh tissue as a form of quality control. The values were not significantly different (t-test: p-value > 0.05) for all the extraction procedures. This demonstrated that there were no losses of the analyte during the sequential steps, and also that alkaline and microwave digestions are compatible methods. Table 3 reports the results obtained for all the extraction procedures and different extraction times/number of cycles. Only a small increase in efficiency was achieved by adding Triton-X to the buffer, which may be because all of the methods present enough strength to break down the membranes and allow the complete release of cytoplasmatic proteins. The ultrasonic probe extractions are an exception, where Triton-X addition increased significantly the efficiency, which otherwise was relatively low. The use of the detergent addition was rejected because it did not significantly increase extraction efficiency, and was problematic for chromatographic separation of the extracts where further sample preparation steps are required to remove the detergent before separation. Increasing the extraction time/number of cycles improves efficiency for all the methods. The use of an ultrasonic probe or Ultra-Turrax significantly reduces the extraction time necessary to obtain the same efficiency compared with ultrasonic bath and stirring. It is difficult to control the temperature when stirring in ice and ultrasonicating in cold (4 °C) water. The use of an ultrasonic probe can cause problems of analytes/sample loss due to formation of bubbles, particularly when detergent is used. Ultra-Turrax was chosen as best device for total Se extraction from rat colon tissues when taking into account a balance among efficiency, reproducibility and speed. Three replicates of extraction by this method were carried out on aliquots of the same sample to estimate the reproducibility, and an efficiency of 43 ± 2% was obtained.| Se/ng g−1 | Efficiency (%) | ||||
|---|---|---|---|---|---|
| Extraction procedure | Time/cycles | TB | TBD | TB | TBD |
| Stirring | 30 min | 50 | 57 | 30 | 33 |
| 1 h | 73 | 79 | 43 | 46 | |
| 2 h | 92 | 99 | 55 | 59 | |
| 3 h | 111 | 118 | 65 | 69 | |
| Ultrasonic bath | 10 min | 30 | 34 | 18 | 20 |
| 20 min | 49 | 53 | 29 | 31 | |
| 30 min | 64 | 70 | 38 | 41 | |
| 40 min | 79 | 87 | 47 | 51 | |
| Ultrasonic probe | 3 cycles | 54 | 92 | 32 | 54 |
| 6 cycles | 57 | 100 | 34 | 59 | |
| Ultra-Turrax | 4 cycles | 73 | 76 | 43 | 45 |
Evaluation of species preservation and optimization of extraction procedure
Species integrity preservation during extraction is a mandatory requisite for Se speciation study. Extraction procedure and buffer composition needs to be carefully optimized by avoiding thermal and chemical degradation, particularly if the expected species are unstable. In order to evaluate the species preservation, the Ultra-Turrax extracts were injected undiluted into the chromatographic system for separation by SEC. A typical chromatogram is shown in Fig. 1a. Only one peak was obtained, which corresponds to non-proteic species. Selenocysteine, selenomethionine, selenate and selenite standards were injected into the SEC column and eluted with slightly different times. From the elution of the standards, it is not possible to clearly establish the identity of the peak observed for the extract, but relying on the literature we can assume that most likely it consists of selenite released by oxidation of the selenolic groups from selenoproteins.36 To avoid such degradation, the extraction buffer was deoxygenated by continuously bubbling N2 during the procedure. The extract obtained and injected into the SEC system resulted in the chromatogram shown in Fig. 1b, where a high MW species peak appeared, and the inorganic species peak was drastically reduced. Thus, bubbling nitrogen is effective to protect the analyte from oxidative degradation, but further precludes the use of detergents during the extraction. SDS should be also avoided, because it unfolds the proteins and then renders them more sensitive to oxidation. These aspects need to be taken into account in methodologies based on ICP-MS detection, since the loss of Se from the proteins implies the impossibility to detect them. Studies based on enzymatic assays should also be aware of these aspects because Se is part of the active site, and therefore its loss compromises the activity of selenoproteins. Degradation is scarcely discussed in the literature,17,37,38 and most of the studies directly address proteolytic digestion to detect individual amino acids.13,39–41 Proteolytic digestion results in the loss of most of the information about the original speciation pattern of Se because all selenoproteins contain the same amino acid selenocysteine.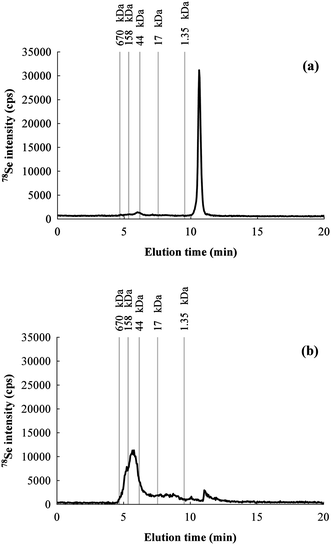 | ||
| Fig. 1 Chromatograms for 78Se obtained by SEC-HPLC of the same rat colon sample extract: (a) without bubbling N2 in the buffer during the extraction and (b) by bubbling N2. | ||
Separation of selenospecies by SEC-HPLC
Rat colon extracts from the same pooled sample (three replicates and a blank) were injected undiluted into each of the chromatographic systems equipped with one of the three SEC columns for a preliminary screening of the Se-containing species. Based on the literature, three selenoproteins are expected to be present in rat colon tissue: GPx type 1 (GPx1, homotetrameric, MW of the monomer 22305 Da), GPx type 2 (GPx2, homotetrameric, MW of the monomer 22014 Da) and TrxR type 1 (TrxR1, homodimeric, MW of the monomer 54386 Da).42 Therefore, a commercial pure standard of rat TrxR1 was also injected to estimate the elution time of the protein. Commercial standards of rat GPxs were not available, so their retention time was estimated by injecting a GPx1 from bovine liver (MW of the monomer 22659 Da). The MW of the expected proteins in the sample are very similar (GPx1: 89220 Da, GPx2: 88056 Da, TrxR1: 108772 Da), hence none of the columns allow the resolution of the proteins under investigation (see Fig. 2). The Superdex column results in a minor peak at 13.0 min which is not completely resolved from the major peak at 14.9 min. Both the Shodex and the Bio-Rad columns presented a single major peak, at 10.2 min and 5.6 min, respectively. The Shodex column presents a multimode separation mechanism (size exclusion/weak anion exchange), while the Superdex column has semipreparative characteristics. In both cases the peak shape was not as good as that obtained using the Bio-Rad column. Even if the Shodex column offers good resolution for low MW compounds (i.e.selenoamino acids),43,44 it resulted here unsuitable for the direct separation of high MW protein mixtures. From the injection of rat TrxR1 and bovine GPx1 standards it was also observed that TrxR1 elutes after (but very close to) the bovine GPx1 even if it has higher MW, which may be an effect of the complex quaternary shape of the protein.
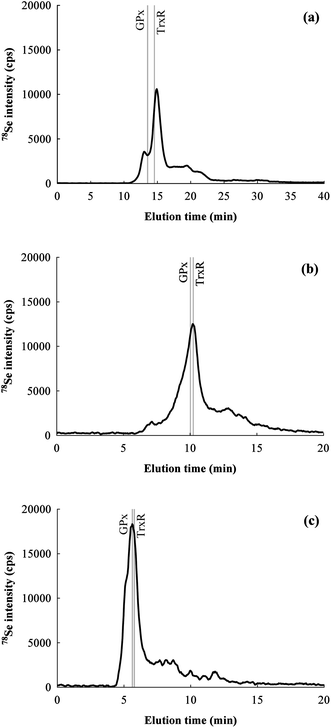 | ||
| Fig. 2 Chromatograms for 78Se obtained for the same rat colon extract by SEC-HPLC with different columns: (a) Superdex 75 10/300 GL, (b) Shodex Asahipak GS-520 HQ SEC, (c) Bio-Rad Bio-Sil SEC 125–5. The elution times signalled by gray lines were obtained by injecting TrxR1 from rat liver and GPx1 from bovine liver standards. | ||
The Bio-Rad column did not allow the isolation of at least two peaks of selenospecies, but a useful separation of the major Se peak from other species without Se can be achieved, as showed by the UV chromatogram in Fig. 3a. Therefore, the SEC-HPLC system was selected as the first purification step in order to reduce matrix complexity and to remove low MW proteins which possibly interfere with other chromatographic separation mechanisms and/or MALDI characterization. Quantitative results obtained by post-column on-line IDA and integration of the mass flow chromatograms (see Fig. 3a) show that the Bio-Rad SEC column recovery was 94 ± 2%, and fraction 1 accounted 49 ± 1% of the total Se in the extract.
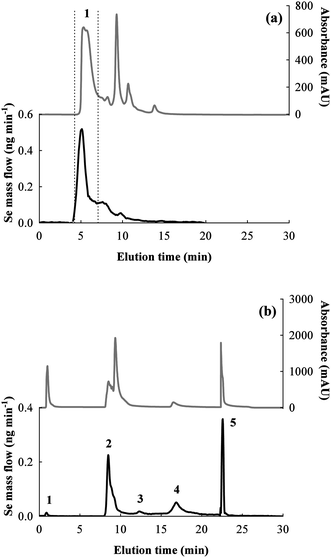 | ||
| Fig. 3 UV and mass flow (Se) chromatograms obtained by: (a) SEC (Biorad column) of the rat colon extract (fraction 1 is indicated); (b) AE of the selected SEC fraction 1 (peaks 1–5 are indicated). The hypothesized identities of selenospecies corresponding to the peaks in the AE chromatogram are: 1) pH unequilibrated species; 2) GPx2; 3) GPx2 monomer; 4) GPx1; 5) TrxR1. | ||
Separation of selenospecies by AE-HPLC
Anion exchange chromatography was the second separation mechanism investigated to isolate the selenospecies present in the SEC fraction detected by ICP-MS.Fraction 1 from SEC (Fig. 3a) corresponds to the major peak (MW > ∼30000 Da) which was collected and preconcentrated two times by ultracentrifugation in Amicones, and subsequently analyzed by AE-HPLC-ICP-MS (three replicates and a blank). The obtained chromatograms are shown in Fig. 3b. Optimization of the HPLC elution program finally allowed the separation of five well-resolved peaks of selenospecies. The theoretical pI of the expected selenoproteins (GPx1: 7.7, GPx2: 8.3, TrxR1: pI 5.9) are in agreement with the selected elution conditions and demonstrate compatibly with the correspondence of GPx2 to peak no. 2, GPx1 to peak no. 4 and TrxR1 to peak no. 5.
Injection of a pure TrxR1 standard solution resulted in single peak at elution time matching with the fifth peak of the extracts. Since the standards of rat GPxs were not commercially available, their possible identification cannot be obtained by matching retention times with pure proteins samples. However, based on a chromatographic run (not shown) obtained by a linear gradient from 100% of buffer B to 100% of buffer C (5–25 min), and with a hypothesized corresponding linear pH gradient, the experimental pH of the species corresponding to the fractions 2 and 4 were estimated as 8.1 and 7.6, respectively. The measured values agree with the theoretical pI of GPx2 (8.3) and GPx1 (7.7), respectively. Quantitative determinations by post-column IDA, reported in Table 4, showed that TrxR1 accounts ∼25% of the total Se in the extract. Considering a constant ratio Se/protein 1:1 (for the monomer), TrxR1 extracted from the tissue can be estimated as 0.13 nmol g−1.
| Peak no. | Se | |
|---|---|---|
| /ng g−1 | (%) | |
| 1 | 1.0 ± 0.3 | 1.2 |
| 2 | 33.5 ± 0.9 | 42.7 |
| 3 | 3.6 ± 0.9 | 4.6 |
| 4 | 20.6 ± 1.3 | 26.0 |
| 5 | 20.2 ± 1.7 | 25.5 |
| Sum | 78.9 ± 2.5 | |
The fraction 1 elutes with the void volume of the column, at pH 8.8 (buffer A), a condition which is not compatible with the expected proteins in the extract, where pH is higher than their pI. Such peaks could be due to the presence of other unexpected species, nevertheless new selenoproteins which are possibly present at extremely low levels appear to be improbably detectable by this analytical method. On the other hand, low MW species (i.e.selenite or free selenoamino acids, produced by analytes degradation) should be absent in the extract, and eventually removed by two phases of dimensional cutoff (SEC fraction collection for MW > 30000 Da and ultracentrifugation in 10000 Da cutoff membrane). A test was conducted without pH correction of the fraction before injection into the AE system, where the pH of the SEC fraction is 7.4 while the starting eluent for AE is buffered at pH 8.8. The chromatogram obtained for the fraction injected at pH 7.4 presented a much more abundant fraction 1, while the fractions 2, 4 and 5 were reduced. Consequently, the presence of fraction 1 is due by species (mainly GPxs) incompletely equilibrated with the new pH conditions. Even if this effect is negative for quantitative proposes, fraction 1 constitutes only ∼1% of total Se in the extract (Table 4), and therefore is negligible. Fraction 3 elutes in the same conditions of fraction 2, but with higher retention time. Its presence could be due to the GPx2 monomer, which is another possible degradation product of the tetrameric protein.36 The level of fraction 3 species correspond to ∼5% of total Se, which is relatively low in respect to the other main proteins.
Quantification of fractions 2 and 4 (Table 4) showed that GPx2, a protein secreted into the gastrointestinal mucosa, is the major selenospecies in rat colon tissue extract, accounting for ∼43% of the total Se. The cytoplasmatic GPx1 represents 26% of Se in the extract, comparable to the level of TrxR1. Considering a constant ratio Se/protein 1:1 for the GPxs monomer, GPx1 and GPx2 extracted from the tissue can be estimated as 0.11 and 0.07 nmol g−1, respectively.
Identification by MALDI-TOF-MS
Fractions 2, 4 and 5 from AE chromatography (see Fig. 3b) were collected and analyzed by MALDI-TOF-MS for intact proteins identification. Fig. 4b shows a typical spectrum obtained for fraction 5: a molecular ion (M + H)+ was observed at m/z 55178, ∼800 Da higher than the predicted MW of the candidate protein TrxR1 (54386 Da). The same fraction was also collected after injection of an extract spiked with the standard of TrxR1, and again analyzed by MALDI-TOF-MS. A similar molecular ion (M + H)+ was observed at m/z 55303, and was more intense with respect to the background. On the other hand, the direct analysis of the TrxR1 standard gave a molecular ion (M + H)+ at m/z 54394. The observed bias between the MW of TrxR1 predicted/measured as pure standard and spiked to the sample appears to be due to matrix effects such as the formation of clusters in the ionization process.
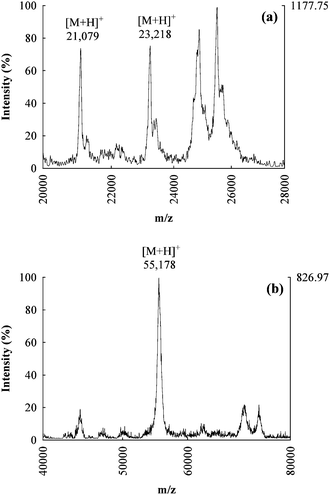 | ||
| Fig. 4 MALDI-TOF-MS mass spectra of intact proteins for the AE fractions 2 (a) and 5 (b), the candidate molecular ions for GPx2 and TrxR1 are respectively reported. | ||
Fig. 4a shows the mass spectrum obtained for MALDI-TOF-MS characterization of fraction 2. In this case two molecular ions (M + H)+ were observed at m/z 21079 and 23218 which are both possible candidates for GPx2 identification (theoretical MW 22014 Da). Since no commercial standard of GPx2 was available, a comparison with the analysis of a spiked sample was impossible. Both observed m/z values could correspond to the target protein, with a mass difference due to degradation processes which do not involve the selenolic group (for the lower mass) or again by matrix effects (for the higher mass).
No candidate masses for GPx1 were observed in fraction 4, most probably due to the low concentration of the selenospecies and the complexity of the matrix. For these reasons, it was also impossible to identify selenoproteins by characterization of the tryptic digested fractions. Four peptides matching with theoretical fragments of GPx2 digestion were observed in fraction 2, but they were not sufficiently numerous to render the protein identification statistically significant.
Conclusions
This study demonstrates that among several protocols for the extraction of selenospecies from rat colon samples, Ultra-Turrax homogenizer is the most suitable device to obtain good extraction efficiency and species preservation. Bubbling nitrogen during the procedure prevents the problematic but often ignored aspect of oxidative degradation of selenolic groups, which result in the loss of Se as selenite. A method based on two-dimensional SEC and AE-HPLC-ICP-MS efficiently separates and accurately quantifies at least three selenospecies present in the extracts, potentially identified as the proteins GPx1, GPx2 and TrxR1. Among them, GPx2 was the most abundant Se protein in rat colon extracts in terms of Se, while TrxR1 was the most abundant at protein level. This study demonstrates that using a method based on HPLC-ICP-MS and post-column IDA, it is possible to simultaneously quantify all the three selenoproteins present in rat colon tissue at extremely low concentration. This method is suitable for future studies aimed to comparisons of the selenoproteins pattern in the colons of rats affected by cancer and healthy individuals, in order to investigate the potential role of colon tissue selenoproteins as cancer biomarkers.Abbreviations
| AE | anion-exchange |
| AEBSF | 4-(2-aminoethyl)benzenesulfonyl fluoride |
| DAD | diode array detector |
| GPx | glutathione peroxidase |
| HCCA | α-cyano-4-hydroxycinnamic acid |
| HPLC | high performance liquid chromatography |
| ICP-MS | inductively coupled plasma-mass spectrometry |
| IDA | isotope dilution analysis |
| MALDI-TOF-MS | matrix assisted laser desorption-time of flight-mass spectrometry |
| MW | molecular weight |
| PTFE | polytetrafluoroethylene |
| RF | radio frequencies |
| SEC | size-exclusion chromatography |
| SEM | secondary electron multiplier |
| SDS | sodium dodecyl sulphate |
| TB | (TRIS-HCl) extraction buffer |
| TBD | (TRIS-HCl) extraction buffer with detergent |
| TMAH | tetramethylammonium hydroxide |
| TPCK | L-(tosylamido-2-phenyl) ethyl chloromethyl ketone |
| TRIS | tris(hydroxymethyl)aminomethane |
| TrxR | thioredoxin reductase |
References
- A. C. Bianco, D. Salvatore, B. Gereben, M. J. Berry and P. R. Larsen, Endocr. Rev., 2002, 23, 38–89 CrossRef CAS.
- S. R. Stapleton, Cell. Mol. Life Sci., 2000, 57, 1874–1879 CrossRef CAS.
- P. D. Whanger, Br. J. Nutr., 2004, 91, 11–28 CrossRef CAS.
- L. V. Papp, J. Lu, A. Holmgren and K. K. Khanna, Antioxid. Redox Signaling, 2007, 9, 775–806 Search PubMed.
- K. M. Barnes, J. K. Evenson, A. M. Raines and R. A. Sunde, J Nutr, 2009, 139, 199–206 CAS.
- J. Gromadzińska, E. Reszka, K. Bruzelius, W. Wąsowicz and B. Åkesson, Eur. J. Nutr., 2008, 47, 29–50 CrossRef CAS.
- D. Milde, O. Novák, V. Stuzka, K. Vyslouzil and J. Machácek, Biol. Trace Elem. Res., 2001, 79, 107–114 CrossRef CAS.
- M. Sciezka, A. Danch, M. Machalski and M. Drozdz, Neoplasma, 1997, 44, 395–397 Search PubMed.
- D. Psathakis, N. Wedemeyer, E. Oevermann, F. Krug, C. Siegers and H. Bruch, Dis. Colon Rectum, 1998, 41, 328–335 Search PubMed.
- P. Jitaru, M. Roman, G. Cozzi, P. Fisicaro, P. Cescon and C. Barbante, Microchim. Acta, 2009, 166, 319–327 CrossRef CAS.
- K. Wrobel, K. Wrobel, S. S. Kannamkumarath and J. A. Caruso, Anal. Bioanal. Chem., 2003, 377, 670–674 CrossRef CAS.
- V. D. Huerta, L. H. Reyes, J. M. Marchante-Gayon, M. L. F. Sanchez and A. Sanz-Medel, J. Anal. At. Spectrom., 2003, 18, 1243–1247 RSC.
- Y. Fang, Y. Zhang, B. Catron, Q. Chan, Q. Hu and J. A. Caruso, J. Anal. At. Spectrom., 2009, 24, 1657–1664 RSC.
- P. Moreno, M. A. Quijano, A. M. Gutierrez, M. C. Perez-Conde and C. Camara, Anal. Chim. Acta, 2004, 254, 315–327 CrossRef.
- A. I. Cabañero, C. Carvalho, Y. Madrid, C. Batoréu and C. Cámara, Biol. Trace Elem. Res., 2005, 103, 17–35 CrossRef CAS.
- Z. Pedrero, Y. Madrid, C. Cámara, E. Schram, J. B. Luten, I. Feldmann, L. Waentig, H. Hayen and N. Jakubowski, J. Anal. At. Spectrom., 2009, 24, 775–784 RSC.
- C. Casiot, J. Szpunar, R. Lobinski and M. Potin-Gautier, J. Anal. At. Spectrom., 1999, 14, 645–650 RSC.
- M. Kotrebai, M. Birringer, J. F. Tyson, E. Block and P. C. Uden, Analyst, 2000, 125, 71–78 RSC.
- P. Moreno, M. A. Quijano, A. M. Gutierrez, M. C. Perez-Conde and C. Camara, J. Anal. At. Spectrom., 2001, 16, 1044–1050 RSC.
- S. M. Bird, H. H. Ge, P. C. Uden, J. F. Tyson, E. Block and E. Denoyer, J. Chromatogr., A, 1997, 789, 349–359 CrossRef CAS.
- E. H. Larsen, M. Hansen, T. Fan and M. Vahl, J. Anal. At. Spectrom., 2001, 16, 1403–1408 RSC.
- M. Dernovics, Z. Stefanka and P. Fodor, Anal. Bioanal. Chem., 2002, 372, 473–480 CrossRef CAS.
- G. Onning and I. A. Bergdahl, Analyst, 1999, 124, 1435–1438 RSC.
- V. D. Huerta, M. L. F. Sanchez and A. Sanz-Medel, Anal. Bioanal. Chem., 2006, 384, 902–907 CrossRef.
- S. S. Kannamkumarath, K. Wrobel, A. Vonderheide and J. A. Caruso, Anal. Bioanal. Chem., 2002, 373, 454–460 CrossRef CAS.
- W. Wang, Z. Chen, D. Davey and R. Naidu, Microchim. Acta, 2009, 165, 167–172 CrossRef CAS.
- J. L. Gomez-Ariza, M. A. C. de la Torre, I. Giraldez, D. Sanchez-Rodas, A. Velasco and E. Morales, Appl. Organomet. Chem., 2002, 16, 265–270 CrossRef CAS.
- P. Moreno, M. A. Quijano, A. M. Gutierrez, M. C. Perez-Conde and C. Camara, Anal. Bioanal. Chem., 2002, 374, 466–476 CrossRef CAS.
- R. M. Olivas, O. F. X. Donard, N. Gilon and M. PotinGautier, J. Anal. At. Spectrom., 1996, 11, 1171–1176 RSC.
- L. Hinojosa Reyes, J. L. G. Mar, G. M. M. Rahman, B. Seybert, T. Fahrenholz and H. M. S. Kingston, Talanta, 2009, 78, 983–990 CrossRef CAS.
- Z. Pedrero and Y. Madrid, Anal. Chim. Acta, 2009, 634, 135–152 CrossRef CAS.
- L. Hinojosa Reyes, J. M. Marchante-Gayón, J. I. García Alonso and A. Sanz-Medel, J. Anal. At. Spectrom., 2003, 18, 1210–1216 RSC.
- V. D. Huerta, M. L. F. Sanchez and A. Sanz-Medel, J. Anal. At. Spectrom., 2004, 19, 644–648 RSC.
- K. J. R. Rosman and P. D. P. Taylor, J. Phys. Chem. Ref. Data, 1998, 27, 1275–1287 CrossRef CAS.
- J. I. García Alonso, Anal. Chim. Acta, 1995, 312, 57–78 CrossRef.
- ÒPalacios and R. Lobinski, Talanta, 2007, 71, 1813–1816 CrossRef CAS.
- D. Behne, D. Alber and A. Kyriakopoulos, J. Trace Elem. Med. Biol., 2009, 23, 258–264 CrossRef CAS.
- D. Behne, D. Alber and A. Kyriakopoulos, J. Radioanal. Nucl. Chem., 2009, 281, 31–34 CrossRef CAS.
- J. L. Capelo, P. Ximenez-Embun, Y. Madrid-Albarran and C. Camara, Anal. Chem., 2004, 76, 233–237 CrossRef CAS.
- A. I. Cabañero, Y. Madrid and C. Camara, Anal. Bioanal. Chem., 2005, 381, 373–379 CrossRef CAS.
- D. T. Juniper, R. H. Phipps, E. Ramos-Morales and G. Bertin, Animal, 2008, 2, 375–380 CAS.
- R. Irons, B. A. Carlson, D. L. Hatfield and C. D. Davis, J. Nutr., 2006, 136, 1311–1317 CAS.
- Y. Ogra, K. Ishiwata, H. Takayama, N. Aimi and K. T. Suzuki, J. Chromatogr., B: Anal. Technol. Biomed. Life Sci., 2002, 767, 301–312 CrossRef CAS.
- Z. Pedrero, J. R. Encinar, Y. Madrid and C. Cámara, J. Chromatogr., A, 2007, 1139, 247–253 CrossRef CAS.
Footnote |
| † This article is part of a themed issue highlighting outstanding and emerging work in the area of speciation. |
| This journal is © The Royal Society of Chemistry 2011 |