Selenium speciation in different organs of African catfish (Clarias gariepinus) enriched through a selenium-enriched garlic based diet
Zoyne
Pedrero†
a,
Sara
Murillo
a,
Carmen
Cámara
a,
E.
Schram
b,
J. B.
Luten
c,
Ingo
Feldmann
d,
Nobert
Jakubowski
e and
Yolanda
Madrid
*a
aComplutense University of Madrid, Ciudad Universitaria s/n, 28040, Madrid, Spain. E-mail: ymadrid@quim.ucm.es
bWageningen IMARES, PO Box 68, 1970 AB, IJmuiden, The Netherlands
cNofima Marin, PO Box 6122, N-9291, Tromso, Norway
dISAS, Institute for Analytical Sciences, D 44013, Dortmund, Germany
eBAM – Federal Institute for Materials Testing and Research, Richard-Willstaetter-Str. 11, 12489, Berlin, Germany
First published on 27th September 2010
Abstract
Speciation of Se in fish is needed to elucidate the metabolism of this element in living organisms in the marine environment. In this paper, selenium concentration and its species distribution in several organs and tissues (liver, gills, kidney, muscle and gastrointestinal tract) of African catfish fed with a selenium-enriched garlic based diet was studied. The intention of this paper is focused on both the investigation of selenium distribution in the soluble protein fraction and the detection of selenoaminoacids. Thus, two different procedures have been developed. In the first procedure, screening of selenium in proteins in the Tris-buffer soluble fraction of different tissues was carried out by size exclusion chromatography-inductively coupled plasma-mass spectrometry (SEC-ICP-MS) and by laser ablation-inductively coupled plasma-mass spectrometry (LA-ICP-MS) after sodium dodecyl sulfate polyacrylamide gel electrophoresis (SDS-PAGE) separation and electroblotting onto membranes. For the amino acid analysis, several sample treatments for Se-species extraction, based on enzymatic hydrolysis, were compared. The best results were obtained for incubation at controlled temperature. Application of several sample treatments in conjunction with different chromatographic techniques (reverse phase, anion exchange and ion exchange/size exclusion) was crucial to unambiguous Se-species identification. In Se-enriched African catfish a noticeable increase in the content of selenium in different organs was observed, except for the liver, where the Se level remained unaltered. The kidney was the Se-target organ in animals fed with enriched Se food. Selenomethionine (SeMet) was the main Se species identified in fillet extracts, whereas the presence of selenocysteine (SeCys) was detected in the liver and both SeMet and SeCys were present in the kidney.
Introduction
Due to an increasing awareness of healthy food, the interest in food products enriched with Se is evidenced by the new development of these foodstuffs.1,2 In order to supplement possible deficiencies of this element in the diet, which otherwise can cause several diseases3,4 a number of Se-enriched products have been developed. The interest in selenium-enriched food is not only limited to reaching the adequate amount of selenium dietary intake, but also to enriching foods in the bioeffective and bioavailable selenoaminoacids.5,6The most important and successful nutritional supplement is still selenized yeast although vegetables,7,8 bread9 and biscuits10 are promising alternatives.11–13 The literature regarding selenium speciation in other foodstuffs, for instance those of animal origin, is less abundant,14 but recently several articles have been published on this subject,15 for example studies in lamb, chicken,16 cows, calves17 and several fish species,18–20 usually enriched by a Se-fortified diet. However, current opinions of the EFSA (European Food Safety Authority) indicate that there is insufficient data about the safety of selenium compounds (as selenomethylselenocysteine) in food supplements.21
A better understanding of Se metabolism in animals would provide valuable information for improved design and development of more effective Se-enriched food, but the development of adequate analytical procedures for selenium speciation in these complex matrices is still a challenge. As is well-known, Se can be incorporated into proteins, where it is present as selenomethionine (in selenium containing proteins) or selenocysteine (in selenoproteins).22
In most of the literature regarding selenium speciation, the analyses are carried out on enzymatic extracts. In order to release the selenoaminoacids, proteolytic digestions using different enzymes and conditions have been applied.23,24 However, one of the main problems associated with selenium speciation is the extraction efficiency, which is strongly dependent on the matrix and the extraction procedure.14,25 Recently, Bierla et al. discussed the problem of selenium speciation in meat.26 They state that the low efficiency of proteolytic extractions could be a consequence of incomplete digestion due to insufficient unfolding of the proteins and the inaccessibility of the enzymes to the target bonds.26 Therefore, the procedure proposed by the authors for selenium speciation in chicken and lamb tissues is based on the use of urea, as a chaotropic agent, followed by reaction with DTT and alkylation with iodoacetamide. This procedure was successfully applied in animal tissues, and it allowed for the differentiation between selenium in selenoproteins and selenium containing proteins.26
Another important aspect concerning selenium speciation is the unambiguous identification of Se-species. Identification is mainly carried out by using the chromatographic retention time as an indicator of the identity of the species, but in several cases the co-elution of other species can lead to incorrect identifications.27
The aim of this paper is the evaluation of selenium accumulation and transformation in Se-enriched African catfish. For this purpose, the application of several sample treatments, based on the use of enzymatic incubation and ultrasound probe sonication, in tissues and organs of African catfish (Clarias gariepinus) will be investigated. Multidimensional chromatography will be also applied for the unambiguous identification of selenoaminoacids in Clarias gariepinus (organs and tissues). Further, investigation of selenium distribution in the soluble protein fraction of the different organs was also undertaken for a better understanding of the metabolism.
Experimental
Instrumentation
An ICP-MS (Thermo X series X7) equipped with a collision cell was used for all LC experiments. A mixture of helium (93%) and hydrogen (7%) was used as the collision gas at 8.8 mL min−1 for eliminating argon polyatomic interferences with Se isotopes.The chromatographic system consisted of a CM400 pump (Milton Roy) and a six-port Rheodyne 7725i sample injection valve. Se-species separation was carried out by using several chromatographic columns (Table 1).
| ICP-MS conditions | |
| Forward power | 1250 W |
| Plasma gas flow rate | 15.0 L min−1 |
| Auxiliary gas flow rate | 1.26 L min−1 |
| Carrier gas flow rate | 1.1 L min−1 |
| Nebulizer type | Babington |
| Spray chamber type | Scott-double pass |
| Data acquisition mode | Time resolved analysis |
| Isotopes monitored | 77Se, 78Se, 80Se, 82Se |
| Anion exchange chromatography | |
| Column | Hamilton PRP X-100 (250 × 4.1 mm) |
| Mobile phase | 10 mM Ammonium citrate pH 5 |
| Flow rate | 1 mL min−1 |
| Injection Volume | 100 μL |
| Size exclusion/ion exchange | |
| Column | Shodex Asahipak GS-220 HQ (300 × 7.5 mm) |
| Mobile phase | 25 mM Ammonium acetate pH 6.7 |
| Flow rate | 0.6 mL min−1 |
| Injection Volume | 100 μL |
| SEC Chromatographic parameters | |
| Column | Biosep SEC 2000 (300 × 7.80 mm) |
| Mobile phase | 50 mM Tris-HCl pH 6.8 |
| Flow rate | 1 mL min−1 |
| Injection Volume | 200 μL |
| Reverse phase | |
| Column | Symmetryshield PP18 150 × 3.9 mm, 5 mm |
| Mobile phase | Mobile phase: A: 0.1% HFA, B: 1% HFBA, 2% methanol, pH 2.1 |
| Flow rate | 0.8 mL min−1 |
| Injection Volume | 100 μL |
Lyophilized samples were digested for total selenium determination in double walled advanced composite vessels (ACV), using a 1000 W MSP (Microwave Sample Preparation System) microwave oven (CEM, Mattheus, NC, USA).
A double focusing sector field ICP-MS instrument (Element 2, Thermo Fisher Scientific, Bremen, Germany) was used for selenium detection in proteins. For this purpose, proteins have been separated by SDS-PAGE and electroblotted onto membranes. For sample introduction, a scanning LA system was used which has been described in detail recently.28 For laser ablation, a Nd:YAG laser (Minilite II, Continuum, Santa Clara, USA) was used. The experimental conditions for LA-ICP-MS have been described elsewhere.28 Blot membrane lanes were subsequently scanned to record Se, Cu and Zn isotopes at m/z = 82, 65 and 66 in the low resolution mode of the instrument, respectively.
A Multiphor II Flatbed Electrophoresis System connected to the EPS 3501 XL Power Supply (GE Healthcare, Freiburg, Germany) was used for electrophoretic separation. Electroblotting onto nitrocellulose membranes was performed by using a NovaBlot Cell (GE Healthcare, Freiburg, Germany).
A Sonoplus ultrasonic homogenizer was used for total selenium and Se-species extraction. The instrument was fitted with a RF generator of 2200 W at a frequency of 20 kHz and a 3 mm diameter microtip. For species extraction, a temperature controlled bath (Selecta, Tectron 200) was also used. The extracts obtained were centrifuged in an Eppendorf centrifuge 5804 F34-6-38 using 10 kDa cut-off filters (Millipore).
For extraction prior to 1D SDS-PAGE separation an ULTRA-TURRAX dispersing instrument (T-10, IKA, Germany) was used.
Standard and reagents
All reagents used were of analytical grade. Selenomethionine (SeMet), selenomethylselenocysteine (MetSeCys) and selenocysteine (SeCys2), also from Sigma, were dissolved in Milli-Q water (Millipore, USA) and 3% hydrochloric acid was added to aid dissolution of SeCys2 and MetSeCys. Inorganic selenium solutions were prepared by dissolving sodium selenite (Na2SeO3) and sodium selenate (Na2SeO4), purchased from Merck (Darmstad, Germany), in Milli-Q water. Stock solutions of 1000 mg Se L−1 were stored at 4 °C, whereas working standard solutions were prepared daily.A buffer solution of 50 mM Tris-HCl (Tris ultrapure, AppliChem, Darmstad, Germany) pH 7.5, containing 0.1 M KCl (Fluka) was used. Enzymatic hydrolysis was achieved by using protease XIV (from Streptomyces griseus, activity 4.7 units/mg solid) and lipase (from Candida rugosa, activity 1302 units/mg solid) purchased from Sigma.
Protease inhibitor cocktail (Complete, EDTA free) from Roche Diagnostics (Mannheim, Germany) in the TRIS-HCl buffer was used for extraction prior to 1D SDS-PAGE.
Procedure
African catfish (Clarias gariepinus) were farmed at the aquaculture facilities of Wageningen IMARES, described in detail elsewhere.28 The African catfish were fed with a selenium-enriched diet (8.5 μg Se g−1) based on garlic powder.20 Another group of fish, grown in parallel without selenium supplementation, was used as a control. Organs and tissues (liver, gills, kidney, muscle and gastrointestinal tract) were collected, lyophilized and stored at −20 °C until analysis.Sample treatment
The content of selenium in the different tissues of the control and selenium-enriched animals was determined by ICP-MS under the experimental conditions given in Table 1. The lyophilized samples (approximately 100 mg) were digested with 2.5 mL of 14 M HNO3 and 1 mL of 30% H2O2 in an analytical microwave. The solutions were appropriately diluted with Milli-Q water. The concentration of selenium species was determined by monitoring 77Se, 78Se, 80Se and 82Se isotopes by external calibration. In order to evaluate the accuracy of the method, the total selenium content in a white clover reference material (CRM-402) was determined and no significant differences were observed at a 95% confidence level.Selenium speciation
The general procedure for electrophoretic separation and for detection by means of LA-ICP-MS is described elsewhere.28 In a deviation from our previous work,28 only 10 μL of the diluted liver extract and 14 μL of other tissue extracts have been loaded to prevent gel overloading. The gel was divided into two parts. One part was stained with Coomassie Brilliant Blue, for visualization of protein bands. A second part was transferred onto a nitrocellulose membrane by electroblotting, according to instructions given by the manufacturer.
Molecular weight determination of detected proteins was carried out according to their migration distance by external calibration methods using the dual color molecular weight standard (Precision Plus, 161-0374, Bio Rad, Munich, Germany), which is always present (15 μL) on each blot even if not shown.
Results and discussion
Selenium distribution in different fish tissues
The total content of selenium in muscle, liver, tract, gills and kidney of animals fed with a selenium-enriched and control (without Se-supplementation) diet was determined after acid digestion in a microwave oven and the results are compiled in Table 2. The highest selenium concentration was found in the liver and kidney, well known Se-target organs,30 which accumulate 50 and 25% of the selenium content in the animals, respectively (Table 2, see acid digestion). Selenium supplementation by the use of selenium-enriched garlic results in a noticeable increase of selenium content in almost all tissues, and in particular in the kidney, which accumulates more than 50% of the total Se. It is interesting to notice that Se concentration in the liver, which is the main Se-accumulating organ in the control group, remains practically unaltered after Se-enriched diet supplementation. In contrast, the amount of Se considerably increases in the kidney. This behaviour can be linked to a Se detoxification process in the organism, showing that the liver is probably not involved in this process. Meanwhile the kidney could accumulate Se for further excretion.| Tissue | Acid digestion | Enzymatic digestion: USP | Enzymatic digestion: Tris-buffer incubation | Enzymatic digestion: Extraction with urea 7M | |
|---|---|---|---|---|---|
| Control | Se-enriched | Se-enriched | Se-enriched | Se-enriched | |
| a Results expressed as mean value ± standard deviation (n = 3). b Total selenium concentration in “remainder” samples was only determined by using microwave acid digestion as the sample treatment method. | |||||
| Liver | 16.1 ± 0.5 | 17 ± 2 | 10.4 ± 0.4 | 21 ± 2 | 20 ± 2 |
| Fillet | 1.1 ± 0.3 | 3.1 ± 0.5 | 0.98 ± 0.05 | 3.2 ± 0.1 | 3.6 ± 0.2 |
| Tract | 5.2 ± 0.8 | 7.2 ± 0.1 | 5.1 ± 0.9 | 7.8 ± 0.9 | 7.0 ± 0.3 |
| Gills | 2.0 ± 0.3 | 3.0 ± 0.3 | 1.6 ± 0.2 | 3.1 ± 0.1 | 2.9 ± 0.2 |
| Kidney | 7.9 ± 0.6 | 39 ± 5 | 22.6 ± 1.4 | 41 ± 2 | 42 ± 3 |
| Remainder | 1.6 ± 0.3 | 2.8 ± 0.2 | — | — | — |
Selenium distribution in the soluble protein fraction by SEC-ICP-MS and SDS-PAGE LA-ICP-MS
The profile of selenium (82Se) in the Tris-soluble protein fractions of the control fish and the selenium-enriched fish by SEC-ICP-MS is shown in Fig. 1. For this purpose, the proteins were extracted in 50 mM Tris-HCl buffer at pH 7.5 after 20 s of ultrasonication. From the chromatograms, several differences between both types of African catfish samples (control and selenium-enriched fish) are obvious. Selenium distribution in the soluble protein fraction is, as expected, strongly dependent on the tissue. The general trend is an accused alteration of the selenium distribution pattern in the different Se-containing fractions (peaks), which suggests a “preference” for the incorporation of selenium into some proteins. However, the low resolution of size exclusion chromatographic columns limits the information about Se incorporation into proteins.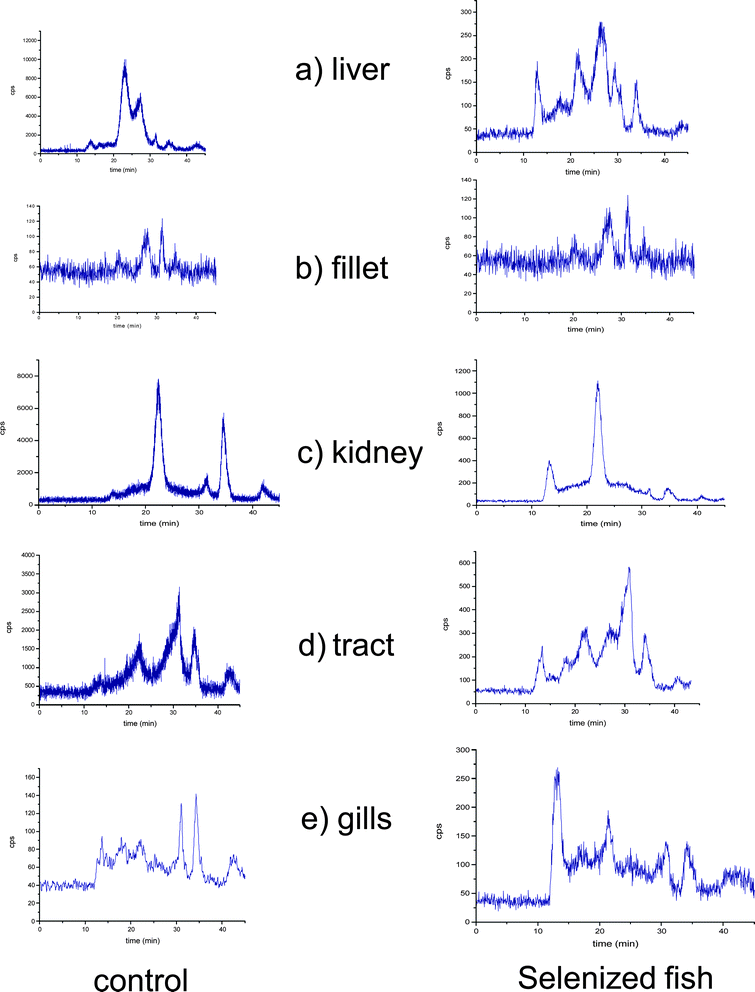 | ||
| Fig. 1 Size exclusion chromatograms obtained using a Superdex-200 column (10–600 kDa) and ICP-MS as detection system at m/z = 80. a) liver, b) muscle tissue, c) kidney, d) tract and e) gills. Control (left panel) and Se-enriched samples (right panel). | ||
The result from the SEC measurement would give the impression that only a few proteins are involved. For validation of these results, a SDS-PAGE separation was also applied because this technique provides a higher resolution even in one dimension. Further, scanning LA-ICP-MS was applied to image the Se distribution in proteins from tissue extracts of different fish organs.
In Fig. 2a, the surface plot of the intensity of 82Se+ intensity distribution on a nitrocellulose membrane is shown after SDS-PAGE separation and electroblotting using LA as the sample introduction technique for the ICP-MS. For comparison, a Coomassie stained gel is shown in Fig. 2b.
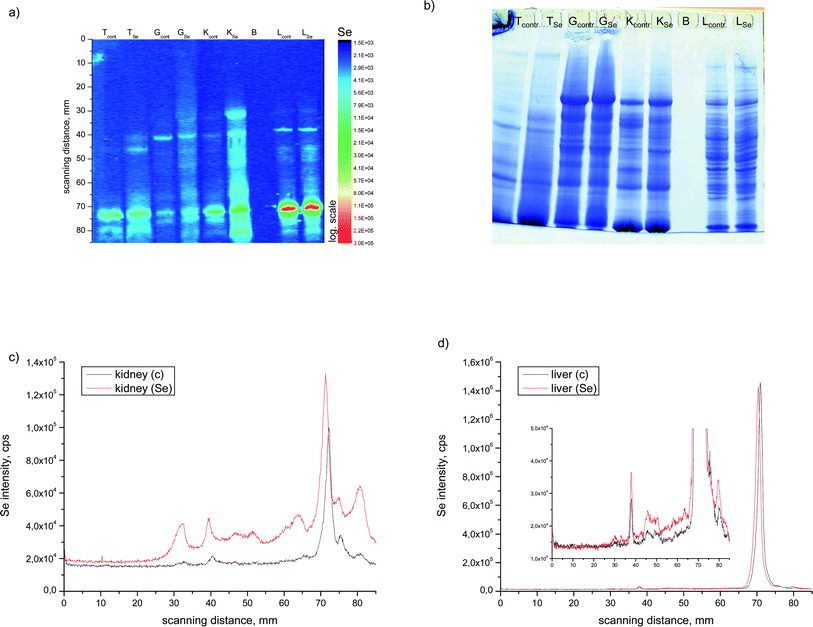 | ||
| Fig. 2 SDS-PAGE LA-ICP-MS 82Se intensity surface plot (a) and stained gel (b) of different tissues of enriched and control fish animals. LA-ICP-MS electropherogram at m/z 82 of (c) kidney and (d) liver samples. | ||
Although in the stained gel several protein bands are visible, only a few of them show elevated Se levels. In most organs nearly no differences are seen between the control fish and the selenium-enriched African catfish, except in the kidney and liver. From this comparison, it can be seen that the Se profiles (Fig. 2a, c and d) in the liver (only in the HMW range) and kidney extracts are significantly higher with a Se-enriched diet. This finding shows that selenium coming from a supplemented diet is at least partially incorporated into proteins.
Little is known about whether Se is present in other metalloproteins and if Se supplementation does have an effect on metalloprotein composition of a tissue sample. Therefore, for the kidney, the organ that shows the highest accumulation of Se after diet supplementation, the distribution of zinc and copper in the protein spots was also measured. The results are shown in Fig. 3a for the control and in Fig. 3b of the selenium-enriched fish kidney extract. In the lower part of the figure the Coomassie stained gel is shown. From the comparison between the integrated intensities measured with the LA-ICP-MS it can be seen that neither the distribution nor the intensity of the Zn and Cu containing proteins are affected by the Se supplementation. Comparing the stained gel with the metalloprotein distribution it can be seen that the metals Cu and Zn are present in the more abundant proteins whereas the main Se containing protein is hardly seen in the Coomassie stained gel, demonstrating that Se is bound to a low-abundant protein. The electropherograms (Fig. 3) show that Zn, Cu and Se are present in the same protein bands corresponding to a molecular weight of 55 and 75 kDa. But it is hard to conclude from these results that only specific metalloproteins are detected here, because it should be noticed that the protein bands can be constituted by several proteins. Thus identification for instance by ESI-MS might become more complicated.
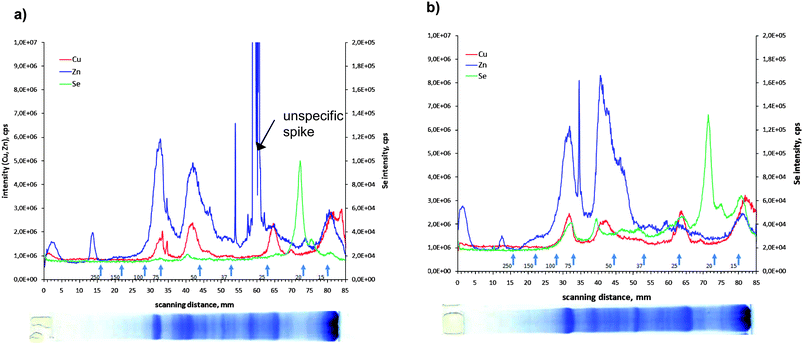 | ||
| Fig. 3 Electropherogram of 82Se, 63Cu and 66Zn corresponding to SDS-PAGE separation of the kidney of a) control and b) enriched animals. | ||
It is well known that selenium can be present in proteins as SeCys or SeMet.31 As has already been mentioned, in the first case they are named selenoproteins, and mammalian studies have implied a role in antioxidant processes. The presence of SeMet in proteins arises from unspecific substitution of methionine by selenomethionine.31 To distinguish between these two groups of proteins, identification of Se-peptides should be carried out. However, our previous experience with ESI-FT-MS28 in the study of African catfish fillet tissue illustrated that more efforts are required for its characterization in this type of sample.
This possibility in other matrices has been shown already by Goenaga Infante et al. who identified several selenium-containing glutathione species in selenised yeast32 and selenomethionine in Se-potatoes.33 Dernovics et al. developed a method based on ICP-MS assisted nano LC-electrospray Q-TOF-MS/MS for selenopeptide mapping in Brazil nuts.34 However, the improvement of analytical methodology will help to evaluate the metabolism of selenium and its species involved in the accumulation mechanism. The only strategy so far which can provide a better understanding, and which is giving a hint in which samples selenoproteins can be expected, is the analysis of the selenoaminoacid composition of our tissue extracts.
Selenoaminoacid speciation
Most of the extraction procedures for the release of selenoaminoacids from biological tissues are based on the use of proteolytic enzymes like protease, lipase, or a mixture of them.35,36 However, as it has been already mentioned, the low efficiency of species extraction, and in addition the unambiguous identification of the species, are still the main difficulties of Se speciation in animal tissues.In order to investigate the selenoaminoacid distribution in organs and tissues of fish, different sample treatments were applied: 1) ultrasonication in the presence of protease and lipase, 2) Tris-HCl buffer incubation with protease and lipase and 3) the previously mentioned carbamidomethylation process, followed by incubation with protease and lipase. The results (Table 2) show that ultrasonication for two minutes in the presence of protease and lipase provides a low efficiency of selenium extraction (from 30% in muscle tissue to 60% in liver samples). In contrast, the other two procedures allow a total extraction of selenium from the different tissues and organs analysed. The obtained results illustrate the low effectiveness of USP (ultrasonic probe sonication) for selenium extraction in this type of sample. However this procedure has been successfully applied in several other experiments,37,38,39 from which it can be concluded that the efficiency is strongly dependent on the matrix and probably also on the type of protein binding exhibited by the Se-species.
Taking into account the extraction efficiency from these results, a traditional method of incubation/digestion at 37 °C for 20 h with protease and lipase but with the prior application of the carbamidomethylation procedure proposed by Ruiz Encinar et al.29 was also applied. In spite of the low recovery observed when it was directly applied to the sample, the use of ultrasonication could be an attractive alternative to reduce the long incubation time of 20 h needed after carbamidomethylation, since ultrasonication is now applied in the last step of the procedure, after urea extraction. The resulting extracts from incubation for 20 h at 37 °C and ultrasonication for 2 min, both after carbamidomethylation, were analyzed by reverse phase chromatography-ICP-MS.
The chromatograms for fillet and kidney extracts (Fig. 4) show significant differences between both extraction methods: incubation at controlled temperature and sonication. The most relevant is the difference in the selenium profiles, which suggests the formation of artifacts and/or species transformation under the applied conditions (see zoom in Fig. 4 c and d). In addition, when ultrasonication is applied, an undefined and broad peak is found around 30 min in the chromatogram from fillet extracts. The noticeable width of the peak could be related to incomplete selenoprotein and/or selenium containing protein digestion, being constituted by selenium-peptides. It is well established that the vibrational radiation from the titanium probe creates cavities in the sample suspension, which when collapsing results in pressure changes and a shear force that produces cell disruption. Although ultrasonication offers a high efficiency for selenium extraction from different kinds of samples, the exact mechanism through which it enhances the efficiency of the enzymatic digestion is still unknown. One of the remaining questions is the heating effect, since the activity of the proteolytic enzymes is maximum at 37 °C and the temperature in the cavity interior reaches up to 5000 K.40 In addition, it has also been mentioned that the formation of oxidant radicals can produce oxidation and transformation of the original selenium species.37,41 Nevertheless, the power of this sample treatment technique for selenium speciation in several studies is unquestionable,37,39 although the negative results obtained with certain samples confirms that the effectiveness of the technique depends on the specific matrix.
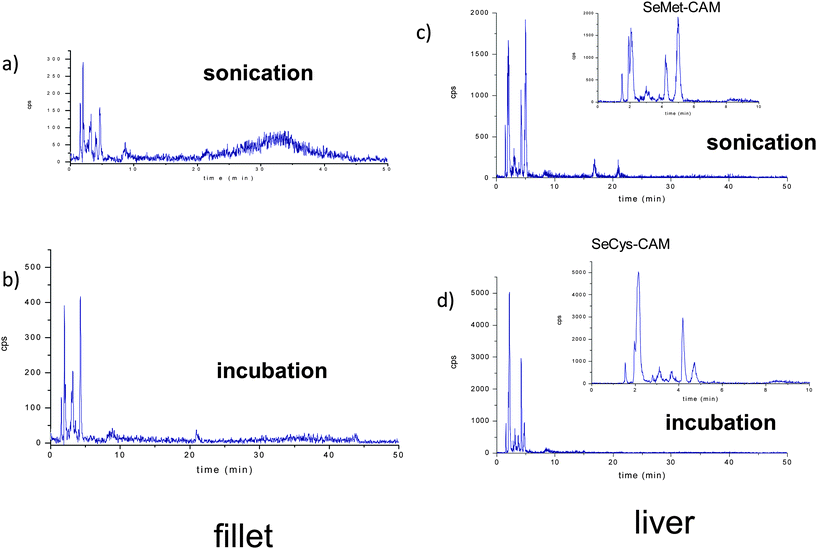 | ||
| Fig. 4 Reverse phase chromatograms corresponding to enzymatic hydrolysis extract of fillet by using a) ultrasonication, b) incubation at controlled temperature, and enzymatic hydrolysis extract of liver by using c) ultrasonication, d) incubation at controlled temperature. | ||
In the case of our study, the comparison of both selenium profiles suggests that the action of protease and lipase is more efficient when incubation at controlled temperature is applied. The area of the mentioned broad peak is about 10% higher when USP was used for the extraction in liver and kidney samples, and 50% in the case of muscle tissue (Fig. 4), which suggests that differences in the results are dependent on matrix composition. Regarding species identification, it should be done by retention time matching, due to the lack of sensitivity of the structural elucidation techniques.
One of the main problems related to the identification of selenocysteine, which is stabilized by a Se–Se bridge, is that after extraction it can become unstable.26,29,42 An approach to solve this problem is the alkylation with iodoacetamide of the SeCys residues.26,29 The disadvantage of this procedure is the alkylation of other selenium species present in the extracts. Ruiz Encinar et al. optimized the amount of reagents in order to limit the alkylation to SeCys,29 however recently Bierla et al. proposed the use of an excess of alkylation reagent towards the total conversion of selenomethionine to CAM-SeMet.26 In our study, we also used an excess of iodoacetamide, therefore the commercially available Se-standards were carbamidomethylated (by using the method described elsewhere43–45) in order to identify the Se species. However, taking into account the incomplete hydrolysis of proteins and the complexity of the chromatograms due to artifact formation when ultrasonicated, species identification on them were not intended. A preliminary screening of Se-species in the extracts obtained by incubation shows the correspondence of CAM-SeCys, as the main species in liver (Fig. 4d zoom) and CAM-SeMet in the muscle.
Considering the problems of ultrasonication previously mentioned, the enzymatic incubation step in further experiments was carried out for 20 h at 37 °C. Analyses of these extracts were then compared with those obtained in the same incubation conditions, but without carbamidomethylation. Both kinds of extracts were analyzed by different chromatographic systems in order to identify unambiguously the selenium species. For this purpose, an anion exchange column (PRP-X100) and a chromatographic column that combines size exclusion and ion exchange (Shodex Asahipax) were employed.
Fig. 5 (left panel) shows the anion-exchange chromatograms of liver, muscle and kidney tissues, enzymatically digested by incubation of the buffered solution. Predictably, the selenoaminoacid distribution varies depending on the tissues. The main species found in muscle extracts was selenomethionine, meanwhile in liver extracts a peak close to the void volume and at the same retention time as SeCys2 was detected, whereas both selenium peaks were found in the kidney. When the same extracts were injected in the Shodex chromatographic column (Fig. 5 right panel), the presence of selenomethionine as the major Se species in the muscle tissue extracts was confirmed. This species was also detected but in a small amount in the liver and kidney. However, the presence of a broad peak at the beginning of the chromatogram hampered the proper identification of the selenium-species in the first region of the Shodex chromatogram. This broad peak could be constituted by several undigested selenoaminoacids and also by possible overlapping with SeCys2. In order to obtain more information about the selenoaminoacids present in the liver and kidney, the carbamidomethylation extracts resulting from these organs were analyzed (Fig. 6). Contrary to the previous chromatograms, carbamidomethylation improves chromatographic resolution considerably. The simplicity of the chromatograms allows the identification of SeCys-CAM, the main species in liver extracts, and SeCys-CAM and SeMet-CAM in the kidney. The differences in the profile of selenium in both extracts, with and without carbamidomethylation treatment, indicate better accessibility of the proteolytic enzymes after urea treatment.
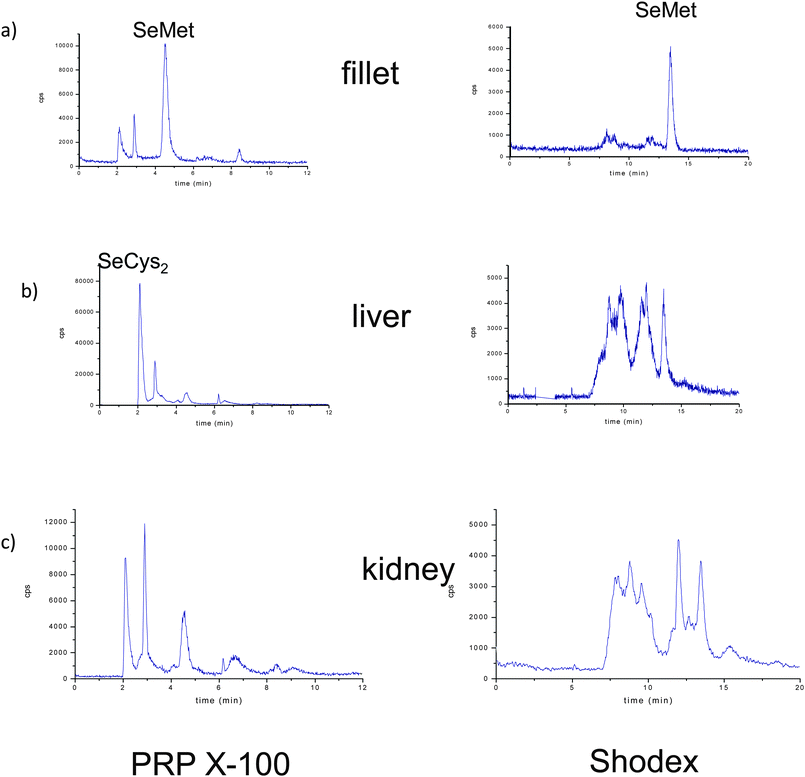 | ||
| Fig. 5 Chromatograms on PRP-X100 (left panel) and Shodex (right panel) obtained by LC-ICP-MS at m/z = 80, corresponding to buffered extraction in a control temperature incubation. a) fillet, b) liver and c) kidney of Se-enriched animals. | ||
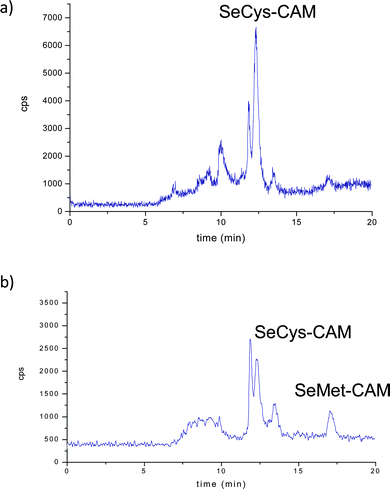 | ||
| Fig. 6 Chromatograms obtained for the carbamidomethylated extracts of a) liver and b) kidney extracts on Shodex column. | ||
The analysis of the liver enzymatic extracts from control (Fig. 7a) and Se-enriched fish reveals a similar selenoaminoacid distribution. In the case of kidney samples, the differences between enriched (Fig. 3b) and control animals (Fig. 7b) are related to a variation in the intensity ratio of the different Se species.
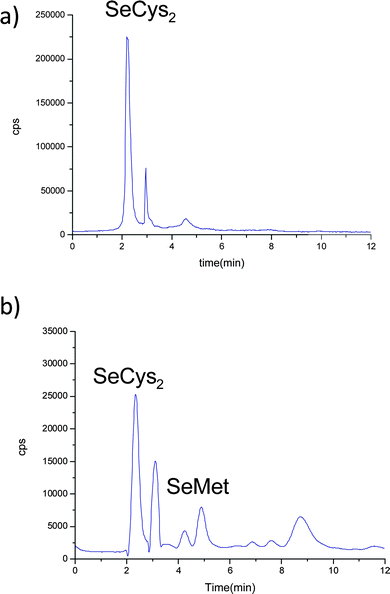 | ||
| Fig. 7 Chromatograms on PRP-X100 obtained by LC-ICP-MS at m/z = 80, corresponding to buffered extraction in a control temperature incubation. a) liver and b) kidney of control animals. | ||
The selenium species distribution in the different tissues and organs is clearly related to the metabolic activity of the different tissues. Selenomethionine, which does not have a specific metabolic function, is the major species detected in fish fillets. Conversely, selenocysteine is the main species in the liver, and is also found in the kidney. The presence of these species, released from selenoproteins, in these metabolically active glandular visceral tissues, can be explained as a result of the conversion of the species initially present in the supplemented diet by the regulated route.46,47 Selenomethylselenocysteine and γ-glutamyl-Se-methylselenocysteine were the main species found in the garlic based feed. These compounds can be metabolized by the action of γ and β-lyase to methyl selenol, and further incorporated into selenoproteins.46–48
Conclusions
Supplementation of African catfish (Clarias gariepinus) with a Se-enriched garlic diet results in an increase of selenium in the kidney, muscle tissue, gills and gastrointestinal tract, with respect to organs and tissues of control animals. The Se-accumulating organ in the fish control group was the liver, whereas Se was significantly increased in the kidney after the Se-enriched diet. The high accumulation of this element in the kidney suggests the implication of this organ in detoxification or excretion of selenium.The action of protease and lipase for the extraction of selenium species was more efficient under incubation conditions than with ultrasonication. The application of enzymatic hydrolysis (with and without carbamidomethylation) together with the use of different chromatographic separation principles was the key for an unambiguous Se-species identification. The main Se species present in the different extracts were: SeMet in the muscle tissue, SeCys in the liver and both SeMet and SeCys in the kidney. The developed method has been shown to be a valuable alternative to solve the problem of species identification in this kind of sample, where the low levels of selenium and matrix complexity complicates an ESI-MS analysis.
The fact that SeCys is present in tissue extracts from at least two organs is a good motivation for our future work to identify selenoproteins in fish.
Acknowledgements
The authors thank the Spanish Government for financial support of this study through the projects: CTQ-2008-05925 and CAM-S2009/AGR/1464. This work has been partially funded through the Integrated Project (IP) SEAFOODplus, and partially granted by the EU Commission under contract No. FOOD-CT-2004-506359. Z. Pedrero thanks the Consejería de Educación de la Comunidad de Madrid and the European Social Fund for funding through the programme “Contrato de Personal de Investigación de Apoyo”.References
- G. N. Schrauzer, J. Am. Coll. Nutr., 2001, 20, 1 Search PubMed.
- J. W. Finley, Ann. Bot., 2005, 95, 1075 CrossRef CAS.
- R. J. Coppinger, M. Diamond, Selenium deficiency and Human disease, in: D. L. Hatfield (Ed.), Selenium Its Molecular Biology and Role in Human Health. Kluwer Academic Publisher, 2001 Search PubMed.
- K. Schwarz, J. G. Bieri, G. M. Briggs and M. L. Scout, Proc. Soc. Exp. Biol. Med, 1957, 95, 621 Search PubMed.
- M. P. Rayman, H. G. Infante and M. Sargent, Br. J. Nutr., 2008, 100, 238 CAS.
- M. P. Rayman, Br. J. Nutr., 2008, 100, 254 CAS.
- A. P. Vonderheide, K. Wrobel, S. S. Kannamkumarath, C. B'Hymer, M. Montes Bayón, C. Ponce de León and J. A. Caruso, J. Agric. Food Chem., 2002, 50, 5722 CrossRef CAS.
- Y. Ogra, K. Ishiwata, J. Ruiz Encinar, R. Lobinski and K. T. Suzuki, Anal. Bioanal. Chem., 2004, 379, 861 CrossRef CAS.
- E. Kapolna, V. Gergely, M. Dernovics, A. Illés and P. Fodor, J. Food Eng., 2007, 79, 494 CrossRef CAS.
- J. K. Kirby, G. H. Lyons and M. P. Karkainen, J. Agric. Food Chem., 2008, 56, 1772 CrossRef CAS.
- M. Corola, A. Vainio and K. Edelman, Ann. Clin. Res., 1986, 18, 65 Search PubMed.
- C. A. Ponce de León, M. M. Bayón, C. Paquín and J. A. Caruso, J. Appl. Microbiol., 2002, 92, 602 CrossRef.
- L. Hinojosa Reyes, F. Moreno Sanz, P. Herrero Espílez, J. M. Marchante-Gayón, J. I. García Alonso and A. Sanz-Medel, J. Anal. At. Spectrom., 2004, 19, 1230 RSC.
- Z. Pedrero and Y. Madrid, Anal. Chim. Acta, 2009, 634, 135 CrossRef CAS.
- J. B. Taylor, M. J. Marchello, J. W. Finley, T. L. Neville, G. F. Combs and J. S. Caton, J. Food Compos. Anal., 2008, 21, 183 CrossRef CAS.
- D. T. Juniper, R. H. Phipps, E. Ramos-Morales and G. Bertin, Animal, 2008, 2(3), 375 CAS.
- H. Gutot, P. Spring, S. Andrieu and F. Rollin, Livest. Sci., 2007, 111, 259 Search PubMed.
- Y. Wang, J. Han, W. Li and Z. Xu, Anim. Feed Sci. Technol., 2007, 134, 243 CrossRef CAS.
- G. Önning, Food Chem., 2000, 68, 133 CrossRef CAS.
- E. Schram, Z. Pedrero, C. Cámara, J. W. van der Heul and J. B. Luten, Aquacult. Res., 2008, 39, 850 Search PubMed.
- EFSA Journal 2009, 1067pp. 1–23 Search PubMed.
- J. Szpunar, Analyst, 2005, 130, 442 RSC.
- Z. Stefanka, I. Ipolyi, M. Dernovics and P. Fodor, Talanta, 2001, 55, 437 CrossRef CAS.
- P. Moreno, M. A. Quijano, A. M. Gutiérrez, M. C. Pérez-Conde and C. Cámara, Anal. Chim. Acta, 2004, 315, 524.
- M. Montes-Bayon, M. J. D. Molet, E. B. Gonzalez and A. Sanz-Medel, Talanta, 2006, 68, 1287 CrossRef CAS.
- K. Bierla, M. Dernovics, V. Vacchina, J. Szpunar, G. Bertin and R. Lobinski, Anal. Bioanal. Chem., 2008, 390, 1789 CrossRef CAS.
- Z. Pedrero, J. Ruiz Encinar, Y. Madrid and C. Cámara, J. Chromatogr., A, 2007, 1139, 247 CrossRef CAS.
- Z. Pedrero, Y. Madrid, C. Cámara, E. Shram, J. B. Luten, I. Feldmann, L. Wänting, H. Hayen and N. Jakubowski, J. Anal. At. Spectrom., 2009, 24, 775 RSC.
- J. Ruiz Encinar, D. Schaumlöffel, Y. Ogra and R. Lobinski, Anal. Chem., 2004, 76, 6635 CrossRef CAS.
- S. Ciardullo, F. Aurelli, E. Coni, E. Guandalini, F. Iosi, A. Raggi, G. Ruffo and F. Cubbada, J. Agric. Food Chem., 2008, 56, 2442 CrossRef CAS.
- J. Szpunnar and R. Lobinski, Pure Appl. Chem., 1999, 71, 899 CrossRef CAS.
- H. Goenaga Infante, A. A. Borrego, E. Peachey, R. Hearn, G. O'Connor, T. G. Barrera and J. L. G. Ariza, J. Agric. Food Chem., 2009, 57, 38 CrossRef CAS.
- H. Goenaga-Infante, G. O'Connor, M. Rayman, R. Hearn and K. Cook, J. Anal. At. Spectrom., 2006, 21, 1256 RSC.
- M. Dernovics, P. Giusti and R. Lobinski, J. Anal. At. Spectrom., 2007, 22, 41 RSC.
- V. Diaz Huerta, L. H. Reyes, J. M. Marchante-Gayón and M. L. Fernández Sánchez, J. Anal. At. Spectrom., 2003, 18, 1243 RSC.
- M. Montes-Bayón, E. G. Yanes, C. Ponce de León, K. Jayasimhulu, A. Stalcup, J. Shann and J. A. Caruso, Anal. Chem., 2002, 74, 107 CrossRef CAS.
- J. L. Capelo, P. Ximénez Embún, Y. Madrid Albarrán and C. Cámara, Anal. Chem., 2004, 76, 233 CrossRef CAS.
- A. I. Cabañero, Y. Madrid and C. Cámara, Anal. Bioanal. Chem., 2005, 381, 373 CrossRef CAS.
- M. Montes-Bayón, M. J. D. Molet, E. B. González and A. Sanz-Medel, Talanta, 2006, 68, 1287 CrossRef CAS.
- Y. G. Adewuyi, Ind. Eng. Chem. Res., 2001, 40, 4681 CrossRef CAS.
- Z. Pedrero, J. Ruiz Encinar, Y. Madrid and C. Cámara, J. Anal. At. Spectrom., 2007, 22, 1061 RSC.
- S. Ma, R. M. Caprioli, K. E. Hill and R. F. Burk, J. Am. Soc. Mass Spectrom., 2003, 14, 593 CrossRef CAS.
- J. N. Burnell, J. A. Karle and A. Shrift, J. Inorg. Biochem., 1980, 12, 343 CrossRef CAS.
- T. W. M. Fan, A. N. Lane, D. Martens and R. M. Higashi, Analyst, 1998, 123, 875 RSC.
- M. Dernovics and R. Lobinski, J. Anal. At. Spectrom., 2008, 23, 744 RSC.
- Y. Shiobara and K. T. Suzuki, J. Chromatogr., B: Biomed. Sci. Appl., 1998, 710, 49 CrossRef CAS.
- K. T. Suzuki, J. Health Sci., 2005, 51, 107 CrossRef CAS.
- G. F. Combs, Br. J. Nutr., 2001, 85, 517 CrossRef.
Footnote |
| † On leave to Université de Pau et des Pays de l'Adour, Laboratoire de Chimie Analytique Bio-Inorganique et Environnement, UMR CNRS 5034, Hélioparc Pau Pyrénées 2, Avenue Pierre Angot, 64053 PAU CEDEX 9 FRANCE |
| This journal is © The Royal Society of Chemistry 2011 |
