Reaction network and mechanism of the synthesis of methylenedianiline over dealuminated Y-type zeolites†
Michael
Salzinger
and
Johannes A.
Lercher
*
Department of Chemistry, Technische Universität München, Lichtenbergstr. 4, 84747 Garching, Germany. E-mail: Johannes.Lercher@ch.tum.de; Fax: +49 89 289 13544; Tel: +49 89 289 13540
First published on 30th November 2010
Abstract
The reaction network and mechanism of the synthesis of methylenedianiline (MDA) from the condensation product of aniline and formaldehyde (aminal) on microporous acidic materials has been elucidated. The first step of the reaction, the decomposition of the aminal to N-benzylanilines, is limited by film diffusion, and the second and significantly slower step, the acid catalyzed rearrangement of these intermediates to MDA, is controlled by microkinetics on mesoporous dealuminated Y-type zeolites. This second step of the reaction network is limited by pore diffusion on zeolite BEA as an example for non-mesoporous materials. Based on time-concentration profiles, we were able to determine the reaction orders of the initial decomposition of the aminal to one and two for the following rearrangement of para-aminobenylaniline to 4,4′-MDA. From the kinetic data we deduced an SN2-type reaction mechanism and a complex reaction network, which is able to simulate the observed concentration profiles. The aniline to formaldehyde ratio in the starting mixture had a negligible influence on the final product distribution.
1. Introduction
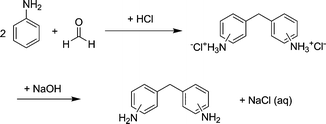
Methylenedianiline (MDA) is an important starting material for the production of methylenediisocyanate for polyurethane synthesis.1 The most interesting production route for MDA starts from the condensation of aniline and formaldehyde followed by an acid catalyzed rearrangement reaction. Industrially mineral acids, such as HCl, are applied as catalysts. This does not only pose plant engineering problems by the handling of highly corrosive material, but also environmental problems. When HCl is used as catalyst, MDA is yielded in the hydrochloride form and has to be neutralized with NaOH prior to further conversion. HCl is actually used in stoichiometric amounts and a large amount of waste containing NaCl contaminated with aniline is created (Scheme 1).Therefore, it is of great interest to replace the mineral acid in the process by a solid acid catalyst. Zeolites are very interesting in that respect, as their acidity and structure can be tailored to achieve maximum activity and lifetime.2
Several studies and a great number of patents have been published on the use of zeolites in the production of MDA from aniline and formaldehyde.3–8
All agree that the activity of zeolite catalysts is limited by diffusion processes and that catalyst deactivation by clogging of pores is a major problem. To counteract these problems, mesoporous and delaminated structures as well as nano-sized zeolite crystals were proposed. In stark contrast to these solutions driven by intuition, the reaction network and the mechanism of the formation of MDA over a zeolite catalyst has not been explored and described in detail in the literature. This understanding of the involved reaction network and the underlying reaction mechanism is, however, seen as vital for designing novel acid catalysts for the synthesis of MDA.
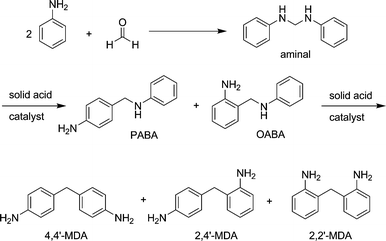
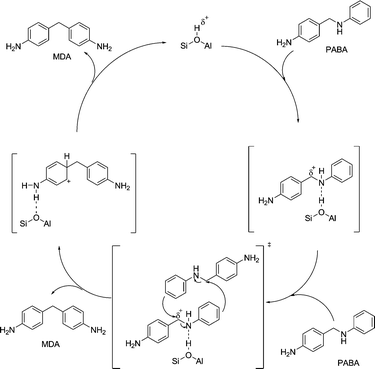
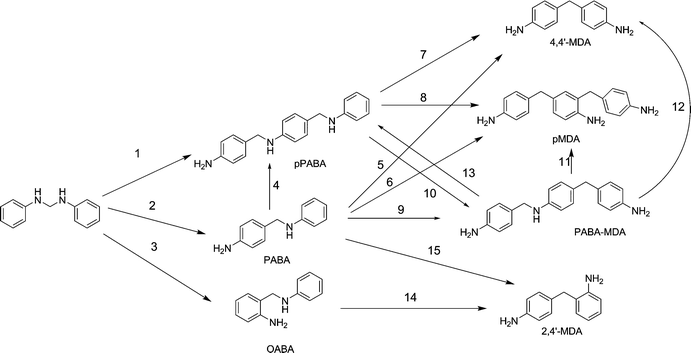
Corma et al. propose that the condensation product of aniline with formaldehyde (aminal) is subject to a series of rearrangement reactions in the presence of a Brønsted acid. The three MDA isomers (4,4′-MDA; 2,4′-MDA; 2,2′-MDA) and oligomers thereof are yielded viapara and ortho-aminobenzylaniline (PABA and OABA).3 As the reaction is believed to be diffusion limited, only a fraction of the acid sites is accessible to the aminal, which is converted into MDA as shown in Scheme 2. Kugita et al. tested this hypothesis by applying a beta zeolite (Si/Al 15) with different crystallite sizes to the reaction. It was shown, that smaller crystallites displayed higher activity in the reaction, as more acid sites close to the particle surface are accessible to the reacting molecules.4
 | ||
| Scheme 1 Current industrial process for MDA production. | ||
Therefore, we decided to explore the kinetics and the reaction network of MDA synthesis starting from the aminal on various well characterized zeolite catalysts in order to deduce a reliable reaction network and establish the overall reaction mechanism as a first step towards new catalysts.
2. Methods
The aminal solution, which was used as the starting material for all further reactions, was prepared as follows. In a 1 L round bottom flask, 600 mL of aniline (6.58 mol, Sigma, purity ≥99.5%) was heated to 50 °C under vigorous stirring. 100 mL of formalin (1.32 mol formaldehyde, Sigma, 37 wt% of formaldehyde in water, stabilized with methanol) was added dropwise. After addition, stirring was continued at 50 °C for 1 h. Water and methanol were removed in a Rotavapor. Concentration and purity of the resulting solution of 1 equivalent of aminal in 3 equivalents of aniline, which is ready for use in the test reactions, was verified by 1H- and 13C-NMR, as well as gas chromatography.For the test reaction, 10 mL of the aminal solution was placed in a three necked round bottom flask equipped with a reflux condenser and heated to the desired temperature. After the set temperature was reached, 0.50 g catalyst was added. 100 μL of sample was taken from the reaction mixture after defined time intervals and diluted with 0.9 mL of acetonitrile (Sigma, purity ≥99.5%), containing 1 mL of diphenylmethane (Fluka, purity ≥99%) per 100 mL of acetonitrile as internal standard. After removal of the catalyst by filtration through a syringe filter (Minisart SRC; 0.20 μm, d = 4 mm) the sample was analyzed by GC.
In order to calculate the activation energies for the key steps of the reaction network the test reaction was carried out at temperatures between 60 and 150 °C. The initial rates for the decomposition of the aminal, the formation of PABA and OABA and the formation of 4,4′-MDA were determined. The rate of PABA decomposition at a PABA concentration of 0.10 mol/mol of aniline was applied for the calculation of the apparent activation energy of the PABA decomposition.
For the determination of the reaction order of the decomposition of the aminal, a defined amount of catalyst (10 mg H-CBV 760 or 200 mg of H-BEA 25) was contacted with 5.0 g of a solution containing different concentrations of aminal in aniline at 70 °C (80 °C in the case of H-BEA 25). The amount of catalyst was chosen to adjust the residence time to achieve a comparable conversion with the different catalysts. In order to obtain the reaction order of the PABA decomposition, a defined amount of catalyst (20 mg CBV 760 or 200 mg of H-BEA 25) was added to 4.0 g of a solution containing different concentrations of PABA in aniline at a reaction temperature of 70 °C (80 °C in case of H-BEA 25). The initial decomposition rates of aminal and PABA conversion were derived at conversions below 10%.
In order to investigate the influence of the aniline concentration, reaction mixtures with aniline to aminal ratios ranging from 3 to 20 have been prepared. 15.0 g of these mixtures were reacted with 0.79 g of catalyst CBV 760 at 100 °C. The composition of the reaction mixture was monitored by GC. When the reaction mixture reached a constant composition after 2–4 h, the respective product distributions were determined.
For GC analysis a Shimadzu GC 2010, equipped with an Optima 35 MS column (length = 30 m, ID = 0.32 mm, film thickness 0.25 μm), a FID detector and an auto sampler was available. A temperature profile beginning at 60 °C, hold for 5 min, heating with an increment of 15 K min−1 to 170 °C, holding for 40 min, heating with 25 K min−1 up to 300 °C, holding for 15 min and heating with 25 K min−1 up to 350 °C and holding this temperature for 2 min, was applied. The injection volume was set to 1 μL with the injection port heated to 280 °C and a split ratio of 50. The instrument was calibrated to 4,4′-MDA, 2,4′-MDA, PABA, OABA and aminal, the response factors for heavier products were assumed to be identical in first approximation and were estimated by closing the mass balance of the reaction.
As catalysts, a dealuminated Y-type zeolite (CBV 760, Zeolyst), a parent Beta-type zeolite (H-BEA 25, Südchemie) and a set of Na+-exchanged CBV 760 have been tested. The Na+-exchanged CBV 760 samples were prepared from H-CBV-760 by ion exchange with NaNO3. Three partially exchanged samples were prepared by dispersing 6.0 g of CBV 760 in 90 mL of distilled water, containing 0.14 g (1.65 mmol), 0.54 g (6.35 mmol) or 0.90 g (10.6 mmol) NaNO3, at 80 °C for 16 h under vigorous stirring. One completely exchanged sample was prepared according to the same procedure using a 0.2 M NaNO3 solution and repeating the treatment two times. All samples were washed with 200 mL distilled water and dried over night at 80 °C prior to use.
Nitrogen physisorption isotherms were measured using a PMI automated sorptometer at liquid nitrogen temperature (77 K), after outgassing under vacuum at 623 K for 4 h. The apparent surface area was calculated by applying the Brunauer–Emmett–Teller (BET) theory to the adsorption isotherms over a relative pressure range from 0.01 to 0.09. The micropore volumes were evaluated using the t-plot method9 according to Halsey.10 The mesopore volumes were determined by the cumulative pore volume of pores with diameters ranging from 2–50 nm according to the BJH method.11 Because of the limitations of the PMI instrument, the isotherms were measured at relative partial pressures higher than 10−5 p/p0.
For temperature programmed desorption (TPD) experiments, approximately 50 mg of sample were activated for 1 h at 723 K in a six port parallel vacuum system (0.8 Pa). After activation, the samples were contacted with 1 mbar of NH3 at 373 K for 1 h, followed by degassing for 2 h at 373 K. For desorption, the samples were heated up to 1043 K with an increment of 10 K min−1. Ammonia desorption was monitored by mass spectrometry (Pfeiffer QMS 200 Prisma). The amount of desorbed ammonia was determined by integration of the MS signal and calibration to a standard material (H-MFI 90; 360 μmol g−1).
The elemental composition of the applied catalysts was determined by atomic adsorption spectroscopy in a Unicam M Series Flame-AAS equipped with an FS 95 auto sampler and a GF 95 graphite furnace.
3. Results
3.1 Catalyst characterization
AAS analysis showed that the parent zeolite samples H-BEA 25 and H-CBV 760 have Si/Al ratios of 12.7 and 29.5, respectively. Both catalysts only contain negligible amounts of Na.TPD of ammonia indicated acid site concentrations of 530 μmol g−1 for H-BEA 25 and 348 μmol g−1 for H-CBV 760. The sodium exchanged H/Na-CBV 760-X samples show decreasing acid site concentrations of 282, 177 and 137 μmol g−1 in line with the increasing sodium concentration (see Table 1). The acidity of the completely Na+-exchanged Na-CBV 760 is below the detection limit and its sodium content indicates complete ion exchange. XRD analysis verified that the structure of the ion exchanged Y-types was not damaged during ion exchange.
| Material name | Si/Al ratio | Na content [wt%] | Acidity [μmol g−1] | Degree of Na-exchange [%] |
|---|---|---|---|---|
| H-BEA 25 | 12.7 | <0.01 | 530 | 0 |
| H-CBV 760 | 29.5 | <0.01 | 348 | 0 |
| H/Na-CBV 760-1 | 25.8 | 0.18 | 282 | 19 |
| H/Na-CBV 760-2 | 25.7 | 0.37 | 177 | 49 |
| H/Na-CBV 760-3 | 23.6 | 0.50 | 137 | 61 |
| Na-CBV 760 | 25.5 | 1.18 | <10 | 100 |
Micro- and mesopore volume of H-BEA 25 and H-CBV 760 were determined by nitrogen physisorption. While H-BEA 25 has a micropore volume of 0.21 cm3 g−1, mesopores were not found. H-CBV 760 showed a micropore volume of 0.28 cm3 g−1 and also a significant mesopore volume (0.18 cm3 g−1).
3.2 Catalytic reactions
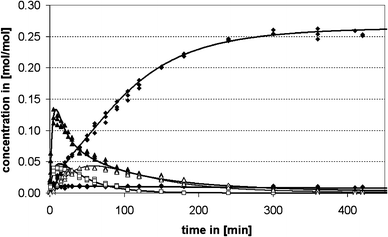
For the determination of the variations of the reaction products as a function of reaction time the reaction was carried under vigorous stirring at 100 °C with 5 wt% of CBV 760, a dealuminated Y-type zeolite (Si/Al 29.5), as catalyst. The catalyst was chosen from a variety of zeolite samples, because it displayed the highest activity in preliminary experiments. The concentration of the aminal decreased rapidly from the initial concentration of 0.33 mol/mol of aniline and is beneath the detection limit 3 min after the start of the reaction. The concentrations of PABA and a 3-ring aminal structure are increasing fast at the beginning of the reaction and, after reaching a maximum after 8 and 15 min, respectively, decrease again. The concentration of OABA in the reaction mixture rises to a level of 0.011 mol/mol of aniline and then decreases again very slowly. The concentration of an oligomer (in the following labeled as MDA-PABA) reaches a maximum after about 60 min and decomposes slowly after that. The 4,4′-MDA concentration increases almost linearly over time until it reaches a constant level of about 0.26 mol/mol of aniline at the end of the reaction. The concentrations of 2,4′-MDA and polymeric MDA (pMDA) also gradually increase until they reach a constant level of 0.014 and 0.012 mol/mol of aniline, respectively at the end of the reaction. The concentrations of the 2,4′-MDA and the 3-ring aminal are omitted in Fig. 1 for reasons of legibility.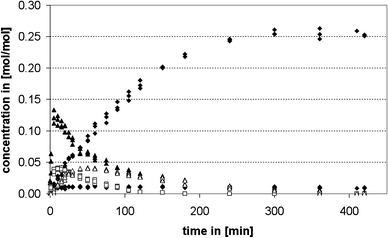 | ||
| Fig. 1 Time concentration profile of the synthesis of MDA from aminal over a dealuminated Y-type zeolite (CBV 760); ▲ PABA, ◇ OABA, ◆ 4,4′-MDA, □ pMDA, ▲ MDA-PABA. | ||
The turnover frequencies (TOFs) of all applied catalysts were determined by normalizing the initial rates of 4,4′-MDA formation to the amount of catalyst in the reactor and its Brønsted acidity. While the fully ion exchanged Na-CBV 760 sample does not show activity towards MDA formation (due to its lack of Brønsted acidity), the pure proton form H-CBV 760, as well as the sodium exchanged H/Na-CBV 760-X, display constant TOFs of about 600 min−1. The parent Beta type sample H-BEA 25 is significantly less active and reaches only a TOF of 24 min−1.
The apparent activation energies over H-CBV 760 and H-BEA 25 were derived from the initial rates by the linear fits of the respective Arrhenius plots. For the decomposition of the aminal, an apparent activation energy of 5 kJ mol−1 was found for both catalysts. For the formation of PABA a change of regimes, from external to internal diffusion imitation, is observed in the case of H-CBV 760. At temperatures below 110 °C, an activation energy of 37 kJ mol−1 was determined, while at temperatures exceeding 110 °C, it decreased to 12 kJ mol−1 (Fig 2). The same holds in principle also for the formation of OABA, where at temperatures below 90 °C an activation energy of 80 kJ mol−1 was measured, while at temperatures over 90 °C the apparent activation energy was 6 kJ mol−1. For the decomposition of PABA and the formation of 4,4′-MDA, 69 kJ mol−1 and 72 kJ mol−1 were found, respectively. For H-BEA 25 the apparent activation energy for PABA formation was 32 kJ mol−1 over the whole temperature range. The OABA formation showed a similar change of regimes as for PABA over H-CBV 760. At temperatures below 80 °C an activation energy of 155 kJ mol−1 was determined, while at temperatures exceeding 80 °C an activation energy of 24 kJ mol−1 was found. For both the decomposition of PABA and the formation of 4,4′-MDA, an activation energy of 37 kJ mol−1 was found over H-BEA 25.
A double logarithmic plot of the initial rates of PABA decompositionversus its initial concentration yields straight lines with slopes of 1 for the aminal and 2 for PABA for CBV 760 as well as 1 and 1.5 for H-BEA 25, respectively (Fig. 3).
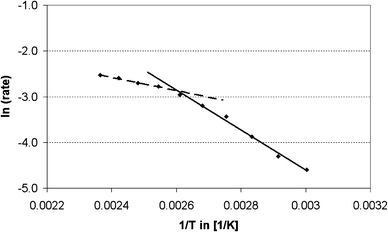 | ||
| Fig. 2 Arrhenius plot of the initial rates of formation of PABA, linear fit for dashed line y = −1431x + 0.862, R2 = 0.992; linear fit for full line y = −4368x + 8.503, R2 = 0.992. | ||
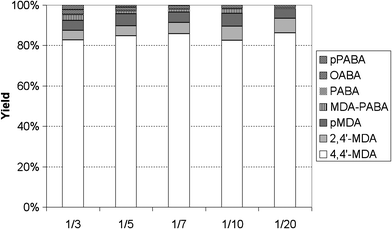
A further aspect of the reaction being subject to controversial discussion in the literature is the influence of the aminal to aniline ratio in the starting material on the final product distribution. While some publications state that a higher excess of aniline decreases the concentration of oligomers in the reaction product mixture,3,4 others claim that next to no influence of aniline concentration on the product distribution has been found.8
Fig. 4 shows the determined product distributions from reaction mixtures with different aniline to aminal ratios. The 4,4′-MDA yield was constant at about 82% for all concentrations. Also the yield of pMDA and isomers thereof is constant at 5–6%. Only the 2,4′-MDA yield rose from 4.5% up to 7%, while the OABA yield decreased from 2% to 1%. The yields of the intermediate MDA-PABA decreased continuously, because the reaction rate increases with decreasing aminal concentration, due to the higher catalyst to substrate ratio.
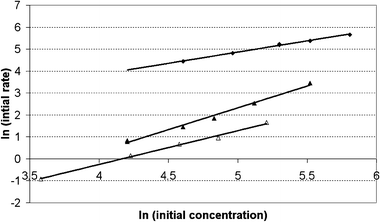 | ||
| Fig. 3 Determination of reaction orders over H-CBV 760 (full symbols) and H-BEA 25 (hollow symbols) for aminal (◆) and PABA (▲) decomposition, linear fit for aminal, y = 1.023x − 0.252, R2 = 0.993; linear fit for PABA H-CBV 760, y = 2.002x + 7.677, R2 = 0.995; linear fit for PABA H-BEA 25, y = 1.540x + 8.020, R2 = 0.995. | ||
4. Discussion
4.1 Reaction network and mechanism
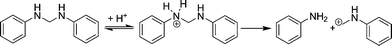
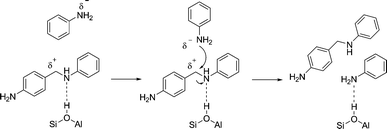
The first step of the reaction network, the decomposition of the aminal, is by far the fastest step in the reaction network. This was to be expected as the aminal is the most reactive compound involved in the reaction. In fact the observed reaction order of one and an apparent activation energy of 5 kJ mol−1 suggests that the first observable step in the reaction network is the film diffusion of the aminal to the outer surface. The decomposition of the aminal, to e.g.PABA, is too fast to be measured itself. The following steps of the reaction network, e.g. the decomposition of PABA, are significantly slower and thus can be monitored.All compounds showing a positive initial slope in the time concentration profile are primary products formed directly from the aminal. Therefore, PABA and OABA are both primary products. The formation of PABA is strongly favored due to stronger steric hindrance in the ortho position. Also pPABA and the 3-ring aminal are primary products. Literature suggests that the aminal is cleaved after protonation on an acid site and the resulting highly reactive carbenium ion attacks the next available nucleophile (Scheme 3).2
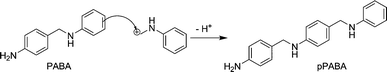
This can be either an aromatic ring at the ortho or para position or a nitrogen atom of an amino group. As there are a broad variety of nucleophiles available (aniline, the aminal itself, PABA, OABA) which can all be attacked at several positions, a broad variety of intermediates is formed from the aminal. In Scheme 4 the nucleophilic attack of the carbenium ion on the para position of a PABA molecule is shown. This reaction yields an adduct of PABA and the protonated fragment of the aminal (pPABA), which should have a similar reactivity as PABA and can be formed once PABA is present in the reaction mixture.
 | ||
| Scheme 3 Cleavage of the aminal and formation of a carbenium ion. | ||
 | ||
| Scheme 4 Reaction of the carbenium ion with PABA to form pPABA. | ||
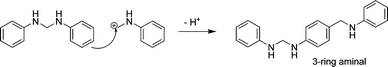
If the carbenium ion attacks another aminal at the ortho or para positions of the phenyl ring, a 3-ring aminal structure is formed, which should retain its high reactivity, because it still contains the aminal function. As the carbenium involved is a primary carbenium it will be very short-lived (Scheme 5).
These primary products do all contain at least one secondary amino function, which is also not stable on contact with a Brønsted acid. The reaction of these N-alkylaniline derivates with catalytic amounts of mineralic acids to produce para-alkylanilines is known in literature as the Hofmann-Martius rearrangement.12–14
The mechanism of this second reaction step is also presumed to proceed via a free carbenium ion in the literature.2 As it is well accepted that free carbenium ions are difficult to stabilize,15 we suggest that the substrate instead undergoes an SN2 type nucleophilic substitution reaction. When the intermediate is adsorbed onto a Brønsted acid site of the catalyst, the C–N bond will be weakened by the additional charge. The resulting positive partial charge on the C-atom makes it susceptible to a nucleophilic attack by the free electron pair of the amino function or the phenyl ring of aniline, or one of the other reaction intermediates, as illustrated in Scheme 6. An SN2-type reaction mechanism also explains the observed reaction order of two for the rearrangement of PABA to 4,4′-MDA.
A series of partially Na+ cation exchanged dealuminated Y-type zeolites having a concentration of SiOHAl groups inversely proportional to the degree of exchange showed the same turnover frequency with all materials tested. This indicates that the strength and concentration of the acid sites does not play a major role. Thus, in the absence of pore diffusion limitations, as it is the case for CBV 760, all Brønsted acid sites contribute equally to the overall reaction rate. This can be explained by the role of the acid site in the proposed reaction mechanism. The Brønsted acid site is only required for the activation of intermediates by protonation and the resulting weakening of the C–N bond. The protonation of the secondary amine function is readily achieved also by weak acid sites. Thus, the influence of the strength of Brønsted acid sites is to be expected to be very limited.
This reaction mechanism also provides an explanation for the formation of pMDA and MDA-PABA. pMDA is the product of the nucleophilic attack of a pre-formed 4,4′-MDA onto an “activated” PABA molecule, as illustrated in Scheme 7, and is a stable end product of the reaction. If the nucleophilic attack occurs not on the phenyl ring, but on the nitrogen itself, MDA-PABA is formed. It has been labeled MDA-PABA as it contains a methylene bridged biphenyl unit like MDA as well as the secondary amine motif from PABA. Because of this secondary amino function the molecule is still reactive and can be further converted to MDA and/or PABA (see Scheme 8).
 | ||
| Scheme 5 Reaction of the carbenium ion with aminal to form a highly reactive 3-ring aminal structure. | ||
 | ||
| Scheme 6 Proposed SN2-type reaction mechanism for the example of 4,4′-MDA formation from PABA. | ||
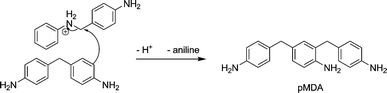 | ||
| Scheme 7 Formation of pMDA from 4,4′-MDA and PABA. | ||
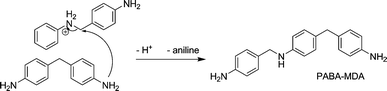 | ||
| Scheme 8 Formation of MDA-PABA from 4,4′-MDA and PABA. | ||
The experiments with different aminal concentrations show that only the yields of 2,4′-MDA and OABA are affected significantly by the aniline concentration. This is in agreement with the proposed reaction mechanism, which does not point to reactions between the activated species and aniline. MDA is formed from PABAvia a nucleophilic attack of PABA on a second (activated) PABA and is, therefore, second order for PABA. Aniline is a strong nucleophile and therefore should be attacked by the active species. However, aniline is significantly smaller than PABA and can realign itself to attack the electrophilic methylene-carbon with the free electron pair of the amino function, which is more nucleophilic than the phenyl ring system. Scheme 9 shows that the products of the reaction of PABA with aniline are again PABA and aniline and consequently no net reaction can be monitored.
 | ||
| Scheme 9 Reaction of PABA with aniline. | ||
The decomposition of OABA is so slow at 100 °C that the OABA is still present in the reaction mixture when all other reactive intermediates have already reacted. Therefore, the only remaining reaction partners for OABA are other OABA molecules, which are only present at very low concentrations. Thus, the possibility of the mutual reaction of two OABA molecules is negligible. Aniline, which is present abundantly, may react, but the reaction products will yield OABA and aniline. Only in the few cases when OABA is reacting with a carbon atom of the phenyl ring of aniline, 2,4′-MDA and aniline are formed. This model explains why (a) the decomposition of OABA is very slow, (b) the reaction order of the OABA decomposition seems to follow first order kinetics for OABA instead of second and c) only the OABA and 2,4′-MDA yields are affected by the aniline concentration.
The activation energies for PABA decomposition (69 kJ mol−1) and 4,4′-MDA formation (72 kJ mol−1) are in good agreement and further demonstrate that 4,4′-MDA is generated from PABA. The relatively high apparent activation energy of about 70 kJ mol−1 and the reaction order of two found with H-CBV 760 indicate that this step of the reaction network is limited by microkinetics and not by mass transport. Over H-BEA 25, the apparent activation energy for PABA decomposition was 37 kJ mol−1 and the reaction order was 1.5. The fact that only half the apparent activation energy and a reaction order of (n + 1)/2 = 1.5 were found for H-BEA suggests that the reaction is limited by mass transport over the BEA zeolite (see also ref. 3, 5). This hypothesis is further supported by the determined TOFs for H-BEA 25 and H-CBV 760. Also note that the TOF for the dealuminated Y-type sample is more than 20 times higher than that for H-BEA 25 despite the variation in the ion exchange degree (which also varies the acid site strength).
The reason for the different behavior is attributed to the different pore structures of H-CBV 760 and H-BEA 25. Nitrogen physisorption showed that parent H-BEA 25 has nearly no mesopore volume and, therefore, the active sites can only be reached through micropores. In contrast, H-CBV 760 has a significant mesopore volume (0.18 cm3 g−1). These mesopores provide better access to the near surface active acid sites minimizing the length of transport through the zeolite particles.
4.2 Simulation of the reaction network
The fact that the activated (bound to a Brønsted acid site) species will attack any available nucleophile results in a rather complex reaction network. In order to simplify this network for a simulation, only the eight major compounds of the reaction network are chosen for the calculation: the aminal (starting material), PABA, OABA, pPABA, MDA-PABA, 4,4′-MDA and pMDA. The 3-ring aminal species are not included in the model network because they are very short lived. Also 2,2′-MDA, N-methyl-MDA and a variety of structural motifs of pMDA, which can only be found in traces are neglected in modeling. Note, that the proposed reaction network, however, can explain their formation.The simplified reaction network with the eight included substances is shown in Scheme 10. The 15 separate reactions linking these eight substances can be described by a set of differential equations (see formulas 1–8 in the supplementary material†) for the rates of formation/consumption of each of the involved substances. Nonlinear parameter fitting of the differential equations 1–8 to the experimental data (as shown in Fig.1) was performed by using the CMA evolution strategy in Matlab.16 The root mean squared error normalized to the variance of the data (NRMS error) was used as the objective function to be minimized. To ensure that the globally optimal parameter set was found, each optimization run was repeated three times with varying parameter sets of the evolution strategy.
 | ||
| Scheme 10 Simplified reaction network. | ||
The resulting time concentration profiles for PABA, OABA, pPABA, 4,4′-MDA and MDA-PABA are shown in Fig. 5. The profiles for 2,4′-MDA and pMDA are omitted for reasons of legibility. However, their respective concentration profiles are of the same quality in comparison with the experimental data. The simulated time concentration profiles are in very good agreement with the experimental data.
 | ||
| Fig. 5 Simulated time concentration profile (full lines) of the synthesis of MDA from aminal over a dealuminated y-type zeolite (CBV 760); ▲ PABA, □ OABA, ◆ 4,4′-MDA, □ pPABA, △ MDA-PABA. | ||
Although a further refinement of the reaction network, involving more reaction intermediates (e.g. OABA-PABA), could provide even better fits, this course of action has not been pursued. The fact that our proposed reaction network is able to reproduce the measured time concentration profiles, as well as to explain the observed reaction orders and activation energies, is consistent with the proposed reaction network and the reaction mechanism for the synthesis of MDA over the applied dealuminated Y-type zeolite.
Conclusions
A detailed reaction network was developed based on a SN2-type reaction mechanism, describing the reaction with high accuracy. Comparing zeolite catalysts without mesopores (BEA type zeolite) and those with mesopores (dealuminated Y-type zeolite H-CBV 760), we showed that the first step of the reaction network, the decomposition of the aminal, is limited by pore diffusion in both zeolite systems. The subsequent rearrangement of the N-alkylbenzylaniline intermediates, however, is limited by pore diffusion over zeolites that do not have mesopores (BEA), while it is not affected by mass transport limitations over the mesoporous dealuminated Y-type zeolite. Note that we are reporting here on H-BEA, because its small crystals lead to significantly higher catalytic performance compared to the larger crystals of a parent H–Y catalyst. The presence of mesopores, such as those in H-CBV 760, drastically improves catalytic activity by reducing mass transport limitations.Detailed knowledge of the reaction network indicates that solid Brønsted acid catalysts with small crystal size and a pronounced mesoporosity offer ideal green catalytic routes for MDA synthesis. The solid acid helps avoid the use of HCl and the formation of stoichiometric amounts of NaCl in the process. A systematic study of the detailed role of the pore size, geometry and extend of mesoporosity is in progress.17
Acknowledgements
O. C. Gobin is gratefully acknowledged for performing the CMA evolution strategy calculations in Matlab. The authors are grateful to X. Hecht for BET measurements and M. Neukamm for SEM and AAS measurements. Financial and material support of the Dow Chemical Company are gratefully acknowledged. Furthermore the work at the Technische Universität München was funded by the DOW Chemical Company.References
- TDI/MDI; Chem Systems Report 98/99 S8; Process Evaluation/Research Planning Program, Chem Systems, San Francisco, 1999.
- A. de Angelis, P. Ingallina and C. Perego, Ind. Eng. Chem. Res., 2004, 43, 1169 CrossRef CAS.
- A. Corma, P. Botella and C. Mitchell, Chem. Commun., 2004, 2008 RSC.
- T. Kugita, S. Hirose and S. Namba, Catal. Today, 2006, 111, 275 CrossRef CAS.
- C. Perego, A. de Angelis, A. Carati, C. Flego, R. Villini, C. Rizzo and G. Bellussi, Appl. Catal., A, 2006, 307, 128 CrossRef CAS.
- P. Botella Asuncion, J. K. P. Bosman, A. Corma and C. J. Mitchell, US Pat. 7 238 840, 2007 Search PubMed.
- Y. Kiso, T. Toshihiro, T. Hayashi, EU Pat. 0 329 367, 1989 Search PubMed.
- C. Perego, A. de Angelis, O. Farias, A. Bosetti, EU Pat. 1 055 663, 2000 Search PubMed.
- B. C. Lippens, B. G. Linsen and J. H. de Boer, J. Catal., 1964, 3, 32 CrossRef CAS.
- G. Halsey, J. Chem. Phys., 1948, 16, 931 CrossRef CAS.
- E. P. Barret, L. G. Joyner and P. P. Halenda, J. Am. Chem. Soc., 1951, 73, 373 CrossRef.
- A. W. Hofmann and C. A. Martius, Ber., 1871, 4, 742 CrossRef.
- A. W. Hofmann, Ber., 1872, 5, 704 CrossRef.
- H. Hart and J. R. Kosak, J. Org. Chem., 1962, 27, 116 CAS.
- W. Song, J. B. Nicholas and J. F. Haw, J. Am. Chem. Soc., 2001, 123, 121–129 CrossRef CAS.
- N. Hansen, in: The CMA evolution strategy: a comparing review, Towards a new evolutionary computation. Advances on estimation of distribution algorithms, ed. J. A. Lozano, P. Larranaga, I. Inza, E. Bengoetxea, Springer, Berlin, 2006, vol. 192, pp. 75–102 Search PubMed.
- M. Salzinger, M. B. Fichtl, J. A. Lercher, unpublished work.
Footnote |
| † Electronic supplementary information (ESI) available: Differential equations describing the reaction network, measured and simulated time concentration profiles at 60 °C and 140 °C, parity plots. See DOI: 10.1039/c0gc00428f |
| This journal is © The Royal Society of Chemistry 2011 |