Identification of H2O2 as a major antimicrobial component in coffee
Ulla
Mueller
a,
Tanja
Sauer
a,
Ingrid
Weigel
a,
Rohtraud
Pichner
b and
Monika
Pischetsrieder
*a
aDepartment of Chemistry and Pharmacy, Food Chemistry, Emil Fischer Center, Friedrich-Alexander University Erlangen-NurembergE-mail: monika.pischetsrieder@lmchemie.uni-erlangen.de; Fax: +49-9131-8522587; Tel: +49-9131-8524102
bMax Rubner-Institut, Department of Microbiology and Biotechnology, Kulmbach
First published on 15th April 2011
Abstract
Coffee shows distinct antimicrobial activity against several bacterial genera. The present study investigated molecular mechanisms and active ingredients mediating the antimicrobial effect of coffee. Depending on concentration, roasted, but not raw coffee brew inhibited the growth of Escherichia coli and Listeria innocua. Several coffee ingredients with known antibacterial properties were tested for their contribution to the observed effect. In natural concentration, caffeine, ferulic acid and a mixture of all test compounds showed very weak, but significant activity, whereas trigonelline, 5-(hydroxymethyl)furfural, chlorogenic acid, nicotinic acid, caffeic acid, and methylglyoxal were not active. Antimicrobial activity, however, was completely abolished by addition of catalase indicating that H2O2 is a major antimicrobial coffee component. In accordance with this assumption, bacterial counts during 16 h of incubation were inversely related to the H2O2 concentration in the incubation solution. Pure H2O2 showed slightly weaker activity. The H2O2 dependent antimicrobial activity of coffee could be mimicked by a reaction mixture of D-ribose and L-lysine (30 min 120 °C) indicating that H2O2 is generated in the coffee brew by Maillard reaction products. Identification of H2O2 as major antimicrobial coffee component is important to evaluate the application of coffee or coffee extracts as natural preservatives.
Introduction
There is growing demand for convenience food products with long shelf life providing a high microbiological safety. Despite great advances in food technology, the use of food additives, mainly preservatives, is therefore still an important measure in food production.1 In the EU, about 15 preservatives in different chemical forms are currently legalized; most of them of artificial origin.2,3 However, because of safety concerns, many consumers are reluctant towards artificial food additives in general.4 Therefore, there is a growing demand to replace artificial preservatives by natural food ingredients with antimicrobial activity.Several studies have observed an antimicrobial activity of coffee5–10 suggesting that coffee or active ingredients thereof could be exploited as natural food preservatives. The antibacterial components of coffee and the mechanism of action have not been fully elucidated yet. Early studies show that antibacterial activity is limited to roasted coffee, whereas it is absent in raw coffee. Therefore, the activity was related to roasting products.5 In line with this assumption, antimicrobial effects of melanoidins isolated from coffee have been reported.6 Melanoidins are chemically heterogeneous polymers, which are formed, for example, from carbohydrates, proteins/amino acids and phenolic compounds during coffee roasting.11 On the other hand, bacteriostatic effects have been observed for natural components also present in green coffee, such as caffeic acid or trigonelline.12 Two recent studies deal with the mechanism of how the bacteriostatic properties of coffee melanoidins take effect: coffee melanoidins are able to permeabilize outer and inner membranes of the bacteria, thus probably interfering with biosynthetic processes.6Metal chelating properties were proposed as an important factor to mediate the antibacterial activity of melanoidins: melanoidins chelate iron, limiting the iron availability necessary for bacterial growth as well as Mg2+ from the outer membrane, which eventually leads to cell membrane disruption.13
In order to use coffee or coffee ingredients as natural preserving compounds in food production, it is important to know the components responsible for the observed antimicrobial activity. Therefore, the present study investigated mechanisms and ingredients responsible for the antibacterial effect of coffee by incubation tests for 16 h at 37 °C in culture medium inoculated with Escherichia (E.) coli or Listeria (L.) innocua.
Results
Antimicrobial activity of coffee
This study investigated the concentration dependent activity of coffee solutions to inhibit the growth of E. coli and L. innocua during 16 h of incubation. Fig. 1 shows the results of the growth experiments. Bacteria incubated with water as control grew to a bacterial count of 2 × 10⁹ colony forming units (cfu)/mL. In the presence of coffee, bacterial growth depended on the coffee concentration and the bacterial strain. At low coffee concentrations (1.3 and 2.5 g dry matter (dm)/L), the growth of E. coli did not statistically differ from the control, while a significantly lower final bacterial concentration of 20 cfu/mL was determined in the presence of 4.4 g coffee dm/L. In the presence of coffee in the highest tested concentration (6.3 g dm/L), no colony growth was detected even after enrichment. Without inhibitor, the bacterial count of L. innocua amounted to 1 × 10⁹ cfu/mL. In contrast to the experiments with E. coli, already the lowest coffee concentration significantly reduced the number of bacteria compared to control. An increase in the coffee concentration diminished further bacterial growth. At the highest tested coffee concentration, 1 × 10³ cfu/mL were determined after the incubation period. In contrast to E. coli, which was completely growth inhibited by the highest coffee concentration, the counts of L. innocua had decreased under these conditions, but growth was not completely suppressed.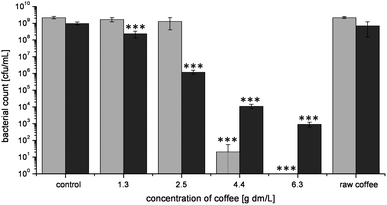 | ||
| Fig. 1 Concentration dependent effect of raw coffee and roasted coffee on bacterial growth of E. coli (gray) and L. innocua (black) after 16 h of incubation at 37 °C. Values represent means ± SD of three independent experiments; ***p < 0.001, significant differences are related to the control (PBS) with the respective bacterium. | ||
Raw coffee, which was applied in a concentration of 6.3 g dm/L, had no effect on the bacterial growth. E. coli as well as L. innocua grew uninhibitedly to a final bacterial count of 2 × 10⁹ cfu/mL and 7 × 10⁸ cfu/mL, respectively.
In order to model the ability of coffee for food preservation, an initial bacterial number of 102 cfu/mL was used in these experiments. In the EU, for example, bacterial counts in diverse food products must not exceed 102 cfu/g Listeria, whereas threshold values between 100 and 103 cfu/g are defined for E. coli.14 In some experiments, however, higher initial bacterial numbers (105 cfu/mL) were also applied leading to similar results (Fig. 7B).
Identification of antibacterial coffee components
To identify active coffee components that affected bacterial growth, eight coffee ingredients were tested, for which antimicrobial activity had been described before. Trigonelline, caffeine, 5-(hydroxymethyl)furfural (HMF), ferulic acid, chlorogenic acid, nicotinic acid, caffeic acid, methylglyoxal and a mixture of these ingredients were analyzed for their activity to inhibit the growth of E. coli (Fig. 2). The single coffee components were applied in concentrations as expected in the most concentrated coffee test solution.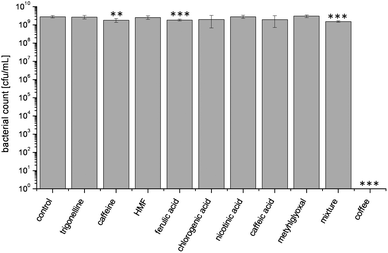 | ||
| Fig. 2 Effect of different coffee ingredients compared with the effect of roasted coffee on bacterial growth of E. coli after 16 h of incubation at 37 °C. Coffee ingredients were applied in the concentration present in the coffee sample. Values represent means ± SD of three independent experiments; **p < 0.01 and ***p < 0.001, significant differences are related to the control. | ||
Negative control led to a final bacterial count of 3 × 10⁹ cfu/mL. The most concentrated coffee solution as positive control resulted in a complete growth inhibition. Bacterial counts after incubation with trigonelline, HMF, chlorogenic acid, nicotinic acid, caffeic acid, and methylglyoxal did not differ statistically from the negative control, whereas caffeine (p < 0.01) and ferulic acid (p < 0.001) caused a very small, but significant decrease of the bacterial count compared to control. In order to account for symbiotic effects, a mixture of all these coffee ingredients was analyzed for antimicrobial activity. Again, the final bacterial count was significantly lower than in the negative control, but still reached 1 × 10⁹ cfu/mL. The corresponding coffee solution, however, led to complete growth suppression of E. coli. Thus, it was concluded that the tested natural coffee components could not explain the observed antimicrobial effect.
It has been shown before that coffee brew contains considerable amounts of H2O2.15–19 As the antimicrobial effect of H2O2 is well established,1 the contribution of H2O2 to the growth inhibiting activity of coffee was tested. For this purpose, coffee was added to the E. coli suspensions together with catalase, which selectively decomposes H2O2 to water and oxygen. The presence of catalase completely abolished the growth inhibiting activity of coffee (Fig. 3). The final bacteria concentration in all incubation solutions with catalase amounted to 2 × 10⁹ cfu/mL, independently from the applied coffee concentration. The addition of heat inactivated catalase, however, did not influence the growth inhibitory activity of coffee indicating that the observed effect is indeed caused by the catalytic activity of catalase. In a similar way, catalase abolished the activity of coffee to inhibit growth of L. innocua (data not shown).
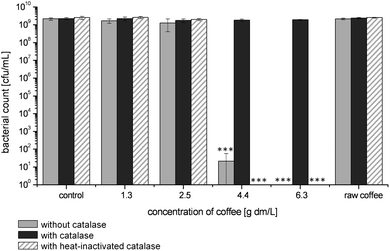 | ||
| Fig. 3 Effect of raw coffee and roasted coffee in different concentration on bacterial growth of E. coli after 16 h of incubation at 37 °C without catalase, with catalase and with heat-inactivated catalase. Values represent means ± SD of three independent experiments; ***p < 0.001, significant differences are related to the respective incubation with catalase. | ||
Correlation between H2O2 concentration and antimicrobial activity
To further elucidate the role of H2O2 in the antimicrobial effect of coffee, the bacterial count (Fig. 4A) and H2O2 concentration (Fig. 4B) in the incubation mixtures were measured simultaneously. For this purpose, inoculated suspensions of E. coli were incubated for 16 h at 37 °C and samples were taken every two hours. In each sample, the H2O2 concentration and the bacterial count were determined. In the negative control, H2O2 was never detected, whereas the bacterial count increased from 2 × 10² cfu/mL at 0 h to 1 × 10⁹ cfu/mL at 10 h and remained constant at this level for the residual incubation period. Using 1.3 or 2.5 g coffee dm/L, the bacterial growth was delayed, but reached the same level as in control after 16 h. Consistent with this finding, H2O2 concentrations increased within the first 4 or 6 h, respectively, but decreased afterwards until no more H2O2 could be measured after 8 h or 14 h, respectively. The bacterial count after incubation with 4.4 g coffee dm/L did not increase during the entire incubation period of 16 h and a concurrent gradual increase of H2O2 concentration was observed in the suspensions. The addition of 6.3 g coffee dm/L caused a constant decrease in bacterial count, until no colony growth was detectable after 8 h, with a continuously increasing H2O2 concentration at the same time. Thus, the inhibition of bacterial growth was clearly related to the actual H2O2 concentration.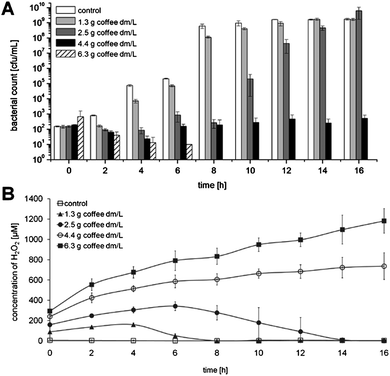 | ||
| Fig. 4 Comparison of bacterial growth of E. coli and H2O2 concentration in the incubation solution during 16 h of incubation with different concentrations of roasted coffee at 37 °C. (A) Time-dependent bacterial counts at the different coffee concentrations: control without coffee, 1.3 g dm/L, 2.5 g dm/L, 4.4 g dm/L, and 6.3 g dm/L, (B) Time-dependent concentration of H2O2 in the incubation solution with different coffee content. Values represent means ± SD of three independent experiments. | ||
Antimicrobial activity of H2O2
Since H2O2 proved to be a key player for the antibacterial activity of coffee, the growth inhibitory activity of pure H2O2 was compared with the effect of H2O2 from coffee (Fig. 5). Consistent with previous experiments, the negative control in PBS led to the formation of 3 × 10⁹ cfu/mL after 16 h of incubation. The three lowest concentrations of H2O2 (100 μM, 200 μM, and 500 μM) brought about the same level of bacterial count as the control. A concentration of 1000 μM resulted in a final bacterial count of 8 × 10³ cfu/mL, which was significantly (p < 0.001) lower than control. After incubation with 2000 μM H2O2 for 16 h, no cfu were detectable any more after plating the solutions onto ECD agar.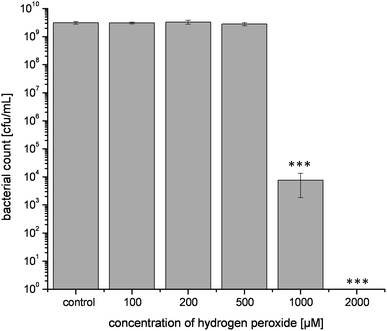 | ||
| Fig. 5 Effect of different H2O2 concentrations on bacterial growth of E. coli during 16 h of incubation at 37 °C. Values represent means ± SD of three independent experiments; ***p < 0.001, significant differences are related to the control. | ||
Generation of H2O2 in a coffee solution
Fig. 6 shows the H2O2 generation during 16 h without the addition of bacteria. The concentration of H2O2 increased continuously with time and coffee content. The H2O2 concentration in the control and in coffee samples with 4.4 and 6.3 g dm/L was similar to the concentration formed in the presence of bacteria (Fig. 4B). In contrast to the experiments in the presence of bacteria, H2O2 concentration in the uncontaminated coffee samples with 1.3 and 2.5 g dm/L gradually increased during the entire incubation period.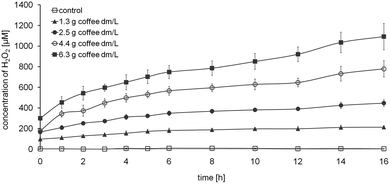 | ||
| Fig. 6 Time dependent formation of H2O2 from different concentrations of roasted coffee in the absence of bacteria. Values represent means ± SD of three independent experiments. | ||
Antimicrobial activity of Maillard products
The last part of the study investigated which components could be responsible for H2O2 generation in the coffee beverage and thus for its antimicrobial effect. Roasted coffee showed antibacterial activity, whereas incubation with raw coffee or natural coffee ingredients did not considerably influence bacterial growth. These results indicate that the active components, which are able to generate H2O2 in the coffee brew, are formed during the roasting process. Since it is difficult to isolate chemically defined roasting products from coffee, Maillard reaction products (MRP), which are formed in high yields during roasting, were prepared by model reactions. The antibacterial activity of Maillard products obtained by heating a mixture of ribose and lysine was then analyzed in the test systems. PBS, as well as separately heated ribose or lysine served as control. In addition, an unheated model Maillard model reaction mixture (MRM) was prepared for control purposes. As the Maillard reaction proceeded considerably under the incubation conditions of the antibacterial assay (37 °C, 16 h), the unheated MRM, however, could not be used as valid control. Moreover, MRPs were also prepared by dry heating of equimolar amounts of ribose and lysine and subsequent preparation of an aqueous solution, mimicking MRP formation during coffee roasting and H2O2 generation in the coffee brew. Solutions of drily heated MRP also showed a concentration dependent generation of H2O2 (e.g. MRPs heated for 15 min at 120 °C contained up to 73.3 ± 21.8 μM H2O2 at t = 0 min). However, since dry heating cannot be carried out as uniformly as heating in solution leading to higher standard deviations, the following experiments were carried out with MRPs prepared in solution.The results of the antibacterial assay are shown in Fig. 7. Similar to the previous experiments, the final bacterial count of the PBS control amounted to 2 × 10⁹ cfu/mL. The count of E. coli after incubation with a 10 mM MRM (concentration is equivalent to the educts before heating) did not differ statistically from the control. A concentration of 25 mM led to a significantly lower bacterial count, but still resulted in 1 × 10⁹ cfu/mL. In the incubation solution with 50 mM MRM only few bacteria were detectable and in the incubation solution with 100 mM MRM no colony growth was found even after enrichment. The heated lysine control resulted in a final bacterial count which did not differ significantly from the PBS control, whereas the heated ribose control caused a significant increase (p < 0.001) in bacterial density.
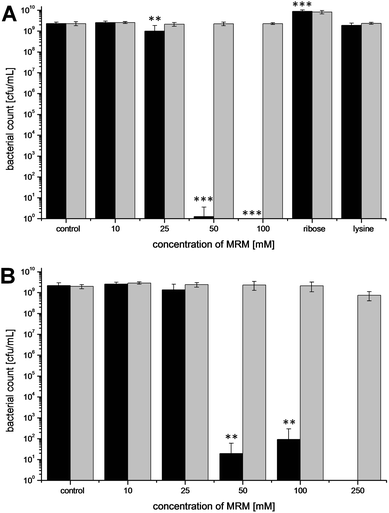 | ||
| Fig. 7 Effect of different concentrations of a heated MRM (formed from equimolar ratios of lysine and ribose in PBS as indicated by heating at 120 °C for 30 min) and separately heated lysine- and ribose solutions on bacterial growth of E. coli after 16 h of incubation at 37 °C with addition of catalase (grey) and without catalase (black). Experiments were carried out with an initial bacterial count of 102 cfu/mL (A) or 105 cfu/mL (B). Values represent means ± SD of three independent experiments; **p < 0.01 and ***p < 0.001, significant differences are related to the control. | ||
Similar to the experiments with coffee, the addition of catalase completely inhibited the antibacterial effects of the MRM. Final bacterial counts amounted to 2 × 10⁹ cfu/mL independent from the applied MRM concentration.
Discussion
The present study investigated mechanisms and ingredients responsible for the antibacterial effect of coffee. In order to test the antibacterial activity, different coffee concentrations were incubated for 16 h at 37 °C in culture medium inoculated with E. coli or L. innocua.E. coli is a representative of the family of Enterobactericeae and one of the predominant facultative anaerobic bacteria in the intestinal tract. It is therefore used as indicator organism for the fecal content of water and food. The nonpathogenic species L. innocua is present in food and is closest to the pathogenic species L. monocytogenes.20 Our study used L. innocua as a representative for Listeria spp.21Listeria can survive under many extreme conditions, such as high salt concentrations, high pH, and at low/high temperature. Listeria spp. also form very persistent biofilms, which allow them to attach to solid surfaces and proliferate. Therefore, Listeria show a high survival rate during food processing and in industrial food production.
Under the tested conditions, coffee brew exerted a strong, concentration dependent antibacterial effect against E. coli and L. innocua. The antibacterial activity of coffee has been demonstrated before against various strains, such as Staphylococcus, Streptococcus, E. coli, Bacillus, Enterobacteria, or Legionella species.5,7,9,22 An antibacterial effect against Listeria has not been reported before. The active ingredients or the antibacterial mechanism of coffee are not fully elucidated yet. Daglia et al. suggested that roasting products, such as MRP are responsible for the effect, since the antibacterial activity increased with advanced roasting degree of coffee and since green coffee did not show any effects.5 Furthermore, an inverse relation was determined between the concentration of trigonelline, nicotinic acid, 5-caffeoylquinic acid, and caffeine and the antibacterial activity of the coffee samples.23 The concentration of these components is influenced by the roasting process. However, it was assumed that these components do not have a direct influence on the antibacterial activity, but rather act as indicators for the roasting degree. When analyzing a tenfold concentrated coffee solution, the contribution of glyoxal, methylglyoxal, and diacetyl to the antibacterial effect of the concentrated coffee solution was determined. Although not active by itself, caffeine increased the effect of the dicarbonyl compounds.9 When applied at 2 mg mL−1, the antibacterial activity of the coffee components chlorogenic acid, protocatechuic acid, caffeic acid, caffeine, and trigonelline against Enterobacteriaceae was detected by the disc diffusion method.7 At 0.8 mg mL−1, a bacteriostatic activity of trigonelline, chlorogenic acid, and caffeic acid against Streptococcus mutans was determined.12
The present study clearly confirmed the absence of any antibacterial activity in green coffee extracts corroborating the hypothesis that the active components are not natural ingredients, but are generated during the roasting process. Additionally, eight major primary and secondary components of roasted coffee, for which an antibacterial activity had been reported before, were investigated in concentrations as present in the most concentrated tested coffee sample. Whereas coffee itself totally inhibited the growth of E. coli in the test systems, only caffeine and ferulic acid showed a very slight, but significant inhibitory effect. Contrary to previous reports, no synergistic effects could be observed when a mixture of the tested compounds was used. Thus, it was concluded that the previously identified antibacterial coffee components could only explain a minute portion of the antibacterial activity of coffee detected in our test system.
Another bioactive component of coffee is H2O2.17 Between 20 and 100 μM H2O2 was measured in different coffee beverages.15–18 These concentrations are sufficient to exert cytotoxicity and to induce the nuclear translocation of transcription factor NF-κB in cultured mammalian cells.15,16 Additionally, H2O2 has been related to the mutagenic effect of coffee.24
The antibacterial effect of H2O2 is well described in literature and appropriate mechanisms have been established.25 In the present study, addition of catalase completely inhibited the antibacterial effects of coffee. Thus, it can be concluded that the antimicrobial activity of coffee fully depends on the presence of H2O2. This conclusion is supported by the well-fitting inverse relation between H2O2 concentration detected during the incubation period of 16 h in the E. coli suspensions and the corresponding bacterial counts. The H2O2 concentration at t = 0 depended on the coffee concentration. Whereas 6.3 g coffee dm/L resulted in 1180 μM H2O2, its concentration was below the detection limit when 1.3 g coffee dm/L was applied. The lowest initial H2O2 concentration was not effective in reducing cell growth, because E. coli and L. innocua both contain catalase that can detoxify the incubation solution by decomposing H2O2. A coffee concentration of 2.5 g dm/L, which corresponds to an initial concentration of 160 μM H2O2, already led to a considerable growth retardation for up to 12 h. After 14 h, however, H2O2 was completely degraded leading to the maximal number of cfu/mL after 16 h of incubation. At the two highest coffee concentrations, the antimicrobial effect of H2O2 overcompensated the detoxifying activity of the bacteria. A concentration of 4.4 g coffee dm/L led to complete growth inhibition over the entire incubation time, 6.3 g coffee dm/L exerted a complete bacteriocidic effect. The counteraction of constant H2O2 generation by the coffee brew and H2O2 degradation by bacterial catalase could be depicted when the development of H2O2 concentration during the incubation period was measured in the presence and absence of bacteria. Without bacteria the H2O2 concentration constantly increased during the entire incubation period, depending on the coffee concentration. In the presence of bacteria, H2O2 could be eventually degraded at the two lower coffee concentrations, accompanied by bacterial growth. At the highest coffee concentration, the H2O2 concentration was hardly influenced by bacterial catalase, leading to a complete cell death. Therefore, it can be concluded that coffee must be applied in sufficient concentration to overcompensate bacterial catalase activity and thus generate antibacterial effects. Further studies are required to investigate how components of different food matrices, such as particulate material, may influence the antimicrobial activity of H2O2.
For further investigation of the antimicrobial mechanisms of coffee brews, the corresponding experiments were performed with pure H2O2. Thus, the antimicrobial activity of H2O2 could be confirmed. A concentration of 1000 μM H2O2 was required, however, to reduce bacterial growth under the applied conditions, whereas a complete bacteriocidic effect was only caused by 2000 μM H2O2. In comparison, 290 μM H2O2 had been initially measured in the most concentrated coffee solution and the value had further increased to 830 μM after 8 h, when a complete bacteriocidic effect was recorded. In all coffee incubation mixtures, the H2O2 concentration ranged below 1200 μM.
These results support the conclusion that H2O2 is a major antimicrobial component of coffee under the applied conditions. The higher activity of H2O2 generated from coffee compared with pure H2O2 can have several reasons. Pure H2O2 was added in the indicated concentration at the beginning of the incubation period so that chemical and enzymatic degradation led to a decrease of the H2O2 concentration during incubation. In contrast, H2O2 generating components are present in the coffee solutions and constantly develop fresh H2O2. Thus, freshly produced H2O2 may exert stronger activity or the constant production may lead to an actually higher concentration in the coffee incubation mixtures over time than in the solutions with pure H2O2. Alternatively, synergistic effects between the antimicrobial activity of H2O2 and other antimicrobial effects of coffee components may exist. Rufian-Henares et al., for instance, revealed that coffee melanoidins show antimicrobial activity, which was attributed to their metal chelating properties.6,13 Melanoidins can form complexes with Mg2+, for example, leading to a destabilization of the outer membrane. Moreover, melanoidins can chelate iron and siderophore-Fe3+ complexes and thus decrease the iron bioavailability for the bacteria. Additionally, the present study also observed weak, but significant antimicrobial activity for caffeine or ferulic acid, which may have synergistic effects with H2O2. The complete inhibition of coffee's antibacterial activity by catalase indicates that the H2O2 generation is a prerequisite for its activity. However, other mechanisms and components may synergistically increase the antibacterial activity of H2O2 generated in coffee.
The last part of the study investigated which coffee components may be able to generate antibacterial concentrations of H2O2. Solutions of roasted coffee could inhibit bacterial growth dependent on their concentration, whereas raw coffee solution showed no inhibitory activity indicating that the effective H2O2-generating agents were produced during the roasting process. Several chemical changes during the roasting process are known. The contents of nicotinic acid and caffeic acid increase, for example, whereas the concentration of chlorogenic acid, trigonelline, and caffeine decreases with prolonged roasting time and advanced roasting degree.12 In our study, however, nicotinic acid and caffeic acid, which are formed during roasting, were not associated with any antimicrobial activity. Another important reaction that proceeds during roasting is the Maillard reaction between reducing sugars and amino acids/peptides. A contribution of MRP to the H2O2 mediated antimicrobial effect of coffee is likely. It has been shown that MRP inhibit the growth and metabolism of bacteria and yeast.26–29 Furthermore, it is known that MRP are able to generate H2O2.15,16,30 Particularly MRP with aminoreductone structure seem to be potent generators of H2O2, for which antimicrobial activity was also reported.10,31
In the present study, MRP were generated in a model reaction by heating lysine with ribose in order to exclude any effects from other coffee components. Under the applied assay conditions, MRP inhibited bacterial growth to a similar extent as coffee. In order to relate the effect clearly to MRP, heated solutions of ribose or lysine were tested in the same way. Whereas the heated lysine solution did not have any influence, heated ribose increased bacterial growth, which can be explained by the additional supply of unreacted ribose. Thus, the antibacterial effect of the MRM can be clearly attributed to the Maillard reaction between the sugar and the amino acid. Similar to the experiments with coffee, antimicrobial activity of MRM was completely inhibited in the presence of catalase (Fig. 7). These results suggest that H2O2 in coffee brews is generated by roasting products formed from sugars and amino acids or peptides.
Experimental
Chemicals
All chemicals were of analytical reagent grade quality. D-Ribose, L-lysine hydrochloride, xylenol orange, ammonium iron(II) sulfate hexahydrate, trigonelline, caffeine, HMF, ferulic acid, methylglyoxal, and catalase (from bovine liver) were purchased from Fluka (Buchs, Switzerland). H2O2 30%, nicotinic acid, perchloric acid (PCA), standard I nutrition agar, ECD agar, Palcam agar, buffered peptone broth and standard I nutrition broth were obtained from Merck (Darmstadt, Germany). Xylenol orange sodium salt was from Acros Organics (New Jersey, USA). Chlorogenic acid and caffeic acid were purchased from Cayman Chemical Company (Michigan, USA). Roasted and raw coffee beans (both 100% Coffee arabica beans) were purchased from a local coffee roaster. Filter bags and coffee filter were obtained from Melitta (Minden, Germany).Preparation of coffee extracts
Coffee extracts were prepared according to Hegele et al.15 with some modifications. A quantity of 3.75 g ground roasted or raw coffee was weighed in a coffee filter and brewed with 60 mL (roasted coffee) or 70 mL (raw coffee) boiling tap water (100 °C). The extract was collected and cooled to 25 °C. After pH adjustment to 5.5 with 2 N NaOH or 2 N HCl, the extract was diluted with water to a total volume of 50 mL. Subsequently the coffee extract was filter sterilized (sterile syringe filter, 0.22 μm, PVDF, Carl Roth, Karlsruhe, Germany) and used for further experiments exactly 1 h after brewing. Additionally, three aliquots of each coffee brew were lyophilized to determine its dm, which was in average 12.6 g dm/L corresponding to a typical German coffee beverage.Preparation of MRM
MRM were prepared according to Muscat et al.16 with slight modifications. Briefly, equimolar concentrations of D-ribose and L-lysine (500 mM each) were dissolved in PBS, pH was adjusted to 9.4 by adding conc. HCl or conc. KOH, and the solution was heated for 30 min at 120 °C. After cooling the mixture to 25 °C, the pH was adjusted to 8.0 with conc. HCl or conc. KOH. As negative control, D-ribose and L-lysine were heated separately under the same conditions. Subsequently, the solutions were filter sterilized and stored at −20 °C until use.Additionally, MRM were prepared by dry heating of equimolar amounts of D-ribose (500 mg) and L-lysine (483 mg) for 0, 7.5, 15, and 30 min at 120 °C. After cooling on ice, the solid was dissolved with PBS to a final concentration of 167 mM (related to the initial concentration of the reactants), filtered and stored at −20 °C. Prior to H2O2 analysis, MRPs were dissolved in 12 different concentrations between 1 mM and 167 mM.
Bacterial strains and culture conditions
The study tested the food hygiene-relevant bacteria Listeria (L.) innocua (SLCC 3423, gram-positive) and Escherichia (E.) coli (E163, gram-negative, Max Rubner Institute, Department of Microbiology and Biotechnology, Kulmbach, Germany). Both bacterial species are catalase-positive. L. innocua was aerobically cultivated in standard I nutrition broth for 16 h at 37 °C and subsequently plated on Palcam agar (aerobic, 18–22 h, 37 °C),32 whereas E. coli was maintained in buffered peptone water (aerobic, 16 h, 37 °C) and plated on standard I nutrition agar (16–18 h, 37 °C), respectively ECD agar (16–18 h, 37 °C). All bacterial dilutions were made with a sterile 0.85% NaCl solution.Assay for antimicrobial activity
The antimicrobial effect of MRM, coffee and coffee ingredients was determined following Einarsson et al.26 with some modifications. MRM were diluted in PBS to reach different concentrations (20 mM, 50 mM, 100 mM, and 200 mM; concentrations referring to the educts originally present in the solutions). Furthermore, different volumes of the coffee brew were mixed with water resulting in a final concentration of 2.6, 5.0, 8.8, and 12.6 g dm/L roasted coffee or 17.6 g dm/L raw coffee. Five millilitres of MRM or coffee dilution was incubated with 1 mL of a freshly diluted overnight bacterial culture (103 cfu/mL) and 4 mL of concentrated nutrition broth. The incubation solutions containing 100 cfu/mL and MRM (final concentration 10 mM, 25 mM, 50 mM, and 100 mM) or coffee solution (final concentration 1.3, 2.5, 4.4, and 6.3 g dm/L roasted coffee or 8.8 g dm/L raw coffee) were incubated aerobically for 16 h at 37 °C under agitation. Subsequently bacteria growth was assayed by plating appropriate dilutions, incubating the plates (for E. coli: ECD agar, 16–18 h and for L. innocua: Palcam agar, 18–22 h) at 37 °C and counting the number of cfu per millilitre.32 If no colony growth was detected, the incubated solution was enriched (overnight incubation of a 1![[thin space (1/6-em)]](https://www.rsc.org/images/entities/char_2009.gif) :
:![[thin space (1/6-em)]](https://www.rsc.org/images/entities/char_2009.gif) 10 dilution in nutrition broth at 37 °C under agitation) and tested for bacteria growth as described above.
10 dilution in nutrition broth at 37 °C under agitation) and tested for bacteria growth as described above.
The identity of the enriched bacteria was verified by plating the suspension on a selective agar (ECD agar for E. coli and Palcam agar for L. innocua) and examining the grown colonies. PBS or water instead of MRM or coffee solution served as negative control, heated lysine or ribose solutions served as additional controls for the MRM. Dilutions of a H2O2 stock solution (with double distilled water) with a final concentration of 100 μM, 200 μM, 500 μM, 1000 μM, and 2000 μM were analyzed as positive control.
To test the antibacterial activity of natural coffee ingredients, trigonelline (0.4 mg mL−1), caffeine (0.45 mg mL−1), HMF (0.025 mg mL−1), ferulic acid (0.5 mg mL−1), chlorogenic acid (0.5 mg mL−1), nicotinic acid (0.04 mg mL−1), caffeic acid (0.5 mg mL−1), and methylglyoxal (0.005 mg mL−1) were used in concentrations as expected in the most concentrated coffee test solution.5,7,12,23,33 When a concentration span had been reported in literature, the highest possible concentration was used.
Each assay was repeated in the presence of catalase. For this purpose, 100 μL of the water in the incubation solution was replaced by 100 μL of a catalase-solution (13700 U/mL). In some experiments, catalase was heat inactivated for 5 min at 95 °C before use.
Ferrous oxidation xylenol orange (FOX)-assay
H2O2 concentration during bacterial growth was determined by FOX-assay according to Gay et al.,34 which was modified as described previously.15 After 0 h and 16 h of bacterial growth (for some tests additionally after 1 h, 2 h, 3 h, 4 h, 5 h, 6 h, 8 h, 10 h, 12 h, and 14 h), an aliquot of 200 μL was taken from the incubated solution. Sixty microlitres of the sample was mixed with either 20 μL water or catalase solution (680 U/mL). Both solutions were allowed to rest for 15 min at room temperature. Afterwards, 20 μL of each solution was mixed with 180 μL PCA-FOX reagent (0.45 mM xylenol orange, 0.45 mM Fe(NH4)(SO4)2 in 0.11 M HClO4) in a 96-well plate. The absorbance was read at 550 nm after 30 min. In order to confirm that the observed absorption was generated by H2O2, the values of the corresponding solutions with catalase were subtracted from the absorption of the catalase-free solution. H2O2 content was calculated with an external calibration curve. The concentration of the H2O2 stock solution was determined by UV-spectroscopy, using the molar extinction coefficient (0.0394 cm2 μmol−1) at 240 nm.35H2O2 formation was analyzed accordingly in solutions of coffee and MRM incubated with 0.85% NaCl solution instead of the bacterial suspension for the indicated time periods.
Statistical analysis
Numeric data are expressed as means ± SD. The statistical significance of differences in individual mean values was calculated using the unpaired, two-tailed Student's t-test with significance levels *p < 0.05, **p < 0.01, and ***p < 0.001. Homogeneity of variance was tested with the F-test (ANOVA, confidence interval at 95%). All experiments were performed at least in three independent repetitions. Microsoft Excel 2007 and Origin 7.5G were applied for statistical parameters.Conclusion
The present study demonstrates that the presence of H2O2 is a necessary prerequisite for the antimicrobial effect of coffee. Most likely, H2O2 is generated in the coffee brews by MRP formed during coffee roasting from sugars and amino acids/peptides. Identification of H2O2 as a major antimicrobial component of coffee is important to evaluate the application of coffee or coffee extracts, for example, as natural components to increase the microbiological stability of food products.Abbreviations
| cfu | colony forming units |
| dm | dry matter |
| FOX | ferrous oxidation in xylenol orange |
| HMF | 5-(hydroxymethyl)furfural |
| MRM | Maillard model reaction mixtures |
| MRP | Maillard reaction products |
| PCA | perchloric acid |
Acknowledgements
The financial support of the project by the Cofresco Institute is gratefully acknowledged.References
- S. Brul and P. Coote, Int. J. Food Microbiol., 1999, 50, 1–17 CrossRef CAS.
- European Parliament and Council, Regulation (EC) No. 1333/2008 on food additives of 16 Dec 2008.
- European Parliament and Council, Directive No. 95/2/EC.
- G. W. Gould, Br. Med. Bull., 2000, 56, 84–96 Search PubMed.
- M. Daglia, M. T. Cuzzoni and C. Dacarro, J. Agric. Food Chem., 1994, 42, 2270–2272 CrossRef CAS.
- J. A. Rufian-Henares and F. J. Morales, J. Agric. Food Chem., 2008, 56, 2357–2362 CrossRef.
- A. A. Almeida, A. Farah, D. A. Silva, E. A. Nunan and M. B. Gloria, J. Agric. Food Chem., 2006, 54, 8738–8743 CrossRef CAS.
- B. K. Tiwari, V. P. Valdramidis, C. P. O'Donnell, K. Muthukumarappan, P. Bourke and P. J. Cullen, J. Agric. Food Chem., 2009, 57, 5987–6000 CrossRef CAS.
- M. Daglia, A. Papetti, P. Grisoli, C. Aceti, V. Spini, C. Dacarro and G. Gazzani, J. Agric. Food Chem., 2007, 55, 10208–10213 CrossRef CAS.
- V. T. Trang, H. Takeuchi, H. Kudo, A. Aoki, S. Katsuno, T. Shimamura, T. Sugiura and H. Ukeda, J. Agric. Food Chem., 2009, 57, 11343–11348 CrossRef CAS.
- E. K. Bekedam, M. J. Loots, H. A. Schols, M. A. Van Boekel and G. Smit, J. Agric. Food Chem., 2008, 56, 7138–7145 CrossRef CAS.
- A. G. Antonio, R. S. Moraes, D. Perrone, L. C. Maia, K. R. N. Santos, N. L. P. Iorio and A. Farah, Food Chem., 2010, 118, 782–788 CrossRef CAS.
- J. A. Rufian-Henares and S. P. de la Cueva, J. Agric. Food Chem., 2009, 57, 432–438 CrossRef CAS.
- European Commission, Regulation (EC) 2073/2005 of 15 Nov 2005 on microbiological criteria for foodstuffs.
- J. Hegele, G. Munch and M. Pischetsrieder, Mol. Nutr. Food Res., 2009, 53, 760–769 CrossRef CAS.
- S. Muscat, J. Pelka, J. Hegele, B. Weigle, G. Munch and M. Pischetsrieder, Mol. Nutr. Food Res., 2007, 51, 525–535 CrossRef CAS.
- M. Akagawa, T. Shigemitsu and K. Suyama, Biosci., Biotechnol., Biochem., 2003, 67, 2632–2640 CrossRef CAS.
- L. H. Long, A. N. Lan, F. T. Hsuan and B. Halliwell, Free Radical Res., 1999, 31, 67–71 CrossRef CAS.
- K. Hiramoto, T. Kida and K. Kikugawa, Biol. Pharm. Bull., 2002, 25, 1467–1471 CrossRef CAS.
- http://www.ebi.ac.uk/2can/genomes/bacteria/Listeria_innocua.html .
- P. Glaser, L. Frangeul, C. Buchrieser, C. Rusniok, A. Amend, F. Baquero, P. Berche, H. Bloecker, P. Brandt, T. Chakraborty, A. Charbit, F. Chetouani, E. Couve, A. de Daruvar, P. Dehoux, E. Domann, G. Dominguez-Bernal, E. Duchaud, L. Durant, O. Dussurget, K. D. Entian, H. Fsihi, F. Garcia-del Portillo, P. Garrido, L. Gautier, W. Goebel, N. Gomez-Lopez, T. Hain, J. Hauf, D. Jackson, L. M. Jones, U. Kaerst, J. Kreft, M. Kuhn, F. Kunst, G. Kurapkat, E. Madueno, A. Maitournam, J. M. Vicente, E. Ng, H. Nedjari, G. Nordsiek, S. Novella, B. de Pablos, J. C. Perez-Diaz, R. Purcell, B. Remmel, M. Rose, T. Schlueter, N. Simoes, A. Tierrez, J. A. Vazquez-Boland, H. Voss, J. Wehland and P. Cossart, Science, 2001, 294, 849–852 CrossRef CAS.
- C. Dogasaki, T. Shindo, K. Furuhata and M. Fukuyama, Yakugaku Zasshi, 2002, 122, 487–494 CrossRef CAS.
- M. Daglia, M. T. Cuzzoni and C. Dacarro, J. Agric. Food Chem., 1994, 42, 2273–2277 CrossRef CAS.
- Y. Fujita, K. Wakabayashi, M. Nagao and T. Sugimura, Mutat. Res. Lett., 1985, 144, 227–230 Search PubMed.
- B. J. Juven and M. D. Pierson, J. Food Prot., 1996, 59, 1233–1241 CAS.
- H. Einarsson, B. G. Snygg and C. Eriksson, J. Agric. Food Chem., 1983, 31, 1043–1047 CrossRef CAS.
- A. Tauer, S. Elss, M. Frischmann, P. Tellez and M. Pischetsrieder, J. Agric. Food Chem., 2004, 52, 2042–2046 CrossRef.
- J. A. Rufian-Henares and F. J. Morales, J. Food Qual., 2007, 30, 160–168 CrossRef CAS.
- M. L. Stecchini, P. Giavedoni, L. Sarais and C. R. Lerici, Lett. Appl. Microbiol., 1991, 13, 93–96 CrossRef.
- Z. Y. Jiang, A. C. Woollard and S. P. Wolff, FEBS Lett., 1990, 268, 69–71 CrossRef CAS.
- A. Wuhr, M. Deckert and M. Pischetsrieder, Mol. Nutr. Food Res., 2010, 54, 1021–1030 CrossRef.
- J. B. Baumgart and R. Stephan, Markerorganismen, Behr's Verlag, Hamburg, 2010 Search PubMed.
- M. Daglia, R. Tarsi, A. Papetti, P. Grisoli, C. Dacarro, C. Pruzzo and G. Gazzani, J. Agric. Food Chem., 2002, 50, 1225–1229 CrossRef CAS.
- C. A. Gay and J. M. Gebicki, Anal. Biochem., 2002, 304, 42–46 CrossRef CAS.
- D. P. Nelson and L. A. Kiesow, Anal. Biochem., 1972, 49, 474–478 CAS.
| This journal is © The Royal Society of Chemistry 2011 |
