Life cycle assessment of solar photo-Fenton and solar photoelectro-Fenton processes used for the degradation of aqueous α-methylphenylglycine
Anna
Serra
a,
Xavier
Domènech
a,
Enric
Brillas
b and
José
Peral
*a
aDepartament de Química, Edifici Cn, Universitat Autònoma de Barcelona, E-08193, Bellaterra, Barcelona, Spain. E-mail: jose.peral@uab.cat
bLaboratori d'Electroquímica dels Materials i del Medi Ambient, Departament de Química Física, Facultat de Química, Universitat de Barcelona, Martí i Franquès 1-11, 08028, Barcelona, Spain
First published on 15th November 2010
Abstract
A comparative Life Cycle Assessment (LCA) of solar photo-Fenton and solar photoelectro-Fenton, two solar-driven advanced oxidation processes (AOPs) devoted to the removal of non-biodegradable pollutants in water, is performed. The study is based on the removal, at laboratory scale, of the amino acid α-methylphenylglycine, a good example of soluble and non-biodegradable target pollutant. The system under study includes chemicals, electricity, transport of all raw materials to the plant site, and the generation of emissions, but it does not take into account the impact of the infrastructure needed to build a hypothetical solar plant. Nine environmental impact categories are included in the LCA: global warming potential, ozone depletion potential, aquatic eutrophication potential, acidification potential, human toxicity potential, photochemical ozone formation potential, fresh water aquatic ecotoxicity potential, marine aquatic ecotoxicity potential, and terrestrial ecotoxicity potential and abiotic resource depletion potential. Although previous experimental results show that both AOPs are able to efficiently degrade the pollutant, the LCA indicates that solar-driven photo-Fenton is the most environmentally friendly alternative, mainly because the use of electricity in solar photoelectro-Fenton experiments involves high environmental impacts.
Environmental impactAs any other human driven activity, environmentally friendly techniques used for wastewater treatment and water remediation have also non-negligible environmental impacts. Those impacts should be quantified in order to give a more complete account of the advantages and drawbacks of the different technological choices for water treatment. This paper presents an example about how Life Cycle Assessment can work as a suitable environmental tool for the quantification of the impacts associated to several Advanced Oxidation Processes (photochemical vs. photoelectrochemical) when they are used for the removal of a model pharmaceutical pollutant from water. |
Introduction
The development of new technologies and management practises for water pollution prevention and water recycling is currently a critical issue. As an example, the Water Framework Directive of the European Union addresses the problem posed by many toxic pollutants that are chemically stable or difficult to mineralize by means of conventional biological treatment. Biological treatments are often not suitable for the removal of this type of substances, and thus non-biological technologies such as Advanced Oxidation Processes (AOPs), that are based on the in situ production of transient radical species of large oxidant power like the hydroxyl radical (HO˙),1–3 must be put into practice.The processes based on the Fenton reaction are usually among the most efficient AOPs in terms of reaction rate. In the classical Fenton system based on reaction (1):4–6
| H2O2 + Fe2+ → Fe3+ + HO˙ + HO− | (1) |
| H2O2 + Fe3+ → Fe2+ + HO2˙ + H+ | (2) |
On the other hand, it is well known that the use of solar energy in Fenton systems (solar photo-Fenton (SPF)) leads, after previous generation of the active Fe(OH)2+ species (reaction (3)), to a faster recovery of the Fe2+ species in the so-called photo-Fenton reaction (4):6
| HO− + Fe3+ → Fe(HO)2+ | (3) |
| Fe(HO)2+ + hν → Fe2+ + HO˙ | (4) |
This alternative pathway is also more efficient in terms of reagent consumption than the Fenton-like reaction since the use of H2O2 in the Fe2+ recovery reaction is reduced and extra HO˙ radicals are generated. The beneficial role of light can also be due to the possibility of promoting homogeneous photochemistry with some of the reaction intermediates generated. Since Fe(HO)2+ is the light active species, solar irradiation can also be used for activity enhancement in electro-Fenton systems, giving a reactive process called solar photoelectro-Fenton (SPEF).9–11 In both cases (SPF and SPEF systems) the use of light increases the reaction rates and reduces the consumption of reagents and electricity.
The development of new chemical technologies for wastewater treatment has been usually based on two main criteria: efficiency of pollutant removal and economical burdens. Nevertheless, since new chemical processes always involve environmental impacts associated to either the build up of an infrastructure or the consumption of reagents and energy, and in order to avoid the appearance of a new and more serious environmental problem when solving a previous one, the use of new criteria based on the assessment of the overall environmental impact of the processes is worth of consideration. This is especially true for an activity like wastewater treatment where the final goal is to minimise the effect of pollution. Therefore, a complete environmental assessment of any emergent technology should be carried out before considering its use as wastewater treatment technology. Life Cycle Assessment (LCA) appears as one of the most accepted tools for this purpose.12 LCA can be used to define and reduce the environmental burdens of a product, process or activity by identifying and quantifying energy and materials usage, as well as waste discharges, assessing the impacts of those wastes on the environment and evaluating opportunities for environmental improvement over the whole life cycle.13 Because of its holistic approach, LCA is becoming an increasingly important decision-making tool in environmental management. Its main advantage lies in broadening the system boundaries to include all burdens and impacts in the life cycle of a product or a process, not focusing on the emissions and wastes generated by the plant or manufacturing site.14 In recent studies based on data obtained in laboratory experiments,15–18 the LCA methodology has been applied to several AOPs, and has been shown to be a suitable tool for the ecodesign of technological processes.
The aim of this work is thus to perform a comparative environmental assessment, by means of LCA, of Fenton and EF reactions, and their sunlight driven photochemical versions, i.e. SPF and SPEF, when the same percentage of TOC removal is achieved. The assessment is based on previously published data19 of the performance of those processes during the mineralization of the non-biodegradable and highly water soluble pollutant α-methylphenylglycine (α-MPG). The final goal is to compare the environmental impacts of the electrochemical processes, that turned out to be more efficient in terms of reaction rate, with those of the non-electrochemical ones, and characterize the most environmentally friendly alternative with regard to reagent transport and supply (H2O2 consumption) or electricity consumption (in situH2O2 generation). LCAs of photo-Fenton based processes have been previously published, but this is the first time that such an assessment of environmental impacts is applied to electro-Fenton and photoelectron-Fenton systems.
Experimental
AOP experiments
The details of the experiments that generated the source data used in the present work can be found elsewhere19 and they are summarized in Table 1.| Fenton | SPF | EF | SPEF | |
|---|---|---|---|---|
| [MPG]initial/mg L−1 | 500 | 500 | 500 | 500 |
| TOCinitial/mg L−1 | 327 | 327 | 327 | 327 |
| DQOinitial/mg L−1 O2 | 944 | 944 | 944 | 944 |
| Wastewater volume/mL | 250 | 250 | 250 | 250 |
| Temperature/°C | 25.0 ± 0.1 | 25.0 ± 0.1 | 25.0 ± 0.1 | 25.0 ± 0.1 |
| pH | 2.9 ± 0.1 | 2.9 ± 0.1 | 2.9 ± 0.1 | 2.9 ± 0.1 |
| [Fe2+]initial/mg L−1 | 10.0 | 10.0 | 10.0 | 10.0 |
| [H2O2]initial/mM | 145 (2 stoichiometric) | 145 (2 stoichiometric) | — | — |
| 72.5 (stoichiometric) | 72.5 (stoichiometric) | |||
| 36.3 (½ stoichiometric) | 36.3 (½ stoichiometric) | |||
| Intensity/mA (cell voltage/V) | — | — | 100 (16–18) | 100 (16–18) |
| 300 (20–22) | 300 (20–22) | |||
| 450 (26–28) | 450 (26–28) | |||
| [Na2SO4]/mM | — | — | 50.0 | 50.0 |
| O2 flow/mL min−1 | — | — | 20 | 20 |
| Kind of radiation | — | Solar | — | Solar |
Briefly, synthetic non-biodegradable wastewaters were treated at laboratory bench-scale by means of Advanced Oxidation Processes based in the Fenton reaction. Specifically, Fenton (F), solar photo-Fenton (SPF), electro-Fenton (EF), and solar photoelectro-Fenton (SPEF) were used to treat 250 mL of a 500 mg L−1α-MPG solution. All experiments were performed with 10 mg L−1Fe2+ as initial catalyst concentration, 0.05 M Na2SO4 as background electrolyte in electrochemical experiments, and keeping constant during the treatment both the solution pH (2.8–3.0) and temperature (25 °C).
The synthetic wastewater was placed in an open cylindrical monocompartmental Pyrex glass reactor of 400 mL capacity. During each run the solution was vigorously stirred with a magnetic bar to ensure its homogenization and suitable transport of reactants towards/from the electrodes.
36.3, 72.5 and 145.0 mM H2O2 initial concentrations were used in the chemical processes (Fenton and SPF). Those concentrations correspond to half the stoichiometric (½ st.), the stoichiometric (st.) and twice the stoichiometric (2 st.) concentration of H2O2 needed to mineralize the α-MPG when taking into account the following reaction:
| C9H11NO2 + 24H2O2 → 9CO2 + NO3− + H+ + 29H2O | (5) |
In the electrochemical experiments (EF and SPEF), the current intensity applied to the processes was kept constant along time. Three different intensities were tested: 100, 300 and 450 mA.
Electrochemical experiments were conducted with a 3 cm2boron-doped diamond thin-film anode deposited on a conductive silicon sheet, and with a 3 cm2carbon–PTFE cathode, fed with pure O2 at 20 mL min−1. The inter-electrode gap was about 1 cm.
Solar treatments were carried out under direct exposition of the cell to solar irradiation. This was placed on top of a mirror for improved concentration of the sun rays. The solar experiments were performed in sunny and clear days during the months of June–August at the Barcelona laboratory (latitude: 41° 21′ N, longitude: 2° 10′ E), from 12 pm to 5 pm (local time), and with a decay in total solar irradiance from 1000 W m−2 at noon to 400 W m−2 at 5 pm, yielding an average UV irradiation (below 400 nm, 5% of the averaged total irradiation) close to 15 W m−2 (data provided by the Departament d'Astronomia i Meteorologia, Faculty of Physics, Universitat de Barcelona). Such an irradiation corresponds to a photon flux of approximately 3.7 × 10¹⁹photons m−2s−1.
The mineralization of α-MPG solutions was monitored by following the removal of the total organic carbon (TOC). H2O2 concentration was determined from the light absorption at 408 nm of the titanic–hydrogen peroxide coloured complex. The pollutant decay was followed by room temperature reversed-phase HPLC chromatography (Waters) with a 5 µm C18 column (250 mm × 4.6 mm (i.d.)) and coupled to a diode array detector working at 220 nm. NH4+ and NO3− ions released from initial N degradation were detected by ion chromatography.19
LCA methodology
The ISO 14040 Standard20 sets four main interrelated phases to develop the Life Cycle Assessment (LCA). Thus, taking the ISO standard as guideline, the present study is also divided in four main phases, namely: (1) goal and scope, where the purpose, scope, system burdens, main hypothesis, functional unit, and type and quality of data are defined; (2) inventory analysis, where data are collected in order to quantify the inputs and outputs of the system; (3) impact assessment, where the potential environmental impacts produced by the system (and subsystems) under study are identified, classified in several impact categories and characterized; and (4) interpretation, where obtained results are discussed in terms of critical sources of impact of the process and the ways or opportunities to reduce those impacts.This LCA study is intended for gaining insight of the environmental impact of the above mentioned Fenton processes and to compare them from an environmental point of view. The objective is to use environmental information for the proper design of AOP-based wastewater treatment processes. The target audience is the scientific community.
(i) Production of electricity consumed by the AOPs, including extraction of resources, transport and electricity production.
(ii) Production of chemicals consumed by the AOP, including extraction of resources, production of the corresponding chemicals and the different transportation steps.
(iii) CO2 released by the mineralization processes.
(iv) Release of chemicals in the final treated effluent.
The main hypothesis and limitations assumed in the present work can be summarized as follows:
(i) All results refer to experiments made at laboratory scale. Thus, no extrapolation is possible to pilot plant or industrial scale.
(ii) Infrastructure and equipments have not been optimized and, consequently, they have not been considered in the analysis.
(iii) It has been assumed that the energy used to run the electrochemical reactions and the pumps and other electric devices of the system is delivered by the European electrical grid (average of the Union for the Coordination of Transmission of Electricity, UCTE, net).
(iv) It has been assumed that the reagents used in the AOPs are produced in Spain, with a transport distance to the consumer of 50 km, and being carried by 16 t-trucks.
(v) Chemical pre-treatments (i.e., acidification) and post-treatments (i.e., neutralization) are not taken into account because they are the same for each treatment.
(vi) Since iron acts as catalyst and no sludge formation was detected, it is assumed that all the iron initially present in solution leaves the system in the resulting effluent (water emission).
(vii) The potential environmental impacts of both residual TOC (of non-toxic character) in the final treated effluent and CO2 emissions estimated from the TOC mineralized have been considered for the assessment of the global warming potential and the aquatic eutrophication potential. TOC content has not been considered for the assessment of toxicity potentials because TOC is usually a non-specific parameter resulting from a mixture of compounds of unknown nature.
Two different functional units have been defined for the two sets of experiments and scenarios considered: (a) 70% TOC removal in a 250 mL aqueous solution of 500 mg L−1 of α-MPG and (b) 90% TOC removal in a 250 mL aqueous solution of 500 mg L−1 of α-MPG. The choice of two functional units is based on the fact that not all the AOP were able to achieve a 90% TOC removal. Thus, the first functional unit (70% removal) includes the comparison of all AOP, while the second one (90% removal) only compares those solar processes that are able to render a high TOC removal. In any case, scenario comparisons have always been made by considering the same functional unit.
| Functional unit: 70% TOC removal | ||||||||||||
|---|---|---|---|---|---|---|---|---|---|---|---|---|
| Scenario | Input/mg | Output/mg | ||||||||||
| Air emissions | Water emissions | |||||||||||
| H2O2 | FeSO4 | Na2SO4 | O2 | CO2 | TOC | NH4+ | NO3− | H2O2 | Fetotal | SO42− | Na+ | |
| SPF ½ st. | 313.5 | 6.8 | — | — | 209.4 | 24.5 | 10.0 | — | — | 2.5 | 4.3 | — |
| SPF st. | 627.0 | 6.8 | — | — | 213.3 | 24.9 | 9.6 | 0.1 | 44.0 | 2.5 | 4.3 | — |
| SPF 2 st. | 1254.0 | 6.8 | — | — | 209.6 | 24.5 | 8.9 | 0.4 | 351.2 | 2.5 | 4.3 | — |
| EF 300 mA | — | 6.8 | 1775.5 | 9952.0 | 209.3 | 24.5 | 9.1 | 3.5 | 382.8 | 2.5 | 1205.0 | 574.8 |
| EF 450 mA | — | 6.8 | 1775.5 | 7595.0 | 210.2 | 24.6 | 9.0 | 4.5 | 646.4 | 2.5 | 1205.0 | 574.8 |
| SPEF 100 mA | — | 6.8 | 1775.5 | 5369.0 | 212.4 | 24.8 | 9.8 | 1.5 | 5.8 | 2.5 | 1205.0 | 574.8 |
| SPEF 300 mA | — | 6.8 | 1775.5 | 2488.0 | 209.6 | 24.5 | 8.7 | 1.2 | 21.2 | 2.5 | 1205.0 | 574.8 |
| SPEF 450 mA | — | 6.8 | 1775.5 | 2488.0 | 211.5 | 24.7 | 9.5 | 2.0 | 117.3 | 2.5 | 1205.0 | 574.8 |
| Functional unit: 90% TOC removal | ||||||||||||
|---|---|---|---|---|---|---|---|---|---|---|---|---|
| Scenario | Input/mg | Output/mg | ||||||||||
| Air emissions | Water emissions | |||||||||||
| H2O2 | FeSO4 | Na2SO4 | O2 | CO2 | TOC | NH4+ | NO3− | H2O2 | Fetotal | SO42− | Na+ | |
| SPF st. | 627.0 | 6.8 | — | — | 274.2 | 8.3 | 10.7 | 1.3 | 2.2 | 2.5 | 4.3 | — |
| SPF 2 st. | 1254.0 | 6.8 | — | — | 269.5 | 8.2 | 11.6 | 1.5 | 35.7 | 2.5 | 4.3 | — |
| SPEF 100 mA | — | 6.8 | 1775.5 | 6809.0 | 273.1 | 8.3 | 10.8 | 2.9 | 16.1 | 2.5 | 1205.0 | 574.8 |
| SPEF 300 mA | — | 6.8 | 1775.5 | 3707.5 | 269.4 | 8.2 | 9.8 | 2.5 | 70.7 | 2.5 | 1205.0 | 574.8 |
| SPEF 450 mA | — | 6.8 | 1775.5 | 3405.0 | 271.9 | 8.2 | 10.2 | 2.8 | 158.2 | 2.5 | 1205.0 | 574.8 |
| Functional unit: 70% TOC removal | ||||||||
|---|---|---|---|---|---|---|---|---|
| Scenario | Time/min | Intensity/A | Voltage/V | Electrical energy/kW h | Transport/t km | |||
| H2O2 | FeSO4 | Na2SO4 | O2 | |||||
| SPF ½ st. | 200 | — | — | — | 0.31 × 10⁻⁴ | 3.4 × 10⁻⁷ | — | — |
| SPF st. | 85 | — | — | — | 0.63 × 10⁻⁴ | 3.4 × 10⁻⁷ | — | — |
| SPF 2 st. | 65 | — | — | — | 1.25 × 10⁻⁴ | 3.4 × 10⁻⁷ | — | — |
| EF 300 mA | 380 | 0.30 | 20 | 0.038 | — | 3.4 × 10⁻⁷ | 8.9 × 10⁻⁵ | 5.0 × 10⁻⁴ |
| EF 450 mA | 290 | 0.45 | 26 | 0.057 | — | 3.4 × 10⁻⁷ | 8.9 × 10⁻⁵ | 3.8 × 10⁻⁴ |
| SPEF 100 mA | 205 | 0.10 | 16 | 0.005 | — | 3.4 × 10⁻⁷ | 8.9 × 10⁻⁵ | 2.7 × 10⁻⁴ |
| SPEF 300 mA | 95 | 0.30 | 20 | 0.009 | — | 3.4 × 10⁻⁷ | 8.9 × 10⁻⁵ | 1.2 × 10⁻⁴ |
| SPEF 450 mA | 95 | 0.45 | 26 | 0.019 | — | 3.4 × 10⁻⁷ | 8.9 × 10⁻⁵ | 1.2 × 10⁻⁴ |
| Functional unit: 90% TOC removal | ||||||||
|---|---|---|---|---|---|---|---|---|
| Scenario | Time/min | Intensity/A | Voltage/V | Electrical energy/kW h | Transport/t km | |||
| H2O2 | FeSO4 | Na2SO4 | O2 | |||||
| SPF st. | 180 | — | — | — | 0.63 × 10⁻⁴ | 3.4 × 10⁻⁷ | — | — |
| SPF 2 st. | 180 | — | — | — | 1.25 × 10⁻⁴ | 3.4 × 10⁻⁷ | — | — |
| SPEF 100 mA | 260 | 0.10 | 16 | 0.007 | — | 3.4 × 10⁻⁷ | 8.9 × 10⁻⁵ | 3.4 × 10⁻⁴ |
| SPEF 300 mA | 145 | 0.30 | 20 | 0.015 | — | 3.4 × 10⁻⁷ | 8.9 × 10⁻⁵ | 1.9 × 10⁻⁴ |
| SPEF 450 mA | 130 | 0.45 | 26 | 0.025 | — | 3.4 × 10⁻⁷ | 8.9 × 10⁻⁵ | 1.7 × 10⁻⁴ |
Subsequently, the classified data were characterized (quantified) using equivalency factors from literature.12,25,26 In this sense, (a) kg of Sb stands for the equivalent mass of a scarce resource as antimonium in ADP; (b) kg of CO2 stands for the equivalent mass of the representative greenhouse gas CO2 in GWP; (c) kg of CFC-11 stands for the equivalent mass of the most aggressive CFC towards ozone in ODP; (d) kg of 1,4-DB stands for the equivalent mass of the representative toxic compound 1,4-dichlorbenzene in HTP, FAEP, MAEP and TEP; (e) kg of C2H4 stands for the equivalent mass of the representative smog forming hydrocarbon C2H4 in POP; (f) kg of SO2 stands for the equivalent mass of the main acid rain forming substance SO2 in AP; and (g) kg of PO43− stands for the equivalent mass of the representative eutrophication forming substance PO43− in AEP.
Results and discussion
As mentioned before, the experiments or scenarios used in this study have been taken from previously published data.19 The scenarios considered in this LCA have been:(1) 70% TOC removal using the solar photo-Fenton process with half the stoichiometric amount of H2O2 needed to completely mineralize the α-MPG (SPF ½ st.).
(2) 70% TOC removal using the solar photo-Fenton process with the stoichiometric amount of H2O2 needed to completely mineralize the α-MPG (SPF st.).
(3) 70% TOC removal using the solar photo-Fenton process with twice the stoichiometric amount of H2O2 needed to completely mineralize the α-MPG (SPF 2 st.).
(4) 70% TOC removal using the electro-Fenton process with a steady 300 mA supply (EF 300 mA).
(5) 70% TOC removal using the electro-Fenton process with a steady 450 mA supply (EF 450 mA).
(6) 70% TOC removal using the solar photoelectro-Fenton process with a steady 100 mA supply (SPEF 100 mA).
(7) 70% TOC removal using the solar photoelectro-Fenton process with a steady 300 mA supply (SPEF 300 mA).
(8) 70% TOC removal using the solar photoelectro-Fenton reaction with a steady 450 mA supply (SPEF 450 mA).
(9) 90% TOC removal using the solar photo-Fenton process with the stoichiometric amount of H2O2 needed to completely mineralize the α-MPG (SPF st.).
(10) 90% TOC removal using the solar photo-Fenton process with twice the stoichiometric amount of H2O2 needed to completely mineralize the α-MPG (SPF 2 st.).
(11) 90% TOC removal using the solar photoelectro-Fenton process with a steady 100 mA supply (SPEF 100 mA).
(12) 90% TOC removal using the solar photoelectro-Fenton process with a steady 300 mA supply (SPEF 300 mA).
(13) 90% TOC removal using the solar photoelectro-Fenton process with a steady 450 mA supply (SPEF 450 mA).
Basically, solar photo-Fenton and solar photoelectro-Fenton processes are compared, although a couple of electro-Fenton (no light) scenarios are also considered. Different values of initial H2O2 concentration for solar photo-Fenton and current intensity for electro-Fenton and solar photoelectro-Fenton scenarios are considered. Also, two different mineralization percentages, 70% and 90% TOC removal, have been taken into account. Tables 2 and 3 show relevant data obtained in those experiments. The consumption of reagents and the emissions of chemicals to air and water per functional unit are displayed in Table 2 (70% and 90% TOC removal). Other relevant parameters to LCA like reaction time, electricity consumption and transport units (tons of carried chemicals multiplied by the travelled distance) per functional unit are displayed in Table 3 (70% and 90% TOC removals). As it can be seen, the most efficient processes in terms of reaction time needed to achieve the same TOC conversion are the solar photo-Fenton with twice the stoichiometric amount of H2O2 for 70% removal (65 min) and the solar photoelectro-Fenton at 450 mA for 90% TOC removal (130 min).
In order to visualize the nature and the relative importance of the environmental impacts associated to each subsystem, Fig. 1 shows the relative impacts (100% is assigned to the higher impact factor in each impact category) of a selected scenario (solar photoelectro-Fenton experiment with 300 mA and 90% conversion, SPEF 300 mA). The choice of that scenario was based on the fact that it clearly displays the importance that electricity consumption has on photoelectro-Fenton impacts. The results obtained for the rest of the photoelectron-Fenton scenarios are quite similar. As can be seen, electricity used to drive the electrochemical reactions is, by far, the most impacting factor for the majority of impact categories, with the exception of the aquatic eutrophication potential (AEP), where water emissions have the larger environmental impact, mainly due to inorganic soluble compounds (ammonia and nitrate ions) generated from α-MPG degradation. The consumption of oxygen is another subsystem of environmental concern that significantly affects all environmental impact categories, in particular the ozone depletion potential (ODP); the environmental impact of this subsystem is mainly due to the energy required for oxygen production. Although not included here, it has to be said that LCA analysis was also extended to similar experiments that had been carried out with synthetic air instead of oxygen, and no substantial differences were noticed because the environmental impacts of synthetic air production are similar to synthetic oxygen production. Nevertheless, the use of non-synthetic air pumped directly from laboratory room could involve significant environmental impact reduction. The consumption of iron sulfate and the transport of consumables play only a minor role in the total environmental impact.
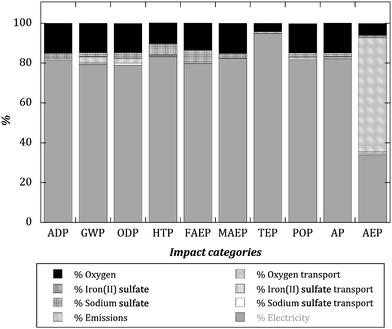 | ||
| Fig. 1 Relative impacts (100% is assigned to the higher impact factor in each impact category) for the solar photoelectro-Fenton experiment at 300 mA and for 90% conversion (SPEF 300 mA). | ||
On the other hand, Fig. 2 shows the relative contribution of several impact factors in scenario 9, something that can be extrapolated to all the SPF scenarios. In those cases, where no electricity is directly used, the main impact is attributed, by far, to the production of the consumed hydrogen peroxide, again with the exception of the aquatic eutrophication potential (AEP) where the emission of soluble inorganic N compounds in the final effluent is the main contribution to the total environmental impact. Furthermore, the emissions subsystem also significantly affects the global warming potential (GWP) due to the CO2 generated from α-MPG mineralization. Again, the production of iron sulfate and the transport of consumables play only a minor role. These results are in concordance with other previous published works where LCA was applied to SPF treatments of non-biodegradable wastewaters at bench-scale.17,18 In those cases, the environmental impacts for the majority of impact categories were also directly associated to the production of the H2O2 consumed, again with the special case of AEP where the presence of inorganic N emissions were the main environmental contributors. Otherwise, Muñoz et al.16,27 carried out a LCA of a SPF wastewater treatment coupled with a biological treatment at industrial-scale with the same target substance (α-MPG) and they found similar behaviours both on the efficiency of the AOP and on the assessment of environmental impacts.
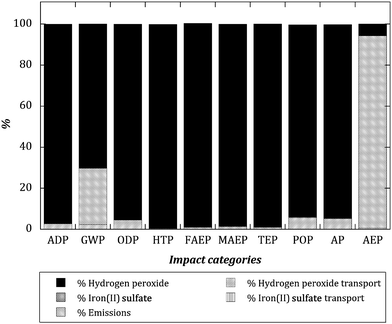 | ||
| Fig. 2 Relative impacts (100% is assigned to the higher impact factor in each impact category) for the solar photo-Fenton experiment using the stoichiometric amount of H2O2 needed to completely mineralize the α-MPG and for 90% conversion (SPF st.). | ||
Fig. 3 displays the results of the LCA comparison between all the scenarios considered when a 70% TOC removal is achieved. As can be seen, the general trend is that the most impacting scenarios are those that consume electricity with no light support (electro-Fenton). For some of the impact categories the values corresponding to electro-Fenton processes are above one order of magnitude higher than those of solar photo-Fenton and solar photoelectro-Fenton. In terms of environmental impact the positive role of using sunlight is then clear, even for the solar photoelectro-Fenton processes where electricity is also consumed. Also expected are the impacts observed within the same groups of techniques. In this way, the production and consumption of H2O2 is the most impacting subsystem among the solar photo-Fenton processes, having a generally larger impact on the ones that consume the larger amount of this chemical (the experiments with half the stoichiometric H2O2 content generate the lower impacts), while for the solar photoelectro-Fenton reactions the environmental impact increases with the amount of current intensity used (the lower impacts are obtained with the experiments at 100 mA). The same conclusion is valid for the electro-Fenton scenarios.
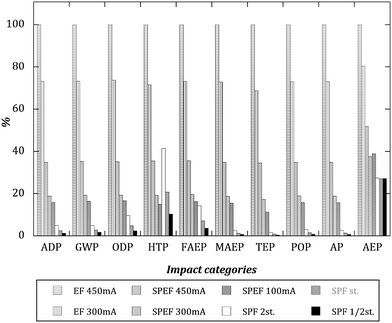 | ||
| Fig. 3 Relative impacts of each scenario to several impact categories (100% is assigned to the highest impact scenario) considering 90% TOC conversion. | ||
The same trend is obtained for a 90% TOC conversion. For this functional unit, the characterization of impact categories is displayed in Table 4. The results show that SPF with the stoichiometric amount of H2O2 needed to completely mineralize the α-MPG (SPF st.) presents the lower environmental impacts for all categories. In this case, SPF with half the stoichiometric amount of H2O2 (SPF ½ st.) is not compared because with this process only 75% TOC reduction was obtained after 5 hours.
| Impact category | Units | SPF st. | SPF 2 st. | SPEF 100 mA | SPEF 300 mA | SPEF 450 mA |
|---|---|---|---|---|---|---|
| Abiotic depletion | kg Sb | 6.0 × 10⁻⁶ | 1.2 × 10⁻⁵ | 4.8 × 10⁻⁵ | 6.9 × 10⁻⁵ | 1.1 × 10⁻⁴ |
| Global warming | kg CO2 | 1.0 × 10⁻³ | 1.7 × 10⁻³ | 7.0 × 10⁻³ | 9.8 × 10⁻³ | 1.5 × 10⁻² |
| Ozone layer depletion | kg CFC-11 | 6.8 × 10⁻¹¹ | 1.4 × 10⁻¹⁰ | 3.0 × 10⁻¹⁰ | 4.1 × 10⁻¹⁰ | 6.4 × 10⁻¹⁰ |
| Human toxicity | kg 1,4-DB | 2.3 × 10⁻³ | 4.6 × 10⁻³ | 2.1 × 10⁻³ | 3.1 × 10⁻³ | 5.1 × 10⁻³ |
| Fresh water aquatic ecotox. | kg 1,4-DB | 1.5 × 10⁻⁴ | 3.1 × 10⁻⁴ | 4.4 × 10⁻⁴ | 6.3 × 10⁻⁴ | 9.9 × 10⁻⁴ |
| Marine aquatic ecotoxicity | kg 1,4-DB | 0.3 | 0.6 | 4.3 | 6.3 | 10.0 |
| Terrestrial ecotoxicity | kg 1,4-DB | 4.9 × 10⁻⁶ | 9.9 × 10⁻⁶ | 8.4 × 10⁻⁵ | 1.5 × 10⁻⁴ | 2.7 × 10⁻⁴ |
| Photochemical oxidation | kg C2H4 | 1.1 × 10⁻⁷ | 2.3 × 10⁻⁷ | 1.5 × 10⁻⁶ | 2.1 × 10⁻⁶ | 3.4 × 10⁻⁶ |
| Acidification | kg SO2 | 2.5 × 10⁻⁶ | 5.0 × 10⁻⁶ | 3.7 × 10⁻⁵ | 5.3 × 10⁻⁵ | 8.5 × 10⁻⁵ |
| Eutrophication | kg PO43− | 3.9 × 10⁻⁶ | 4.4 × 10⁻⁶ | 5.8 × 10⁻⁶ | 6.3 × 10⁻⁶ | 7.9 × 10⁻⁶ |
Summing up, the above results evidence that, within the hypothesis and limitations assumed in this work, it is better, from an environmental point of view, the use of hydrogen peroxide produced at around 50 km from the consumer than its in situ electrochemical synthesis.
The key aspect of this LCA analysis is the fact that the use of electricity, either in electro-Fenton or in light assisted photoelectro-Fenton experiments, always involves a remarkable increase in the global environmental impact of the processes and, consequently, the solar photo-Fenton system turns out to be the better choice from an environmental point of view. Thus, in the case of 70% TOC conversion, the solar photo-Fenton process using half the stoichiometric amount of H2O2 gives the best results. Solar photo-Fenton and solar photoelectro-Fenton processes involve similar reaction times, but the former is environmentally advantageous. In the case of the 90% conversion, the final choice should be balanced taking into account that the solar photo-Fenton process has the lower environmental impact although the solar photoelectro-Fenton process takes place in a much shorter time and, at pilot or industrial scale, a shorter reaction time might involve the need for less reaction volume and less infrastructure. This clearly indicates the need for a complete LCA study that would take into account the environmental impact of building up pilot to industrial scale solar photo-Fenton and solar photoelectro-Fenton water treatment plants. At this moment, the possibility of such an extended LCA is hindered by the lack of the corresponding experimental data.
Finally, the main conclusions obtained here are only valid for Europe and other zones of the world where electricity is mainly obtained from non-renewable sources of energy since the main sources of European electricity are, in decreasing generation order, nuclear, hydraulic, oil, natural gas, lignite and coal.22 The same analysis carried out in zones where the electricity is obtained from renewable energies would probably have produced a completely different output.
Conclusions
The environmental impact of the degradation of α-methylphenylglycine by means of solar photo-Fenton, electro-Fenton and solar photoelectro-Fenton processes has been studied by using the LCA methodology. Previous laboratory work had shown that the shorter reaction times required for 90% mineralization were obtained by using the solar photoelectro-Fenton process. However, the environmental assessment always shows a clearly lower impact when using solar photo-Fenton process. The use of electricity required to drive the electrochemical reactions involves an important environmental penalty and, thus, in situations where reaction time is not the determining factor, solar photo-Fenton should be a better choice than solar photoelectro-Fenton. The main factor that causes the high impact of the last process is electricity consumption, although oxygen consumption and emissions of reaction final products have to be taken also into consideration. Consumption of hydrogen peroxide is the key factor in the environmental impacts of solar photo-Fenton; in this way, it has been observed that the larger the initial concentration of hydrogen peroxide the larger the environmental impact. In the absence of pilot plant data that could be used to assess the environmental impact of the infrastructure associated to a solar wastewater treatment plant, the scenarios with longer reaction times (lower amount of H2O2 and lower electrical intensity) always give the lower environmental impact. In any case, solar irradiation causes a decrease of the majority of the environmental impacts.Acknowledgements
The authors want to thank the Ministerio de Ciencia e Innovación of Spain for financial support through the CTQ2008-00178 research project.References
- P. R. Gogate and A. B. Pandit, Adv. Environ. Res., 2004a, 8, 501–551 Search PubMed.
- P. R. Gogate and A. B. Pandit, Adv. Environ. Res., 2004b, 8, 553–597 Search PubMed.
- M. Pera-Titus, V. García-Molina, M. A. Baños, J. Giménez and S. Esplugas, Appl. Catal., B, 2004, 47, 219–256 CrossRef CAS.
- J. J. Pignatello, Environ. Sci. Technol., 1992, 26, 944–951 CAS.
- S. H. Bossmann, E. Oliveros, M. Kantor, S. Niebler, A. Bonfill, N. Shahin, M. Wörner and A. M. Braun, Water Sci. Technol., 2004, 49, 75–80 Search PubMed.
- J. J. Pignatello, E. Oliveros and A. MacKay, Crit. Rev. Environ. Sci. Technol., 2006, 36, 1–84 CrossRef CAS.
- E. Brillas, E. Mur and J. Casado, J. Electrochem. Soc., 1996, 143, L49–L53 CAS.
- E. Brillas, E. Mur, R. Sauleda, L. Sànchez, J. Peral, X. Domènech and J. Casado, Appl. Catal., B, 1998a, 16, 31–42 Search PubMed.
- E. Brillas, R. Sauleda and J. Casado, J. Electrochem. Soc., 1998b, 145, 759–765 Search PubMed.
- C. Flox, P. L. Cabot, F. Centellas, J. A. Garrido, R. M. Rodríguez, C. Arias and E. Brillas, Appl. Catal., B, 2007, 75, 17–28 CrossRef CAS.
- M. Skoumal, C. Arias, P. L. Cabot, F. Centellas, J. A. Garrido, R. M. Rodríguez and E. Brillas, Chemosphere, 2008, 71, 1718–1729 CrossRef CAS.
- J. B. Guinée, M. Gorree, R. Heijungs, G. Huppes, R. Kleijn, H. A. Udo De Haes, E. Van Der Voet and M. N. Wrisberg, Life Cycle Assessment. An Operational Guide to ISO Standards, Center of Environmental Science, Leiden University (CML), The Netherlands, 2002, vol. 1–3 Search PubMed.
- F. Consoli, D. Allen, I. Boustead, N. de Oude, J. Fava, W. Franklin, B. Quay, R. Parrish, R. Perriman, D. Postlethwaite, J. Seguin and B. Vigon, Guidelines for Life-Cycle Assessment: A Code of Practice, Society of Environmental Toxicology and Chemistry, Brussels, Belgium, 1993 Search PubMed.
- A. Azapagic and R. Clift, J. Clean. Prod., 1999, 7, 135–143 CrossRef.
- I. Muñoz, J. Rieradevall, F. Torrades, J. Peral and X. Domènech, Sol. Energy, 2005, 79, 369–375 CrossRef CAS.
- I. Muñoz, J. Peral, J. A. Ayllón, S. Malato, P. Passarinho and X. Domènech, Water Res., 2006, 40, 3533–3540 CrossRef CAS.
- J. García-Montaño, N. Ruiz, I. Muñoz, X. Domènech, J. A. García-Hortal, F. Torrades and J. Peral, J. Hazard. Mater., 2006, 138, 218–225 CrossRef CAS.
- M. J. Farré, J. García-Montaño, N. Ruiz, I. Muñoz, X. Domènech and J. Peral, Environ. Technol., 2007, 28, 819–830 CrossRef.
- A. Serra, X. Domènech, C. Arias, E. Brillas and J. Peral, Appl. Catal., B, 2009, 89, 12–21 CrossRef CAS.
- ISO 14040, Environmental Management—Life Cycle Assessment—Principles and Framework, Genève, Switzerland, 1997 Search PubMed.
- Swiss Centre for Life Cycle Inventories, 2009, Ecoinvent data v2.1 database, http://www.ecoinvent.org/.
- R. Dones, C. Bauer, B. Burger, M. Faist, R. Frischknecht, T. Heck, N. Jungbluth and A. Röder, Sachbilanzen von Energiesystemen: Grundlagen für den ökologischen Vergleich von Energiesystemen und den Einbezug von Energiesystemen in Ökobilanzen für die Schweiz, Final report Ecoinvent 2000 No 6, Swiss Centre for Life Cycle Inventories, Paul Scherrer Institut, Villigen, Switzerland, 2004 Search PubMed.
- H. J. Althaus, M. Chudacoff, R. Hischier, N. Jungbluth, A. Primas and M. Osses, Life Cycle Inventories of Chemicals, Final report Ecoinvent 2000 No. 8, Swiss Centre for Life Cycle Inventories, Duebendorf, Switzerland, 2004 Search PubMed.
- M. Spielmann, T. Kägi and O. Tietje, Life Cycle Inventories of Transport Services, Final report Ecoinvent 2000 No 4, Swiss Centre for Life cycle Inventories, Duebendorf, Switzerland, 2004 Search PubMed.
- M. Hauschild and H. Wenzel, Environmental Assessment of Products, Scientific Background, Chapman & Hall, Boca Raton, FL, 1998, vol. 2 Search PubMed.
- M. Huijbregts and J. Seppälä, Int. J. Life Cycle Assess., 2001, 6, 339–343 CrossRef CAS.
- I. Muñoz, J. Peral, J. A. Ayllón, S. Malato, M. J. Martin, J. Y. Perrot, M. Vincent and X. Domènech, Environ. Eng. Sci., 2007, 24(5), 638–651 CrossRef CAS.
| This journal is © The Royal Society of Chemistry 2011 |