Biological formation of caproate and caprylate from acetate: fuel and chemical production from low grade biomass
Kirsten J. J.
Steinbusch
a,
Hubertus V. M.
Hamelers
*a,
Caroline M.
Plugge
b and
Cees J. N.
Buisman
a
aSub-department of Environmental technology, Wageningen University, Bomenweg 2, 6703 HD, Wageningen, The Netherlands. E-mail: bert.hamelers@wur.nl; Fax: +31 317 482108; Tel: +31 317 483447
bLaboratory of Microbiology, Wageningen University, Dreijenplein 10, 6703 HB, Wageningen, The Netherlands. Fax: +31 317 483829; Tel: +31 317 483752
First published on 11th November 2010
Abstract
This research introduces an alternative mixed culture fermentation technology for anaerobic digestion to recover valuable products from low grade biomass. In this mixed culture fermentation, organic waste streams are converted to caproate and caprylate as precursors for biodiesel or chemicals. It was found that acetate, as the main intermediate of anaerobic digestion, can be elongated to medium chain fatty acids with six and eight carbon atoms. Mixed microbial communities were able to produce 8.17 g l−1 caproate and 0.32 g l−1 caprylate under methanogenesis-suppressed conditions in a stable batch reactor run. The highest production rate was 25.6 mM C caproate per day with a product yield of 0.6 mol C per mol C. This elongation process occurred with both ethanol and hydrogen as electron donors, demonstrating the flexibility of the process. Microbial characterization revealed that the microbial populations were stable and dominated by relatives of Clostridium kluyveri.
Broader contextSustainability and environmental issues emerge as a result of the global consumption of fossil resources. Looking for alternatives resources, biomass use could potentially contribute to a more sustainable society for the production of renewable fuels or chemicals. To which extent the renewable fuels or chemicals are sustainable, depends mainly on its production process and the biomass feedstock. Using wet organic fraction of municipal, industrial or agricultural wastes as feedstock seems an attractive sustainable feedstock in a society with a growing world population. It reduces the competition for land with food production, and potentially saves large quantities of greenhouse gas emissions. A proven sustainable low-cost technique that recovers valuable products from wet organic biomass is anaerobic digestion, a mixed culture fermentation. Mixed culture fermentations have also been researched for the production of hydrogen, ethanol, short chain carboxylates and polyhydroxybutyrate. This manuscript describes another type of mixed culture fermentation, the production of medium chain fatty acids (MCFAs). MCFAs have higher energy densities and a lower solubility in water compared to ethanol due to their longer hydrocarbon tail that enables selective removal. Caproic acid production has been reported as a side product during sugar fermentation, but its potential within wet organic waste conversion has not been assessed yet. |
1. Introduction
There is an increasing global demand for sustainable production of biodiesel and chemicals. In a recent feasibility study waste and agricultural residues were identified as high-potential feedstock for the sustainable production of biofuels and chemicals because of their large availability. The use of waste and agricultural residues as sustainable feedstock for the production of biofuels could enable an increase in fuel and chemical supply, would reduce greenhouse gas emissions, and would hardly compete with food production.1 This study focusses on the conversion of a part of the available biomass, the so-called “wet biomass”, such as the organic fraction of municipal solid waste consisting of carbohydrates, lipids and proteins. Dealing with wet biomass streams requires a flexible process that can convert the mixture of organic components present in the waste in an economical way, despite the high moisture content. Mixed culture fermentation is a potentially powerful technology for this type of material, as it doesn't require sterile process conditions. Fermentations with undefined mixed cultures have already been demonstrated to be energy-efficient and cost-effective on small and large scale for anaerobic digestion of wet biomass streams to biogas.2 Other mixed culture fermentation methods currently employed are composting, anaerobic digestion, hydrogen, carboxylate and polyhydroxybutyrate production. However, limited technologies are available for wet biomass conversion to liquid biofuels.3,4When applying mixed culture fermentation for the conversion of wet biomass to liquid fuels or chemicals, part of the anaerobic digestion process can be used to solubilise and homogenise the raw material. The key intermediates in anaerobic digestion that are produced during these homogenising steps are hydrogen, carbon dioxide and volatile fatty acids (VFAs). These VFAs are carboxylic acids with 2 to 5 carbon atoms. VFAs themselves are unsuitable as fuel directly because of their high oxygen-to-carbon ratio and low energy density, but they can serve as raw material for the production of liquid biofuel in a follow-up step. Levy et al.5 and Holtzapple et al.,3 for example, described a process to use VFAs, mainly acetate, as a precursor for fuel alcohol, which can be blended with gasoline. Levy et al.5 mentioned the possibility to produce medium-chain fatty acids (MCFAs) from the same organic matter. Physical properties suggest that MCFAs would be superior to VFAs as intermediates for further processing to chemicals or fuels. This is because MCFAs with 6 or 8 carbon atoms (caproic and caprylic acid) have a longer hydrophobic carbon chain and a lower oxygen/carbon ratio compared to VFAs, like acetate (0.33 or even 0.25), which increases the energy density and makes separation from the fermentation broth easier.
Caproate production is reported as a side-product in acidogenic fermentations of complex biomass or sugar.5–7 High concentrations of VFAs with small amounts of ethanol and an elevated hydrogen pressure induce production of a carboxylic acid with a longer chain such as butyrate or caproate. Anaerobic bacteria that produce caproic acid are characterised by a special metabolism. Those bacteria have a fatty acid synthase complex that enables them to elongate ethanol and short chain fatty acids as acetate, also called reversed β-oxidation. Caproic acid production from ethanol with acetate has been reported for Clostridium kluyveri8 or Eubacterium pyruvativorans,9 or from ethanol with cellulose by co-cultures of C. kluyveri with ruminal cellulolytic bacteria.10
The metabolism starts with ethanol oxidation to acetate. Accordingly acetate is activated to acetyl CoA and is elongated in a cyclic pathway to butyrate using NADH and FADH2. Similarly, butyrate can be elongated via butyl CoA in a similar cycle to caproate. In this metabolism, ethanol is used as electron donor. In a mixed culture fermentation, however, not only ethanol (eqn (1)), but hydrogen can be used as electron donor as well (eqn (2)), because hydrogen and acetate can also be converted to ethanol.11 The simplified caproic acid production reactions are:
| C2H3O−2 + 2C2H6O → C6H11O−2 + 2H2O; ΔG′r = −79 kJ mol−1 reaction | (1) |
| 3C2H3O−2 + 2H++4H2 → C6H11O−2 + 4H2O ΔG′r = −177 kJ mol−1 reaction | (2) |
Ethanol and hydrogen can be produced from second generation biomass by anaerobic bioconversions. Hydrogen is co-produced during acidification of biomass,12 or by bio-electrolysis,13 whereas ethanol can be generated from biomass by either acetate reduction with hydrogen11 or as a reduced product of sugar fermentation. Ethanol and hydrogen are fuels as such, but the reason for using them to convert acetate to MCFAs is to increase the total amount of energy to be recovered from biomass. The heating value of 1 mole of caproic acid (3452 kJ) is clearly higher than the heating value of 2 moles of ethanol (2638 kJ) required to produce caproic acid. Combined with the more straightforward phase separation, one can argue that MCFAs are suitable candidates for energy carriers or chemicals to be produced from wet organic residues.
The objective of the research was to maximise MCFA production to be the main product in a mixed culture fermentation from wet organic residues. Since acetate is the main intermediate product of anaerobic digestion, we used acetate as substrate in the synthetic medium in our feasibility study. The production of MCFAs such as caproic and caprylic acid was demonstrated using mixed cultures in a suppressed-methane anaerobic environment in two different experimental setups. The first experiment was a batch test in which MCFA production was investigated using acetate with or without the electron donors ethanol and hydrogen. The second experiment was performed with a controlled (fed-)batch reactor in which MCFA production was investigated using both electron donors at pH 5.5 and 7.0. From the bioreactor with the highest MCFA productivity, the microbial population was characterised using Denaturing Gradient Gel Electrophoresis (DGGE) analysis, combined with cloning and sequencing.
2. Materials and methods
2.1 Inoculum
The inoculum was an enrichment derived from granular sludge of a UASB reactor treating brewery wastewater.2.2 Medium
The medium for the batch experiment contained substrate (see next paragraph) with additionally per litre: 3600 mg NH4H2PO4, 330 mg MgCl2·6H2O, 200 mg MgSO4·7H2O, 150 mg KCl, 200 mg CaCl2·2H2O, 1 ml of vitamin solution,14 1 ml of trace element solution14 and 10 g of 2-bromoethanosulfonic acid as inhibitor of methanogenesis.15 For the fed-batch run, medium was composed as described above, but 330 mg MgCl2·6H2O and 200 mg MgSO4·7H2O were replaced by 600 mg MgCl2.2.3 Batch experiment
MCFA production from acetate was stimulated with hydrogen, ethanol or with a combination of both hydrogen and ethanol. The experiment was performed in triplicate and one control was included without electron donor. In total 12 serum flasks of 125 ml with rubber stoppers and aluminium caps were used. Each flask contained 37.5 ml of growth medium plus 50 mM acetate and 6 flasks contained also 50 mM ethanol. Before inoculation, the pH was adjusted to 5.5 with 2 M NaOH solution. After inoculation with 4.8 g of wet sludge, the flasks were closed and capped. The headspace was flushed 8 times between 0.5 × 10⁵ and 1.5 × 10⁵ Pa with nitrogen or hydrogen to finally 1.5 × 10⁵ Pa. The bottles were incubated at 30 °C in a rotating shaker (170 rpm) for 105 days. At day 0, 2, 7, 14, 21 and 105 the gas pressure was measured by a GMH 3150 meter (Greisinger Electronics, Germany), and a gas sample (0.1 ml) was taken to directly analyse the gas composition using a GC. Meanwhile, a liquid sample (0.5 ml) was anaerobically taken and collected in a reaction tube. The pH was measured in the liquid sample with a pH microelectrode BlueLine 16 pH (Schott, Germany) and corrected manually in the bottles with either 2 M HCl or 2 M NaOH solution to maintain its value between 5.35 and 5.65. The liquid sample was centrifuged (5 min, 9300g) and diluted with formic acid solution to 1.5% (v/v) for fatty acid analysis, and with water for alcohol analysis.2.4 Setup of controlled (fed-)batch reactors
The fermentation was performed in controlled (fed-)batch reactors in an experimental setup as shown in Fig. 1. Each reactor was of hand made glass with a total volume of 1 litre. Reactors 1 and 2 were filled with 471 and 541 ml medium containing 50 mM acetate and 50 mM ethanol, respectively. The difference in liquid volumes was determined by the height of the overflow, but it is not expected to have an effect on the performance as the reactors run in batch. The reactors were positioned on a magnetic stirrer for agitation of the medium at 200 rpm. The medium was continuously flushed with hydrogen (200 ml h−1) using a mass flow controller (Brooks 5850E, PA, USA) with a small pore size sparger. Effluent gas volume was determined using a gas meter type MGC-1 MilliGascounter (Ritter, Germany). The redox potential was monitored (Meterlab, France) with an Ag/AgCl redox electrode type QR480x (QIS, the Netherlands). Reactor temperature was controlled at 30 °C. The pH was measured and controlled at pH 5.5 or 7 with a pH controller with either a 2 M NaOH or HCl solution.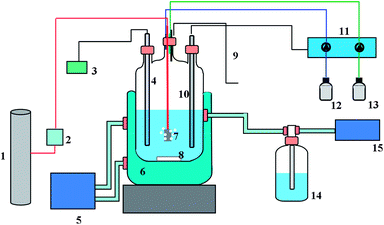 | ||
| Fig. 1 Schematic representation of setup of the bioreactor: (1) hydrogen gas bottle, (2) mass flow controller, (3) redox potential meter, (4) redox electrode, (5) water bath, 303 K, (6) water mantle, (7) gas inlet, (8) magnetic stirrer, (9) sampling, (10) pH electrode, (11) pH controller, (12) base stock (NaOH, 2 M), (13) alkaline stock (HCl, 2 M), (14) overflow and gas valve, and (15) gas volume meter. | ||
2.5 Operation of the reactors
Reactors 1 and 2 were operated over a period of 116 days. Liquid and gas phases were sampled regularly and analysed for alcohol, VFA and headspace gas composition, and for DNA composition. At each sampling instant redox potential, pH and total effluent gas volume were measured. Whenever the ethanol concentration was lower than 100 mg l−1, concentrated ethanol solution (40 g l−1) was added to the reactor to obtain a concentration of 2.5–3 g l−1. The yield calculations are based on the amount of consumed substrate. This amount was corrected for the mole amount of ethanol evaporated from the reactor fluid by the continuous gas flow. The calculation is based on the vapour pressure of ethanol and the gas flow using the ideal gas law. The vapour pressure was calculated by multiplying the mole fraction of the actual ethanol concentration in the water times the saturation pressure of ethanol (1.03 × 10⁴ Pa at 30 °C).2.6 Chemical analysis
Hydrogen, oxygen, nitrogen, methane and carbon dioxide were analysed by gas chromatography.11 Fatty acids (2 to 8 carbon atoms) were analysed by gas chromatography using a Hewlett Packard 5890 series II equipped with a glass column (2 m × 6 mm × 2 mm) packed with 10% Fluorad 431 on Supelco-port 100–120 mesh. Prepared samples (1.0 µl) were directly injected in the column at 200 °C. The carrier gas was nitrogen saturated with formic acid at 40 ml min−1. The column temperature was 130 °C for 4 min, raised linearly at 12 °C min−1 ramp to 160 °C for 6.5 min. Fatty acids were detected with a FID at 280 °C using hydrogen at 30 ml min−1 and air at 400 ml min−1. Alcohols were eluted using the same settings, but at constant column temperature of 70 °C.Protein determination with the modified Hartree–Lowry method16 was used to estimate bacterial cell concentration in a small sample volume. One ml of reactor liquid was transferred in a 2 ml vial and centrifuged (5 min, 9300g). Supernatant was removed and the pellet was resuspended in 1 ml of 1 M NaOH. The vial was left for 30 min at 50 °C to hydrolyse the cells. Accordingly, protein concentration of the hydrolysed cells was quantified using modified Hartree–Lowry method. It was determined that 1.0 g of protein corresponded to 4.07 g of volatile suspended solids (R2 = 0.99).
2.7 DNA extraction, amplification and DGGE
The microbial population of reactor R1, with the highest MCFA production, was characterised. Bacterial genomic DNA was extracted from weekly taken reactor liquid samples using a FastDNA® SPIN Kit for Soil (Qbiogene, Carlsbad, CA). DNA concentration and integrity were measured with the NanoDrop® spectrophotometer. From extracted DNA, bacterial 16S rRNA was amplified with primers U968-f (with GC clamp) and L1401-r using the GoTaq polymerase kit (Promega, Madison, WI) with 5× Green buffer as described by the Promega instructions. The fragments were amplified using the following program: 94 °C for 2 min, 35 cycles of 94 °C for 30 s, 56 °C for 40 s, 72 °C for 60 s, and 72 °C for 5 min. All primers were synthesised commercially by Biolegio (Nijmegen, the Netherlands). Bacterial amplicons were subsequently separated by DGGE using a denaturant gradient of 30–60% as described by Zoetendal et al.17 and band profiles were compared.2.8 Cloning and sequencing
From the DGGE profile, two samples of the reactor run R1 were selected for further analysis. The selection was based on the high MCFA production activity at time the sample was taken and the high amount of representative bands in the profile of the sample. Before cloning, bacterial 16S rRNA was amplified from the genomic DNA using primers 27f and 1492r. The fragments were amplified using the following program: 94 °C for 2 min, 35 cycles of 94 °C for 30 s, 52 °C for 40 s, and 72 °C for 90 s, and 72 °C for 5 min. The amplicons were purified using DNA Clean & Concentrator™-5 kit (Zymo Research, Orange, CA). The purified amplicons were ligated in pGEM-T easy vector (Promega, Madison, WI) and cloned into Escherichia coli JM109 by transformation. After blue white screening, 96 white colonies of each bioreactor sample were transferred onto medium containing 200 µl of LB plus 20 µg ampicillin and grown overnight on a shaker at 37 °C. To lyse the cells, 5 µl overnight culture plus 45 µl Tris–EDTA buffer were incubated at 95 °C for 10 min. The inserts were amplified with primers T7 and Sp6 using the following PCR program: 94 °C for 2 min, 35 cycles of 94 °C for 30 s, 52 °C for 40 s, and 72 °C for 90 s, and 72 °C for 7 min. The PCR products were screened with ARDRA using restriction enzymes AluI, CfoI and MspI (Promega, Madison, WI) according to Sousa18 to check the distribution and the number of phylotypes present. Amplicons with unique ARDRA patterns were purified using the DNA Clean & Concentrator™-5 kit again and were subjected to DNA sequence analysis. The analysed 16S rRNA sequences were compared with sequences in the GenBank database using the NCBI Blast search program (http://blast.ncbi.nlm.nih.gov%20/Blast.cgi). Closest relatives and cultured relatives were retrieved from the database, together with their degree of similarity.A neighbour-joining tree was made based on the 16S rRNA gene sequences determined in this study, and related reference sequences. Dehalococcoides ethenogenes was included as an outgroup. Alignment and phylogenetic analysis were performed with the ARB software,19 using the most recent release of the ARB-Silva reference database version 102. Tree was calculated for E. coli positions 518–894. Sequences retrieved in this study are accessible under the accession numbers: GU216598–GU216630, excluding the numbers ending with 03, 12, 13 and 28.
3. Results
3.1 Effect of substrate on MCFA production
In the batch experiment, fatty acids to a chain length of 8 carbon atoms and alcohols to a chain length of 6 carbon atoms were produced from acetate with hydrogen and/or ethanol.Depending on the substrate combination, different products were formed. Fig. 2 shows the exact product distribution after 116 days. Caproate was formed in all experiments with electron donor but not in the control experiment. Caprylic acid, the product with the highest caloric value, was formed in two experiments: containing acetate with hydrogen; and containing acetate with both ethanol and hydrogen. Table 1 shows the stoichiometry for the production of 1 mol of caproate in each of the three experiments. From an economical point of view, the reaction mixture that uses the lowest ethanol![[thin space (1/6-em)]](https://www.rsc.org/images/entities/char_2009.gif) :acetate ratio is most interesting. For detailed further research we focused on acetate conversion, but added both ethanol and hydrogen to ensure a sufficient amount of electron donor in the controlled reactor.
:acetate ratio is most interesting. For detailed further research we focused on acetate conversion, but added both ethanol and hydrogen to ensure a sufficient amount of electron donor in the controlled reactor.
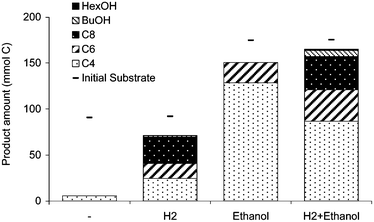 | ||
| Fig. 2 Effect of electron donor on final product distribution in mol carbon of converted carbon during acetate fermentation to MCFA and alcohols; no electron donor (−), with hydrogen (H2) and/or ethanol as electron donor—indicates the initially added amount of substrate in carbon. | ||
3.2 Effect of pH on MCFA production
In the controlled reactor experiment, the substrate combination of acetate with hydrogen and ethanol was fermented at pH 5.5 and 7. Caproate was produced at both pH 5.5 and 7, while caprylate was produced surprisingly only at pH 7. Table 2 shows that the MCFA concentration and production rate were higher at pH 7 than at pH 5.5. Fig. 3 shows the substrate and product concentrations of the best performing reactor at pH 7. Caproate and caprylate were produced during three active periods. During the active periods, ethanol was consumed fast and extra ethanol was added 3 times to prevent depletion. Production of n-butyrate started after a lag-time of 20 days. During that period, the redox potential decreased from initially 39 mV to −500 mV vs. Ag(s)/AgCl. When the butyrate concentration reached 450 mg l−1, caproate production started and increased exponentially. When the caproate concentration reached 501 mg l−1, caprylate production started. After 40 days, ethanol was completely consumed, and the production of butyrate and caproate stopped. Ethanol addition did not lead directly to a continuation of the fermentation. It took 7 days before production of caproate and caprylate was restored. Remarkable is that the n-butyrate concentration did not increase further, but remained constant at 2.0 g l−1. After the second time that ethanol was almost consumed completely, ethanol was added immediately, which avoided a lag in conversion. A third ethanol addition after 75 days, however, was too late as it took 19 days until the microbial activity was recovered. After 115 days, the reactor run was stopped.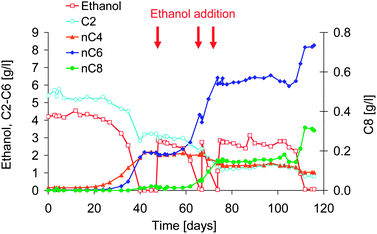 | ||
| Fig. 3 Concentration of ethanol and C2–C8 fatty acids in time of the fed-batch reactor operation at pH 7, with initially acetate and ethanol as substrate. The red arrows indicate the times of ethanol addition. | ||
Fig. 4 shows the carbon distribution over the products of the total converted substrate. Caproate was the main product of the fermentation. After each ethanol addition, the yield of caproate formation increased from 0.36, 0.51, 0.58 to finally 0.60 mol C caproate per mol C of the converted substrates; the caprylate yield was 0.02 mol C caprylate per mol at the end. Whereas the caproate yield increased in time, the butyrate yield decreased in time. This suggests that butyrate was further converted to caproate. At the end of the run, 19% of the converted substrate carbon was not recovered as VFA or MCFA product, but had been converted to biomass and CO2. A remaining 9% of the converted carbon could not be assigned to any product. The biomass production accounted for 6.5% of the converted carbon. The biomass yield was at maximum 0.064 mol C per mol C, based on protein concentration. CO2 was measured at a very low percentage, around 0.01%, which is close to the detection limit. In this way, CO2 accounted for approximately 14% of the converted carbon. For one mole of produced caproate, 3.8 moles of ethanol and 1.09 moles of acetate were consumed. At the mean time 0.14 moles of butyrate, 0.03 moles of caprylate and 0.45 moles of biomass were formed.
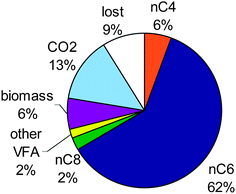 | ||
| Fig. 4 Product distribution in carbon among n-butyrate (nC4), caproate (nC6), caprylate (nC8), other VFA (such as propionate, i-butyrate and (i/n)-valerate); biomass and CO2 at the end of the fermentation at pH 7, with initially acetate and ethanol as substrate. | ||
3.3 Growth and microbial characterization
Microbial growth was determined by the increase in DNA and protein concentration in the reactor. Doubling time was 0.06 d−1 on average and was highest on day 32 at 0.35 d−1. The growth yield was difficult to determine over the three active periods, because the active periods were sometimes shorter than the time between biomass measurements. Fig. 5 shows the bacterial population dynamics in time by means of a DGGE gel of 16S rRNA. From the DGGE profile, the DNA samples of day 74 (S1) and 110 (S2) were selected for the reactor run for cloning. Based on the ARDRA pattern of all clones and sequencing of part of the clones, 13 different phylotypes can be distinguished among a total of 86 analysed clones (Table 3). Relatives of C. kluyveri were most abundant in both samples: 58% and 38% of all clones analysed showed high homology with band no. 1 (Fig. 5). A phylogenetic tree showing the relationship between the clones and other related species is depicted in Fig. 6. Comparison of the DGGE pattern (Fig. 5) of the reactor samples with patterns of the sequenced clones revealed that bacteria closely related to C. kluyveri (98% similarity) and Azospira oryzae (99%) were the dominant species at day 74 and day 110. Visual comparison of the DGGE profiles of each sample over time revealed that after 17 days in all sample bands C. kluyveri and A. oryzae proliferated. After these 17 days, only minor shifts in numbers of bands and their intensity were observed, indicating a quite stable microbial population in the bioreactor.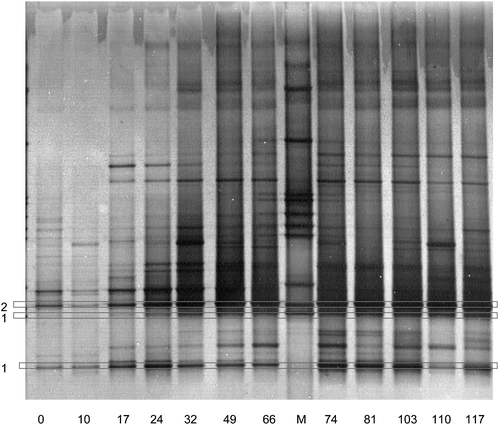 | ||
| Fig. 5 DGGE band patterns of bacterial 16S rRNA gene amplicons from 12 reactor samples taken at different time (days). M is a Marker. The numbers indicating DGGE bands correspond to clones listed in Table 3. | ||
| Closest bacterial relative 16S rRNA phylotypes | Amount | |
|---|---|---|
| S1a | S2a | |
| a S1 was the DNA of sample of day 74 and S2 of day 110. | ||
| 1 C. kluyveri | 26 | 14 |
| 2 A. oryzae | 18 | 14 |
| 3 Uncultured Rhodocyclaceae from MFC-B162-F06 | 2 | |
| 4 Uncultured Rhodocyclaceae | 1 | |
| 5 Clostridiaceae bacterium FH052 | 1 | |
| 6 Uncultured Clostridiales from MFC-B162-F04 | 1 | |
| 7 Propionibacterium acidipropionici | 1 | |
| 8 Propionivibrio limicola | 1 | |
| 9 Uncultured clone 16saw35-1b12.p1k | 1 | |
| 10 Uncultured clone ANTLV1_C11 | 1 | |
| 11 Uncultured clone MES_rTCB90 | 1 | |
| 12 Unidentified ZF3 | 1 | |
| 13 Sedimentibacter sp. C7 | 1 | |
| Total clones | 45 | 37 |
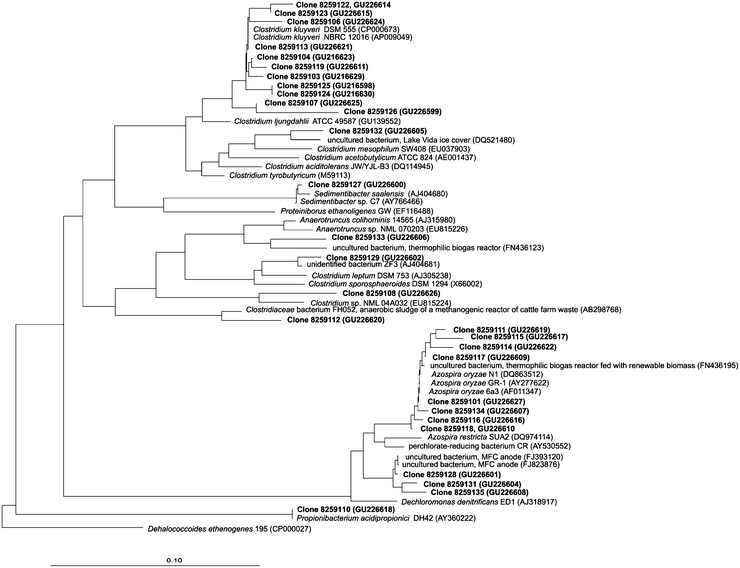 | ||
| Fig. 6 Neighbour-joining tree based on the 16S rRNA gene sequences determined in this study, and related reference sequences. Dehalococcoides ethenogenes was included as an outgroup. The reference bar indicates 10% sequence divergence. GenBank accession numbers are given in parentheses. | ||
4. Discussion
This part discusses the novelty of the fermentation and characterises the fermentation on basis of technical performance and microbial populations at described conditions. Understanding those characteristics helps to determine the potential of the mixed culture fermentation and leads to new research questions to optimise caproic and caprylic acid production from low grade biomass for future applications.4.1 Performance of MCFA fermentation
This research clearly demonstrates that it is feasible to produce mainly MCFAs from acetate by mixed culture fermentation. For caproate and caprylate production, both ethanol and hydrogen, as well as a combination of both, are suitable electron donors. Most recent literature reporting significant caproate production was by Kenealy et al. and Ding et al. However, concentrations reported in these researches were lower than found in this research. Kenealy et al. used co-cultures of C. kluyveri and cellulotic rumen species.10 They reported the production of 2.6 g butyrate l−1 and 4.6 g caproate l−1 from 4.4 g l−1 ethanol and 6.0 g l−1 cellulose with a yield of 0.647 mol C per mol C. Ding et al. used undefined mixed cultures and reported caproate production of 1.3–2.7 mM from 20 g glucose l−1 with a yield of 0.10–0.21 mol C per mol C.6 In this paper, the highest MCFA concentration obtained in the controlled reactor operation at pH 7 was significantly higher, namely 8.2 g caproate l−1. Such a high concentration has never been reported before to our knowledge. The production of caprylate has not been demonstrated before. The achieved caproate and caprylate concentrations are around the maximum solubility of the undissociated acid form. A higher MCFA production was limited due to a shortage of ethanol, so the maximum achievable concentration in the bioreactor and therefore the full potential of this fermentation technology could not be demonstrated during our study.On a carbon basis, 9% of the carbon was recovered neither as butyrate, caproate and caprylate, nor as biomass or CO2. Possibly, this is due to inaccurate CO2 measurements that were below the detection limit. Another explanation might be that not all biomass was taken into account when calculating the growth yield. Only suspended biomass was measured, while in the reactor also a biofilm on the glass was formed. The attached biomass growth could not be taken into account in the overall calculations. Improvements of the experimental setup may resolve these uncertainties.
In the batch experiments, it was demonstrated that both ethanol and hydrogen could serve as electron donors for the production of MCFA. As hydrogen and ethanol can also be produced from residual biomass, MCFA production will not depend on the availability of solely one type of feedstock.11,13 As the feedstock price determines a large portion of the costs, flexibility in electron donor choice and therefore in biomass feedstock choice may help to reduce costs. In the controlled reactor experiment, both electron donors were supplied at the same time to provide sufficient electron donor. Here it was found that ethanol was preferred by the populations over acetate and hydrogen. At pH 7, even 3.8 times more ethanol was consumed than acetate. This ratio is higher than the stoichiometric value for the MCFA formation (eqn (1)). A plausible reason would be that part of the consumed ethanol is converted by another metabolic process to CO2, which will be discussed further on. Nevertheless, it is important to reduce this high ethanol/acetate ratio and increase the product yield in order to make the MCFA fermentation profitable from agricultural residues. Otherwise, it would be more effective to use ethanol as fuel itself on energetic or cost basis MCFA fermentation studies with real organic waste as substrate should reveal the amount of additional electron donor needed for the conversion.
4.2 MCFA fermentation dominated by C. kluyveri
Very likely, a relative of C. kluyveri is responsible for the MCFA production in the experiment, as it dominated the microbial population in the MCFA producing bioreactor. As Ding et al. already suggested that C. kluyveri could be responsible for caproic acid production in his mixed culture fermentation, this study supports this theory.6 Besides the product formation during the fed-batch operation, the phylogenetic similarities are second strong indication that a relative of C. kluyveri is involved in the fermentation. The ethanol–acetate metabolism is quite unique for anaerobes and can be described by three coupled reactions.20 First, ethanol is converted to acetate producing NADH and ATP via substrate level phosphorylation. Second, the fatty acid as acetate is elongated in a cyclic pathway to butyrate using CoA, NADH and FADH2 through the coupling of two acetyl-CoA moieties to butyryl-CoA in a cyclic loop.20 Third, further chain elongation to caproate occurs from butyrate and ethanol in a similar loop by coupling butyryl-CoA with acetyl-CoA. Concluding from this mechanism, in every loop 2 carbons are added up to the original carboxylic acid. This results in products with an even number of carbon atoms. In our experiments, the fermentation occurs in a similar way as first ethanol was consumed, and then butyrate was produced, followed by caproate production (Fig. 3). Caprylate formation has not been reported before for C. kluyveri. Most likely, in our experiment, caprylate was formed in a similar loop coupling hexyl-CoA with acetyl-CoA.Besides C. kluyveri species, the microbial population in the bioreactor was dominated by a species related to A. oryzae. A. oryzae (also known as Dechlorosoma oryzae) is a nitrogen-fixing β-proteobacterium that is also able to reduce chlorate or selenate. Presumably, Azospira converted ethanol to CO2 with the inhibitor BES as electron acceptor. With the tetrahedral structure with three oxygen bonds in the sulfonate part, BES is comparable to the chemical structure of electron acceptors chlorate or selenate. Ye et al.21 showed that long-term exposure to BES did not only eliminate Archaea but also altered the bacterial community structure by acting as a competing electron acceptor for sulfate-reducing bacteria or dehalogenating microorganisms.21,22 Further research should study possibilities to inhibit methanogenesis without addition of BES to prevent substrate removal by methanogenesis or by oxidation of BES. A possible solution is applying heat shocks to the microbial populations as was performed in a previous study.7 In contrast to methanogens, the active Clostridia in our process will survive heat treatment due to their capacity to form heat-resistant spores. Applying heat treatment has also limitations as it will increase operational costs and is difficult to fit in a continuous system.
MCFA product formation was pH dependent. It was found that MCFA production was higher at pH 7 than at pH 5.5 in the controlled reactor. At pH 5.5 in the reactor no caprylate was formed, whereas at pH 5.5 in the batch flask experiment, the caprylate concentration was almost equal to that of caproate. Since the experimental setups were different, the results are difficult to compare. An explanation for the different product formation might be the difference in ethanol and acetate concentration or hydrogen partial pressure. In the controlled batch, a surplus of hydrogen was continuously sparged into the stirred reactor, whereas in the batch experiment hydrogen was only added in the beginning of the experiment and became limited afterwards. It is known that hydrogen pressure plays a role in the initial metabolic reaction of C. kluyveri (ethanol oxidation).6,11 Ethanol oxidation occurs as long as the NADH/NAD ratio remains low by other NADH consuming reactions as hydrogen production listed by Ding et al.6 One could argue whether the higher hydrogen partial pressure at pH 5.5 limited the MCFA production. Though it most be noted that a certain hydrogen partial pressure is needed to prevent oxidation of MCFAs by other microorganisms in the mixed culture fermentation. High hydrogen pressure or ethanol concentration makes it energetically favourable for microorganisms to use VFA as electron acceptors (eqn (1) and (2)). At these reduced conditions (−300 mV vs. NHE), coupling of fatty acids is presumably the best mechanism for an organism to release its electrons.20,23
4.3 Application
The obtained MCFA concentration and production rate are such that it is meaningful to further study MCFA fermentation as a new starting point for the production of biodiesel or chemicals. The maximum caproate production rate was 2.6 g COD g−1 VSS d−1, which is in the same order of magnitude as the conversion rate of applied anaerobic processes such as anaerobic digestion. A conversion rate of acetoclastic methanogenesis that was found at a similar temperature of 30 °C was two times higher: 5.1 g COD g−1 VSS d−1. Since this was a first demonstration of the principle of MCFA production with mixed cultures, further research can lead to an increase of the caproate production rate. A suggestion to increase the production rate is to study the process in a continuous flow mode with cell retention. In this way, enrichment of the MCFA producing bacteria will occur, which will increase production rates and avoid the long startup times of batch runs. The full potential of the conversion should not only be assessed by technology development, but as well on the type of feedstock, application, demand and scale of deployment possible with this technology.Caproic and caprylic acid can be used as a chemical itself or can be further processed to diesel or kerosene-like components by ketonization.24,25 Ketonization is a catalytic reaction in which two carboxylic acids are coupled to a linear ketone with 2n − 1 carbon atoms, carbon dioxide and water. For example, for caproic acid was shown that 2 molecules could be converted to 6-undecanone over a ceria–zirconia catalyst at a temperature above 573 K.25 Ketonization has been demonstrated for other carboxylates as well.24 So the presence of little caprylate that is formed in the fermentation can also be utilised in the catalysis step. So, combining MCFA production and separation with ketonization could result in a long-chain ketone of 11 to 15 carbons in which oxygen is almost completely eliminated. Ketonization can be performed with both dissociated salts and undissociated acids dissolved in a solvent, depending on the optimal separation technique. Further research should reveal how caproate can be best separated from the fermentation broth, as it is a crucial step in the total process.
It is important to study how MCFA fermentation can be integrated in an overall process chain starting with biomass pre-treatment and finishing with product removal and recovery and possibly further processing. Such an integrated process design will make it possible to get insight into the economical viability, the total energy efficiency and the expected scale of the total plant. In general, the feedstock price determines mainly the production cost of the fuel or chemical from biomass.26
5. Conclusions
In the presented study, medium chain fatty acids were produced from acetate with hydrogen and/or ethanol as electron donor. At pH 7, a stable, mixed microbial population that was dominated by relatives of C. kluyveri was able to produce 8.17 g l−1 caproate and 0.32 g l−1 caprylate in a stable reactor run, under methanogenesis suppressed conditions. The highest production rate was 0.485 g l−1 caproate d−1 with a product yield of 0.6 mol C per mol C.Acknowledgements
The authors thank Sjors van Iersel for his contribution to the experimental work, Hugo Roume, Hans Hertog and Marjet Oosterkamp for their contribution to the characterization of the microbial population; Hauke Smidt for beautification of the phylogenetic tree; Tim Grootscholten, Alex Hol and Annemiek ter Heijne for their valuable comments. This project is financially supported by the NEO program of SenterNovem, the Dutch governmental agency for sustainability and innovation from the Ministry of Finance.Notes and references
- D. Tilman, R. Socolow, J. A. Foley, J. Hill, E. Larson, L. Lynd, S. Pacala, J. Reilly, T. Searchinger, C. Somerville and R. Williams, Science, 2009, 325, 270–271 CrossRef CAS.
- G. Lettinga and L. W. Hulshoff Pol, Water Sci. Technol., 1991, 24, 87–107 CAS.
- M. T. Holtzapple, M. K. Ross, N. S. Chang, V. S. Chang, S. K. Adelson and C. Brazel, ACS Symp. Ser., 1997, 666, 130 CAS.
- R. Kleerebezem and M. C. M. van Loosdrecht, Curr. Opin. Biotechnol., 2007, 18, 207–212 CrossRef CAS.
- P. F. Levy, J. E. Sanderson, R. G. Kispert and D. L. Wise, Enzyme Microb. Technol., 1981, 3, 207–215 CrossRef CAS.
- H.-B. Ding, G.-Y. A. Tan and J.-Y. Wang, Bioresour. Technol., 2010, 101, 9550–9559 CrossRef CAS.
- K. J. J. Steinbusch, E. Arvaniti, H. V. M. Hamelers and C. J. N. Buisman, Bioresour. Technol., 2009, 100, 3261–3267 CrossRef CAS.
- H. A. Barker, M. D. Kamen and B. T. Bornstein, Proc. Natl. Acad. Sci. U. S. A., 1945, 31, 373–381 CrossRef CAS.
- R. J. Wallace, N. McKain, N. R. McEwan, E. Miyagawa, L. C. Chaudhary, T. P. King, N. D. Walker, J. H. A. Apajalahti and C. J. Newbold, Int. J. Syst. Evol. Microbiol., 2003, 53, 965 Search PubMed.
- W. R. Kenealy, Y. Cao and P. J. Weimer, Appl. Microbiol. Biotechnol., 1995, 44, 507–513 CrossRef CAS.
- K. J. J. Steinbusch, H. V. M. Hamelers and C. J. N. Buisman, Water Res., 2008, 42, 4059–4066 CrossRef CAS.
- C. L. Li and H. H. P. Fang, Crit. Rev. Environ. Sci. Technol., 2007, 37, 1–39 CrossRef CAS.
- B. E. Logan, D. Call, S. Cheng, H. V. M. Hamelers, T. Sleutels, A. W. Jeremiasse and R. A. Rozendal, Environ. Sci. Technol., 2008, 42, 8630–8640 CrossRef CAS.
- J. R. Phillips, K. T. Klasson, E. C. Clausen and J. L. Gaddy, Appl. Biochem. Biotechnol., 1993, 39, 559–571 CrossRef.
- M. Soubes, L. Muxi, A. Fernandez, S. Tarlera and M. Queirolo, Biotechnol. Lett., 1994, 16, 195–200 CrossRef CAS.
- D. R. Caprette, in Experimental Biosciences, Laboratory methods, Rice University, Houston, Texas, USA, 1995 Search PubMed.
- E. G. Zoetendal, A. D. L. Akkermans, W. M. Akkermans-van Vliet, J. A. G. M. De Visser and W. M. De Vos, Microb. Ecol. Health Dis., 2001, 13, 129–134 CrossRef.
- D. Z. Sousa, M. A. Pereira, H. Smidt, A. J. M. Stams and M. M. Alves, FEMS Microbiol. Ecol., 2007, 60, 252–265 CrossRef CAS.
- W. Ludwig, O. Strunk, R. Westram, L. Richter, H. Meier, A. Yadhukumar, A. Buchner, T. Lai, S. Steppi, G. Jacob, W. Förster, I. Brettske, S. Gerber, A. W. Ginhart, O. Gross, S. Grumann, S. Hermann, R. Jost, A. König, T. Liss, R. Lüßmann, M. May, B. Nonhoff, B. Reichel, R. Strehlow, A. Stamatakis, N. Stuckmann, A. Vilbig, M. Lenke, T. Ludwig, A. Bode and K. H. Schleifer, Nucleic Acids Res., 2004, 32, 1363–1371 CrossRef CAS.
- H. Seedorf, W. F. Fricke, B. Veith, H. Brüggemann, H. Liesegang, A. Strittmatter, M. Miethke, W. Buckel, J. Hinderberger, F. Li, C. Hagemeier, R. K. Thauer and G. Gottschalk, Proc. Natl. Acad. Sci. U. S. A., 2008, 105, 2128–2133 CrossRef CAS.
- D. Ye, J. F. Quensen, III, J. M. Tiedje and S. A. Boyd, Appl. Environ. Microbiol., 1999, 65, 327–329 CAS.
- P. C. Chiu and M. Lee, Appl. Environ. Microbiol., 2001, 67, 2371–2374 CrossRef CAS.
- W. H. Kunau, V. Dommes and H. Schulz, Prog. Lipid Res., 1995, 34, 267–342 CrossRef CAS.
- M. Renz, Eur. J. Org. Chem., 2005, 979–988 CrossRef CAS.
- C. A. Gaertner, J. C. Serrano-Ruiz, D. J. Braden and J. A. Dumesic, J. Catal., 2009, 266, 71–78 CrossRef CAS.
- C. B. Granda, L. Zhu and M. T. Holtzapple, Environ. Prog., 2007, 26, 233–250 CrossRef CAS.
| This journal is © The Royal Society of Chemistry 2011 |