Prospects of on-chip fuel cell performance: improvement based on numerical simulation†
Satoshi Tominaka‡
a,
Sousuke Ohtaa,
Tetsuya Osaka*a and
Richard Alkireb
aDepartment of Applied Chemistry, Graduate School of Advanced Science and Engineering, Waseda University, Tokyo, 169-8555, Japan. E-mail: osakatets@waseda.jp
bDepartment of Chemical & Biomolecular Engineering, University of Illinois, Urbana, IL 61801, USA
First published on 27th October 2010
Abstract
On-chip fuel cells are promising power sources for future electronics and microdevice applications including on-chip sensors and micro-air-vehicles. Previously, we reported a small scale (0.4 mm wide and 6 mm long) on-chip fuel cell of an air-breathing, membrane-less and monolithic design, which exhibited the highest power for an on-chip fuel cell, 1.4 μW (J. Am. Chem. Soc., 2008, 130, 10456). In order to improve the performance, precise understanding of the phenomena occurring in the cells is of primary importance. Thus, this paper focuses on understanding cell operation by using numerical simulation, and on implementing cell improvements based on the simulation results. The initial quantitative study concluded that the performance of the on-chip fuel cell was limited owing to oxygen-supply caused by cathode flooding. Thus, we experimentally added the hydrophobic ionomer (Nafion) onto the cell to reduce the influence of the flooding, and successfully increased the maximum power from 2.0 to 2.8 μW. This power is considered sufficient for microsensor application. On the basis of additional simulation results, we show that performance may potentially be improved to over 100 μW by increasing the effective surface areas of catalysts to a level comparable with methanol fuel cells. If successful, such performance enhancements would position the on-chip fuel cell as a viable candidate for future micro-devices, and point to promising directions for fuel cell development efforts.
Broader contextDevelopment of power-sources is generally slower than that of devices needing them, thus, such sluggish development has been one of the critical issues for the practical application of devices, e.g., cellular phones and electric vehicles. This holds true for micro-devices, such as micro-sensors. As a promising power source of such, novel on-chip fuel cells fabricated on Si wafers or polymeric films have recently been reported. In order to improve their performance, this paper focuses on a precise understanding of cell operation by using numerical simulations, and on implementing cell improvements based on these simulation results. Consequently, the cell performance was successfully improved from 2.0 to 2.8 μW, by modifying the cell as the simulation results indicated. This power is considered sufficient for micro-sensor application. On the basis of additional simulation results, we show that performance may potentially be improved to over 100 μW by increasing the effective surface areas of catalysts. If successful, such performance enhancements would position the on-chip fuel cell as a viable candidate for future micro-devices, and point to promising directions for fuel cell development efforts. |
Introduction
Recent progress in micro-electromechanical systems (MEMS) and on-chip devices, e.g., micro-air-vehicles and micro-sensors,1–3 inevitably requires the development of on-chip power sources, including micro-solar cells,4 micro-batteries,5–7 and micro-fuel cells.8–10 Among these, micro-fuel cells are attractive in terms of their possible operation as long as fuel and oxidant are supplied. Toward this goal, novel on-chip fuel cells have recently been reported, which are of an air-breathing, membraneless and monolithic design, where all the components necessary for power generation were integrated on a single substrate, e.g., Si wafers and polymeric films (Fig. 1).9,10 The design is suitable for miniature fuel cells in terms of: (i) the air-breathing structure enables oxygen supply passively from air; (ii) the membraneless structure eliminates bulky membrane with a thickness comparable to the cell; and (iii) the monolithic structure eliminates troublesome alignment of the microelectrodes. In addition, the air-breathing structure is a requisite for miniature fuel cells with a submillimeter microchannel in terms of energy loss caused by its strong capillary forces.11 The cell operates on a liquid fuel solution (e.g., methanol, ethanol and 2-propanol)10 supplied through the microchannel by the strong capillary force, and oxygen from the air without pumping.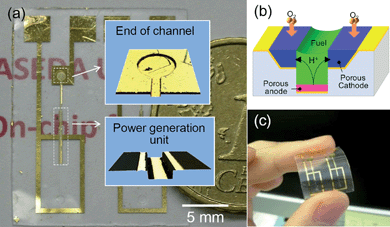 | ||
| Fig. 1 (a) Photograph of an on-chip fuel cell fabricated on a cycloolefin polymer film (two cells are on a single film). Insets: Confocal microscope images of the end of the microchannel (upper image), where fuel solution is dropped to supply the power generation section (lower image) by a strong capillary force. (b) Schematic illustration of the power generation mechanism. Fuel is oxidized on the porous anode, the protons thus-generated transfer through the solution to the cathode, where the protons and oxygen from air react to form water. (c) Demonstration of the flexibility of the cell. | ||
The initial demonstration of on-chip fuel cells has attracted wide attention as well as scientific interest.12–14 For the continued development of well-engineered on-chip fuel cells, improved performance is needed, for which precise understanding of phenomena occurring in the cell is of great importance. The maximum power of the on-chip cell operating on methanol was ca. 2 μW,10 which was the highest value for on-chip fuel cells.9 It is possible that performance can be further improved, because the surface area of catalysts used to date has been at least ten times less than that of common methanol fuel cells.15 Moreover, there are possibilities that other factors limit the performance of the current on-chip fuel cells.
Ambiguity in power-source development has been one of the critical issues for the practical application of devices.16 The view taken in this work is that numerical simulation is a valid way to clarify the present state and point to promising directions for improvement of micro-power sources. Recently, finite element analysis on a mathematical model of a 3D-trench micro-battery was reported in order to clarify the phenomena occurring in the system and also to point out strategies for the optimization of the design.17 In this paper, simulation of the phenomena occurring in the on-chip fuel cell are compared with experimental data in order to test their validity, and to identify promising directions for further development of on-chip fuel cells.
Model definition
The geometry of the cell is shown in Fig. 2a. The cell is composed of a microchannel, an anode and two cathodes. In detail, the porous anode is deposited on the bottom of a microchannel, which is filled with a fuel solution containing sulfuric acid as ionic conductor. The fuel solution is dropped onto the end of the channel and then supplied passively by the strong capillary force of the microchannel. The two cathodes are exposed to air and are also in contact with the fuel solution so that protons generated at the anode can transfer through the fuel solution to the cathodes. The bottom faces of each electrode are current collectors having a high electronic conductivity to external connections. | ||
| Fig. 2 Geometry of the on-chip fuel cell used for simulation. (a) Birds-eye 3D view of the microchannel of an on-chip fuel cell. The blue regions are porous cathodes, and the red region is a porous anode. Inset: The green region shows a microchannel filled with fuel solution. (b) Cross-sectional view of a half of the power generation unit. Inset: Whole of the cross-section. The dimensions are as follows: Rectangular deep channel: 100 μm deep and 100 μm wide (half); Anode (half): 5 μm thick and 50 μm wide; Cathode: 5 μm thick and 80 μm wide. | ||
For numerical efficiency, the simulation geometry was simplified, as illustrated in Fig. 2b, to one half of the symmetrical cross-section of the cell. As indicated in the figure, the cell consists of a (i) microchannel filled with a fuel solution containing proton conductor; (ii) a porous anode on the bottom of the channel; and (iii) a porous cathode exposed to air as well as the electrolyte solution.
Because rigorous calculations are not necessary for a useful preliminary analysis of the system, several simplifying assumptions have been introduced. We comment briefly in the Conclusions below to identify which of these assumptions should be refined for future investigations.
• Cell performance is uniform along the length direction of the microchannel. That is, the model describes two-dimensional variations over the cross-section seen in Fig. 2b. Gradients in concentration and potential along the length direction are ignored.
• The methanol concentration on the upper surface of the electrolytic solution is constant throughout the cell.
• Both electrodes are uniformly porous, and the fuel solution fills the cathode to its upper surface but does not extend above it.
• The only reactions are the oxidation of methanol to CO2 at the anode and the reduction of oxygen to H2O at the cathode.
The model is based on multiple physicochemical phenomena including electrode reactions, electronic charge balance, ionic charge balance, and mass balance as described in the following paragraphs.
Electrode reactions (Tafel equation)
The net anode reaction is assumed to be the complete oxidation reaction of methanol to carbon dioxide:| CH3OH + H2O → CO2 + 6H+ + 6e− | (1) |
Since, in the range of current densities investigated here, no bubbles were observed, it is assumed that the CO2 dissolves in the electrolyte.
The net cathode reaction is assumed to be the 4-electron reduction of oxygen to water:
| O2 + 4H+ + 4e− → 2H2O | (2) |
Since the cell was a membraneless design, one may be concerned that the methanol oxidation reaction occurs on the cathode, but it is assumed to be negligible because of the use of a selective catalyst, i.e., Pd–Co alloy.18,19 In addition, it is assumed that oxygen reaction at the anode is negligible, because both the diffusivity and the solubility of oxygen in aqueous solutions are low.
Since these reactions are regarded as irreversible in view of the slow reverse reactions, kinetics of these electrode reactions is expressed in accordance with the Tafel equation. The kinetic current density based on active surface area for the forward reactions, ik, is expressed as follows.
 | (3) |
| η = ϕe − ϕi − Δϕ0 | (4) |
The cell voltage is expressed as the difference of inner potentials between cathode (ϕe,c) and anode (ϕe,a).
| Vcell = ϕe,c − ϕe,a | (5) |
Electronic charge balance (Ohm's law)
The electrons involved in the electrode reactions transfer through the porous electrodes to/from the current collectors according to Ohm's law. The electronic charge balance for the electrodes is expressed as the following two-dimensional equation.
 | (6) |
 | (7) |
![[small sigma, Greek, dot above]](https://www.rsc.org/images/entities/i_char_e156.gif) e is the effective electronic conductivity, S the specific surface area, σe the bulk electronic conductivity, P the porosity factor, and τ is the tortuosity factor of the conductive paths. The bottom surfaces of the porous anode and cathodes are connected to current collectors which have the potentials of ϕe,a and, ϕe,c, respectively.
e is the effective electronic conductivity, S the specific surface area, σe the bulk electronic conductivity, P the porosity factor, and τ is the tortuosity factor of the conductive paths. The bottom surfaces of the porous anode and cathodes are connected to current collectors which have the potentials of ϕe,a and, ϕe,c, respectively.
Ionic charge balance (Ohm's law)
The electrolyte is an aqueous solution of H2SO4, which corresponds to a binary electrolyte and which, furthermore, is assumed to have a constant value of ionic conductivity independent of position. Under these conditions the passage of current through the solution obeys Ohm's law where the conductivity corresponds to that of the binary salt.| i = −σs∇ϕi | (8) |
 | (9) |
Where use is made of an effective solution conductivity in the porous electrode,
 | (10) |
Mass balance (Fick's law)
Within the porous electrodes, transport and reaction of oxygen (cathode) and methanol (anode) occur by molecular diffusion and electrochemical reaction
 | (11) |
 | (12) |
 | (13) |
![[r with combining macron]](https://www.rsc.org/images/entities/i_char_0072_0304.gif) is the mean pore radius. For the oxygen diffusion even in air, the λ value is 6.91 × 10⁻⁸ m (at 25 °C, atmospheric pressure),20 thus the Knudsen diffusion occurs when the pore radius is below 3.45 nm ( < 3.45 nm). Therefore, since the λ value is generally less than 1 nm in aqueous solution, the assumption of molecular diffusion is justified.
is the mean pore radius. For the oxygen diffusion even in air, the λ value is 6.91 × 10⁻⁸ m (at 25 °C, atmospheric pressure),20 thus the Knudsen diffusion occurs when the pore radius is below 3.45 nm ( < 3.45 nm). Therefore, since the λ value is generally less than 1 nm in aqueous solution, the assumption of molecular diffusion is justified.
| CO2,l = sCO2,g | (14) |
Oxygen solubility is known to depend on the electrolyte concentration, and can be estimated with use of the equation reported by Narita et al.21
 | (15) |
Numerical methodology
As indicated previously,10 the performance of the on-chip fuel cells seemed to be dominated by the cathode reaction, thus this paper focuses on the cathode, especially in its flooded condition.The model was solved using a general PC (Windows XP) with a partial-differential-equation solver, Comsol Multiphysics 3.5a.22 The solver was a parametric solver with a linear system solver of Direct(UMFPACK). Using the solver, the cell performance was simulated by decreasing the voltages from 0.7 V to 0 V. This process took about 20 min. The mesh was created to have number of mesh points of 9133 and triangular elements of 17856, and its minimum element quality was 0.5841 (details are shown in the ESI†).
Experiments for verification
The on-chip fuel cell was fabricated on a Si wafer by methods reported previously.9Fig. 3 illustrates the fabrication sequence for the cell tested in this work. In brief, on the Au anode current collector, Pt–Ru was electrodeposited using galvanic pulse deposition.10 On the Au cathode current collectors, Pd–Co was electrodeposited at −200 mA cm−2 for 60 s (12 C cm−2).10 Then, the cell was coated with a 0.5 wt% Nafion solution (5 wt% Nafion solution diluted with isopropanol) by spin-coating at 1000 rpm for 30 s and then dried at 130 °C for 15 min. Since the thickness of the Nafion layer deposited on a flat Si wafer was found to be 30 nm by a stylus method, the cell was still regarded as “membraneless”.
The current–voltage curve was measured (HZ-3000, Hokuto Denko), and the electrode was observed by a high-resolution scanning electron microscope at 1.0 kV (HR-SEM, S5500, Hitachi). The contact angle of a water drop on a Pd–Co smooth film deposited on a flat Au current collector was measured by the sessile drop method with pure water (LCD-400S, Kyowa Interface Science) and the angle was compared with that of a Pd–Co film coated with Nafion ionomer.
Results and discussion
Performance of the on-chip fuel cell
Experimental data on cell performance are shown in Fig. 4a. The maximum power was ca. 2.0 μW and the short-circuit current was ca. 14 μA. Fig. 4b shows that the anode potential slightly increased around open circuit and then gradually increased with a slope of ca. 100 mV decade−1 above 3 μA. The slope value was found to be consistent with a value obtained from the fundamental voltammetry test, ca. 101 mV decade−1, using a three-electrode cell (Fig. 4c) and also to be in the range reported in literatures.23–25 On the other hand, the cathode potential slightly decreased with a ca. 60 mV decade−1 slope around open circuit and then drastically decreased above 4 μA. The slope was found to be consistent with a fundamental value, ca. 55 mV decade−1, obtained by voltammetry test (Fig. 4d) and also with the value in our previous paper on the precise analysis of electrodeposited Pd–Co catalyst (ca. 60 mV decade−1).18,19 Thus, the drastic decrease above 4 μA is attributed to the mass-transfer limitation, i.e., to slow oxygen diffusion. That is, cell performance was limited mainly by slow oxygen transport to the cathode. | ||
| Fig. 4 Performance of an on-chip fuel cell (experimental data). (a) Current–voltage curve and current–power curve. (b) Potentials of each individual electrode (Tafel plots). (c) Pt–Ru catalyst performance evaluated by cyclic voltammetry at 5 mV s−1. Electrolyte: air-saturated 0.5 M H2SO4 containing 2 M methanol. Inset: Tafel plot. (d) Pd–Co catalyst performance evaluated by linear sweep voltammetry at 1 mV s−1. Electrolyte: oxygen-saturated 0.5 M H2SO4. Inset: Tafel plot. | ||
For the following simulations, we used the Tafel slope values and exchange current densities obtained by the voltammetry tests. For the anode Pt–Ru catalyst, the exchange current density based on geometrical area was determined to be 2.17 × 10⁻⁴ A m−2. Validity of this value is verified as follows. Specific activities of Pt–Ru catalysts were reported as 0.11–0.16 mA cm−2 at 0.5 V vs. reversible hydrogen electrode (RHE) for the unit surface of Pt80Ru20 under similar experimental conditions. The surface composition of our Pt–Ru alloy was determined to be Pt81Ru19 by X-ray photoelectron spectroscopy (details will be reported in a future paper).26 The exchange current value described above corresponds to an activity of 1.94 mA cm−2 (geometrical surface area) at 0.5 V vs. RHE. Since the roughness factor of the Pt–Ru electrode was estimated as roughly 25 on the basis of our preliminary CO stripping tests (ESI†), our value was confirmed to be consistent with the reference value. Thus, the value obtained was found to be valid.
Likewise, for the Pd–Co catalyst, the exchange current density based on geometrical area was determined to be 4.85 × 10⁻⁷ A m−2. By comparing the performance with our previous papers,18,19 since the performance of this catalyst was confirmed to be typical for Pd–Co catalyst, the value is confirmed to be valid. The value is for the oxygen-saturated solution, hence we used 0.97 × 10⁻⁷ A m−2 as the exchange current density for the air-saturated solution (p = 0.2).
Consideration on the limiting factors of the cell performance
 | ||
| Fig. 5 Current–voltage curve and current–power curve obtained by simulation for an on-chip fuel cell having the same catalyst activities as those obtained by voltammetry. Inset: each individual electrode potential. | ||
As for the anode, the potential of the actual cell was lower than that of the simulated one, suggesting some unexpected improvement of the anode performance. This may be simply due to the difference of measurements: one is voltammetry (nonsteady state), and the other is potential steps (steady state). Alternatively, the anode improvement may be attributed to the possibility of oxygen reduction on the anode. In view of the membraneless design, the oxygen in the fuel solution can be reduced at the anode Pt–Ru catalyst, perhaps resulting in the promotion of CO removal (i.e., the so-called air bleed mechanism).27 Since such parasitic oxygen-reduction reaction may cause a current loss, the limiting diffusion current density in an air-saturated solution is calculated from the voltammogram (Fig. 4d) as ∼0.1 mA cm−2. This value corresponds to 0.6 μA for the anode (0.1 × 6 mm2), showing that the current loss is not significant. Thus, the air-containing fuel solution is considered to be favorable for on-chip fuel solution.
The simulation results also show that performance is limited by the cathode as its overpotential departed from a linear approximation above 50 μA (inset, Fig. 5), but the value is more than ten times larger than the experimental observation. The limitation may therefore be different from that of the actual cell. To elucidate the cause, the simulation results shown in Fig. 6 illustrate Ohmic losses caused by electronic and ionic resistances, as well as concentration gradients for the cell operating at short circuit. The electronic Ohmic loss is in the range of 1 nV (Fig. 6a). The loss caused by ionic resistance in the electrolyte is at most 20 mV at the cathode and negligible at the anode (Fig. 6b). The methanol concentration at the anode surface was only slightly reduced, to 95% of the bulk concentration (Fig. 6c). The oxygen concentration in the porous cathode is almost zero throughout except for the vicinity of the upper surface exposed to air (Fig. 6d). Thus, the cathode limitation is attributable to this oxygen shortage in the porous cathode, although the short-circuit current obtained by the simulation (ca. 370 μA) is significantly larger than the experimental value, 14 μA.
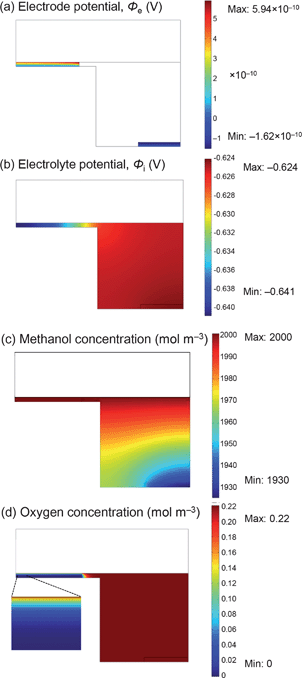 | ||
| Fig. 6 Each parameter obtained by the simulation of an on-chip fuel cell having the same catalyst activities as those obtained by voltammetry. (a) Electrode potential profile associated with Ohmic loss caused by electronic resistance. (b) Electrolyte potential profile associated with Ohmic loss caused by ionic resistance. (c) Methanol concentration profile. (d) Oxygen concentration profile. | ||
 | ||
| Fig. 7 Performance obtained by the simulation for an on-chip fuel cell having low catalyst utilization (cathode: 35%; anode: 100%) with flooding of a 25-μm thick fuel solution layer. (a) Current–voltage curve and current–power curve. Inset: Potentials of each individual electrode (Tafel plots). (b) Oxygen concentration profile. | ||
| Maximum power/μW | Maximum power density per volumea/mW cm−3 | Cathode roughness factorb | Anode roughness factorc | Utilization degree of cathode catalyst (%) | Flooding | |
|---|---|---|---|---|---|---|
| a The volume is calculated from the footprint area of the power generation unit, 2.4 mm2, and the thickness of the substrate, 0.2 mm. b The experimental value was calculated from double layer charge of cyclic voltammogram scanned in 0.5 M H2SO4 as reported previously.18 c The experimental value was obtained from a preliminary test of CO stripping voltammetry as described in the ESI.† d This value means that the fuel solution level was 25-μm higher than the cathode surface as shown in Fig. 7b. | ||||||
| Experiment | 2.0 | 4.2 | 50 | 25 | 35 | severe |
| 2.8 | 5.8 | 50 | 25 | 5 | modest | |
| Simulation | Calculated values | Assumed values and conditions | ||||
| 2.6 | 5.4 | 50 | 25 | 35 | 25 μm thickd | |
| 6.3 | 13 | 50 | 25 | 5 | no | |
| 11 | 23 | 50 | 25 | 35 | no | |
| 14 | 29 | 50 | 25 | 100 | no | |
| 61 | 130 | 500 | 250 | 100 | no | |
| 120 | 250 | 1000 | 1000 | 100 | no | |
Comparing the potentials of each individual electrode between the experimental data and the simulated data, we found that the cathode potential of the actual cell gradually decreased to a lower current than the simulated one. This gradual limitation can probably be attributed to the nonuniform porosity of the Pd–Co layer (cf. the SEM image shown in Fig. 9). In addition, the behavior of the current–voltage curve around the open circuit voltage (<1 μA) was apparently different from the experimental observation (cf.Fig. 4a). Considering that the calculated Tafel slopes have linear behavior even at the low current region, the I–V curve difference was found to originate from the non-linear behavior of the cell anode potential. We suggest that oxygen reduction on the anode can account for this non-linear behavior, but further detailed experiments will be needed for definitive conclusions.
Verification of the validity of the simulation results by experimental observations
As discussed above, simulation results provided insight into the on-chip fuel cell operation which suggests the next step to increase the performance, i.e., addition of hydrophobicity to the cathode. Thus, to experimentally test the expected improvement, the hydrophobicity of the cathode layer was increased by coating the cell with a thin Nafion layer.As shown in Fig. 8a, the addition of a Nafion ionomer resulted in an increase in the maximum power from 2.0 μW to 2.8 μW, and in the short-circuit current from 14 μA to 35 μA. The Tafel plots (Fig. 8b) show that the larger cathode current can account for the improvement, probably originating from the reduction of flooding as indicated by the high contact angle of the Nafion-coated Pd–Co layer, i.e., 95.8° (compared to 10.5° for the pristine Pd–Co layer). In addition, the coated Nafion did not seem to clog the pores of the catalyst layer (Fig. 9a and b), and only small portion of polymeric substance was observed in the high resolution SEM images (arrows in Fig. 9b). These experimental data indicate that cell performance was improved by adding Nafion ionomer to the on-chip fuel cells.
 | ||
| Fig. 8 Performance of an actual on-chip fuel cell with Nafion coating (filled dots) compared with that without Nafion (open dots). (a) Current–voltage curves (green lines) and current–power curves (black lines). The right photographs show the contact angles of Pd–Co thin film with and without Nafion coating. (b) Potentials of each individual electrode (Tafel plots). | ||
 | ||
| Fig. 9 Characterization of the Nafion-coated electrodes. (a, b) Plan-view SEM images of the Pd–Co catalyst layer. (a) Low magnification. (b) High magnification. Insets: the layer without Nafion. (c, d) Cyclic voltammograms of the catalysts deposited on the on-chip fuel cell before (red) and after (blue) Nafion coating, scanned in a nitrogen-saturated H2SO4 at 50 mV s−1. (c) Pt–Ru anode catalyst. (d) Pd–Co cathode catalyst. | ||
The addition of Nafion ionomer, however, was accompanied by a decrease in cathode catalyst activity as seen in its potential decrease by 40 mV (Fig. 8b). Our simulation indicates that this deterioration corresponded to the further decrease in the catalyst utilization degree from 35% to 5%. Since the Pd–Co voltammograms before and after Nafion coating are almost the same (Fig. 9c) and, moreover, since the catalyst activities were the same between the Nafion-coated Pd–Co catalyst and the pristine catalyst (data not shown), the cathode deterioration is probably caused by a decrease in the reactive sites within the porous electrode where there is ready access to all three essentials: oxygen, ionic current and electron current. In addition, some of the catalyst may have dried out.
As for the anode, the performance was further improved around the open circuit, but became congruent with the behavior of the cell without Nafion above ∼10 μA. Interestingly, the voltammogram of the anode Pt–Ru layer shows smaller response than the pristine one (Fig. 9d), indicating the coated Nafion ionomer reduced the pseudo capacitance originating from surface Ru redox reactions. Though such unexpected improvements of the anode performance are interesting, we need further detailed analyses to determine the mechanism of this improvement.
The experimental performance was successfully improved by adding Nafion ionomer, but did not reach to the expected values obtained by simulations for maximum power of 11 μW and short-circuit current of 290 μA. This is partly caused by the reduction of cathode catalyst utilization. Taking the deterioration of cathode catalyst into consideration, the maximum power of 6.2 μW and the short-circuit current of 180 μA would be expected (cf.Table 1, figure not shown), suggesting that flooding still occurred even in the case of Nafion-coated cell, and limited the performance. This interpretation is supported by the observation that the cathode coated with Nafion still shows a diffusion limitation (Fig. 8b).
Discussion on the future prospects
The maximum power values of the on-chip fuel cells having different catalyst-layer conditions, summarized in Table 1, provide insight into future development directions. First, the severe flooding due to the absence of a separating membrane should be suppressed by adding hydrophobic materials, and also by creating improved catalyst layers having more homogeneous porosity. As observed in Fig. 9a, the electrodeposited dendrites have too large pores between the dendrites, which are indeed considered to promote oxygen transport but are probably filled with fuel solution even when Nafion ionomer is added. Second, since the surface area of the catalyst layers are much smaller than those of general direct methanol fuel cells, i.e., by a few thousand times, the surface area of catalysts should be increased without clogging the microchannels or short-circuiting in order to improve the cell performance up to values comparable to the general fuel cells (volumetric power density).We believe that mesoporous electrodes, as we have synthesized so far by the combination of electrodepositon and dealloying,15,28 can fulfil both the requisites for catalyst layers. The electrode has a large surface area comparable to nanoparticle-based catalysts. Moreover, its continuous and high porosity is of great advantage in terms of mass-transfer because of its low tortuosity and high porosity. In the case of such sponge-like materials with continuous pores, e.g., Vycor porous glass, the tortuosity factor is dependent on the porosity factor. Roughly speaking, in both cases of Knudsen diffusion and molecular diffusion, tortuosity factor (τ) is ∼1.0 when the porosity (P) is 0.8 (τ = ∼2.0 when P = 0.4).29
When the above requisites described are fulfilled, the cell performance was found from simulations to be ∼120 μW, making the on-chip fuel cell a promising power source for wide applications. The power of 140 μW corresponds to a volumetric density of 0.25 W cm−3 (the footprint area needed for the power generation part: 0.4-mm wide × 6-mm long; the substrate thickness: 0.2 mm), which is comparable to the state-of-the-art air-breathing DMFC system, e.g., 0.3 W cm−3 at 25 °C (Sharp Corp., 2008). Therefore, stacking of integrated on-chip fuel cells will open the possibility of the on-chip fuel cell applications in general electronics such as cell phones and laptops.
Conclusion
This paper clarified that the performance of the on-chip fuel cell developed to date has been dominated by limitations associated with the cathode. As suggested by simulation results, the addition of hydrophobic material (i.e., Nafion ionomer) was found experimentally to improve the short-circuit current from 14 to 35 μA, resulting in the increase of the maximum power from 2.0 to 2.8 μW. Moreover, based on simulation results, the performance may be expected to increase to as much as ∼120 μW with the use of catalyst layers with large surface areas, and by appropriate cathode modification to improve cathode catalyst utilization degree. This power is equivalent to ∼250 mW cm−3, which is comparable to that of the state-of-the-art power of a passive direct methanol fuel cell. Thus, as is also the case with the general methanol fuel cells, catalyst developments are of great importance to increase the cell power. Unlike fuel cells types which also need membrane developments, on-chip fuel cell performance depends almost solely on catalyst layer conditions. We conclude that synthesis of uniform catalyst layers with large surface area will dramatically improve the on-chip fuel cell performance to the level where the cells would be a viable candidate power source for future electronic devices.The current model neglects transient terms including decrease of reactant concentration and increase of CO2 concentration, and also 3D influences including the gradual depletion of methanol along with the channel direction. In the future, these terms should be included in order to obtain more precise estimates of performance, especially under high current operation. Such improvements in the model, coupled with continued experimental development of catalyst layers, should improve the understanding of on-chip fuel cells and lead to optimal design of the cell, especially the microchannel length.
Device development and material synthesis based on simulation will become commonplace in the next decade, considering the fact that such researches are recently active and increasing.30–34 Since the ambiguity of power-source development is one of the critical issues for the practical application of micro-devices, we believe that the approach taken here, which combines experiments and simulations from the outset, is of significant importance for the coming wide-spread application of micro-devices.
List of symbols
| i k | Kinetically controlled current density based on real surface area/A m−2 |
| i | Current density/A m−2 |
| η | Reaction overpotential/V |
| ϕ e | Inner potential of electrode phase/V |
| ϕ i | Inner potential of electrolyte phase/V |
| V cell | Cell voltage/V |
| C | Concentration/mol m−3 |
| p | Oxygen partial pressure in air, 0.2 |
| Δϕ0 | Inner potential difference under the standard conditions, 0 for anode and 1.2 for cathode (these values are referred to a normal hydrogen electrode)/V |
| α | Transfer coefficient for the charge transfer reaction, 0.5 |
| n n | Electron number for the net electrode reaction, 4 for cathode and 6 for anode |
| F | Faraday constant, 96480 /C mol−1 |
| R | Gas constant, 8.314/J mol−1 K−1 |
| T | Absolute temperature, 298.15/K |
| σ e | Electronic conductivity of the bulk, 9.66 × 10⁶ for anode and 9.5 × 10⁶ for cathode/S m−1 |
| e | Effective electronic conductivity in the porous electrode/S m−1 |
| σ s | Ionic conductivity of the bulk binary solution, 14.0 (pH 0.7, 25 °C)/S m−1. This value was experimentally obtained as shown in our previous report.35 |
| s | Effective ionic conductivity in the porous electrode/S m−1 |
| D | Diffusion coefficient of the bulk, 5 × 10⁻¹⁰ for methanol, 2 × 10⁻⁹ for oxygen in the solution and 2 × 10⁻⁵ for oxygen in air/m2 s−1 |
| Ḋ | Effective diffusion coefficient/m2 s−1 |
| C 0 | Concentration of the bulk, 2 × 10³ for methanol and 8.93 for oxygen in air/mol m−3 |
| τ | Tortuosity factor, 1.0 |
| P | Open porosity factor, 0.8 |
| s | Oxygen solubility in fuel solution, 1.1/mol m−3 |
| s 0 | Oxygen solubility in pure water, 1.27/mol m−3 |
| C SA | Concentration of sulfuric acid, 500/mol m−3 |
| i 0 | Exchange current density, 2.17 × 10⁻⁴ for anode and 4.85 p × 10−7 for cathode/A m−2 |
| n k | Electron number involved in the rate determining step of the electrode reaction, 1.17 for andoe and 2.15 for cathode |
| S | Specific surface area, 0.5 × 10⁷ for anode and 1.0 × 10⁷ for cathode/m−1 |
| Kn | Knudsen number |
| λ | Mean free path/m |
| | Mean pore radius/m |
Acknowledgements
This work was partly supported by the Grant-in-Aid for Specially Promoted Research “Establishment of Electrochemical Device Engineering” and by the Global COE program “Practical Chemical Wisdom” from the Ministry of Education, Culture, Sports, Science and Technology, Japan.References
- H. Sato, C. W. Berry, B. E. Casey, G. Lavella, Y. Yao, J. M. van den Brooks and M. M. Maharbiz, in MEMS 2008, IEEE, Tucson, AZ, USA, 2008, pp. 164–167 Search PubMed.
- D. Niwa, K. Omichi, N. Motohashi, T. Homma and T. Osaka, Sens. Actuators, B, 2005, 108, 721–726 CrossRef.
- R. Popovtzer, T. Neufeld, N. Biran, E. Z. Ron, J. Rishpon and Y. Shacham-Diamand, Nano Lett., 2005, 5, 1023–1027 CrossRef CAS.
- J. B. Lee, Z. Z. Chen, M. G. Allen, A. Rohatgi and R. Arya, J. Microelectromech. Syst., 1995, 4, 102–108 CrossRef CAS.
- H. Nakano, K. Dokko, J. I. Sugaya, T. Yasukawa, T. Matsue and K. Kanamura, Electrochem. Commun., 2007, 9, 2013–2017 CrossRef CAS.
- D. Golodnitsky, V. Yufit, M. Nathan, I. Shechtman, T. Ripenbein, E. Strauss, S. Menkin and E. Peled, J. Power Sources, 2006, 153, 281–287 CrossRef CAS.
- L. Baggetto, R. A. H. Niessen, F. Roozeboom and P. H. L. Notten, Adv. Funct. Mater., 2008, 18, 1057–1066 CrossRef CAS.
- S. C. Kelley, G. A. Deluga and W. H. Smyrl, Electrochem. Solid-State Lett., 1999, 3, 407–409 CrossRef.
- S. Tominaka, S. Ohta, H. Obata, T. Momma and T. Osaka, J. Am. Chem. Soc., 2008, 130, 10456–10457 CrossRef CAS.
- S. Tominaka, H. Nishizeko, S. Ohta and T. Osaka, Energy Environ. Sci., 2009, 2, 849–852 RSC.
- S. Tominaka, H. Obata and T. Osaka, Energy Environ. Sci., 2009, 2, 845–848 RSC.
- J. Yeston, Science, 2009, 325, 1321 CrossRef.
- Fuel cells: Breath of fresh air, in Asia Materials, Nature Publishing Group, 28th October 2008 (http://www.natureasia.com/asia-materials/highlight.php?id=287) Search PubMed.
- E. Shiells, in Chem. Technol., The Royal Society of Chemistry, Cambridge, 2009, p. T50 Search PubMed.
- S. Tominaka, Y. Nakamura and T. Osaka, J. Power Sources, 2010, 195, 1054–1058 CrossRef CAS.
- M. Armand and J. M. Tarascon, Nature, 2008, 451, 652–657 CrossRef CAS.
- V. Zadin, H. Kasemagi, A. Aabloo and D. Brandell, J. Power Sources, 2010, 195, 6218–6224 CrossRef CAS.
- S. Tominaka, T. Momma and T. Osaka, Electrochim. Acta, 2008, 53, 4679–4686 CrossRef CAS.
- S. Tominaka, S. Ohta, T. Momma and T. Osaka, ECS Transactions, 2007, 11, 1369–1377 Search PubMed.
- CRC Handbook of Chemistry and Physics, CRC Press, Boca Raton, FL, 2005 Search PubMed.
- E. Narita, F. Lawson and K. N. Han, Hydrometallurgy, 1983, 10, 21–37 CrossRef CAS.
- S. Tominaka, C. W. Wu, T. Momma, K. Kuroda and T. Osaka, Chem. Commun., 2008, 2888–2890 RSC.
- M. Watanabe and S. Motoo, J. Electroanal. Chem., 1975, 60, 267–273 CrossRef CAS.
- S. L. Gojkovic, T. R. Vidakovic and D. R. Durovic, Electrochim. Acta, 2003, 48, 3607–3614 CrossRef CAS.
- D. Chakraborty, H. Bischoff, I. Chorkendorff and T. Johannessen, J. Electrochem. Soc., 2005, 152, A2357–A2363 CrossRef CAS.
- S. Tominaka, M. Shigeto, H. Nishizeko and T. Osaka, Chem. Commun., 2010 10.1039/c0cc02611e.
- S. Gottesfeld and J. Pafford, J. Electrochem. Soc., 1988, 135, 2651–2652 CAS.
- S. Tominaka, T. Hayashi, Y. Nakamura and T. Osaka, J. Mater. Chem., 2010, 20, 7175 RSC.
- P. Levitz, Adv. Colloid Interface Sci., 1998, 76–77, 71–106 CrossRef CAS.
- A. Bazylak, D. Sinton and N. Djilali, J. Power Sources, 2005, 143, 57–66 CrossRef CAS.
- Z. Y. Fan, H. Razavi, J. W. Do, A. Moriwaki, O. Ergen, Y. L. Chueh, P. W. Leu, J. C. Ho, T. Takahashi, L. A. Reichertz, S. Neale, K. Yu, M. Wu, J. W. Ager and A. Javey, Nat. Mater., 2009, 8, 648–653 CrossRef CAS.
- M. D. Kelzenberg, S. W. Boettcher, J. A. Petykiewicz, D. B. Turner-Evans, M. C. Putnam, E. L. Warren, J. M. Spurgeon, R. M. Briggs, N. S. Lewis and H. A. Atwater, Nat. Mater., 2010, 9, 368–368 CrossRef CAS.
- S. Alayoglu, A. U. Nilekar, M. Mavrikakis and B. Eichhorn, Nat. Mater., 2008, 7, 333–338 CrossRef CAS.
- J. K. Norskov, T. Bligaard, J. Rossmeisl and C. H. Christensen, Nat. Chem., 2009, 1, 37–46 CrossRef CAS.
- S. Tominaka, N. Akiyama, F. Croce, T. Momma, B. Scrosati and T. Osaka, J. Power Sources, 2008, 185, 656–663 CrossRef CAS.
Footnotes |
| † Electronic supplementary information (ESI) available: Details of the simulation mesh; rough estimation of the active area of the PtRu electrode. See DOI: 10.1039/c0ee00179a |
| ‡ Current affiliation: World Premier International (WPI) Research Center for Materials Nanoarchitectonics (MANA), National Institute for Materials Science (NIMS), Namiki 1-1, Tsukuba, Ibaraki 305-0044, Japan. E-mail: E-mail: TOMINAKA.Satoshi@nims.go.jp |
| This journal is © The Royal Society of Chemistry 2011 |